


báo cáo hóa học:" High correlation of the proteome patterns in bone marrow and peripheral blood blast cells in patients with acute myeloid leukemia"
lượt xem 4
download
 Download
Vui lòng tải xuống để xem tài liệu đầy đủ
Download
Vui lòng tải xuống để xem tài liệu đầy đủ
Tuyển tập các báo cáo nghiên cứu về hóa học được đăng trên tạp chí sinh học quốc tế đề tài : High correlation of the proteome patterns in bone marrow and peripheral blood blast cells in patients with acute myeloid leukemia
Bình luận(0) Đăng nhập để gửi bình luận!
Nội dung Text: báo cáo hóa học:" High correlation of the proteome patterns in bone marrow and peripheral blood blast cells in patients with acute myeloid leukemia"
- Journal of Translational Medicine BioMed Central Open Access Methodology High correlation of the proteome patterns in bone marrow and peripheral blood blast cells in patients with acute myeloid leukemia Gero Hütter*1, Anne Letsch1, Daniel Nowak1, Julia Poland2, Pranav Sinha2, Eckhard Thiel1 and Wolf-K Hofmann1 Address: 1Department of Internal Medicine III (Hematology, Onkology), Charité Berlin Campus Benjamin Franklin, Berlin, Germany and 2Institute of Laboratory Medicine and Clinical Chemistry, LKH Klagenfurt, Austria Email: Gero Hütter* - gero.huetter@charite.de; Anne Letsch - anne.letsch@charite.de; Daniel Nowak - Daniel.Nowak@cshs.org; Julia Poland - Julia.poland@kabeg.at; Pranav Sinha - pranav.sinha@kabeg.at; Eckhard Thiel - haema.cbf@charite.de; Wolf- K Hofmann - W.K.Hofmann@charite.de * Corresponding author Published: 15 January 2009 Received: 12 September 2008 Accepted: 15 January 2009 Journal of Translational Medicine 2009, 7:7 doi:10.1186/1479-5876-7-7 This article is available from: http://www.translational-medicine.com/content/7/1/7 © 2009 Hütter et al; licensee BioMed Central Ltd. This is an Open Access article distributed under the terms of the Creative Commons Attribution License (http://creativecommons.org/licenses/by/2.0), which permits unrestricted use, distribution, and reproduction in any medium, provided the original work is properly cited. Abstract Background: When comparing myelogenous blasts from bone marrow and peripheral blood, immunophenotyping usually show a strong correlation of expression of surface antigens. However, it remains to be determined, whether this correlation also exists on the level of protein expression. Method: Therefore, we investigated both bone marrow and peripheral blood blast cells from six patients with newly diagnosed acute myeloid leukemia (AML) using conventional two-dimensional electrophoresis in the first dimension and linear polyacrylamide gels (12%) in the second dimension. Proteins were visualized using the silver staining method and image analysis was performed using the PDQuest system. Results: For each patient over 80 proteins were evaluated in the sample from peripheral blood and bone marrow. We could demonstrate that the protein expression profile of bone marrow did not significantly differ from the expression patterns of peripheral blast cells. Conclusion: The proteome-set of leukemic blast cells from marrow and blood, does not differ substantially when drawn from AML patients with over 80 percent blast cells in both compartments. This indicates that in AML, blasts from peripheral blood samples can be considered suitable for investigations of the proteome using 2D-electrophoresis. ers in future [1]. Up to date, the contribution of proteom- Background Acute myeloid leukemia (AML) is an aggressive hemato- ics to the management of patients with AML is negligible logical neoplasia and it is characterized by accumulating although an enormous effort has been undertaken to myeloid precursor cells in bone marrow and detection of develop databases of cancer proteins detected by two- such cells in peripheral blood. Cytogenetics and molecu- dimensional gel electrophoresis [2]. They contain 2-D lar diagnostics are helpful for an individualized therapy in patterns and information from patients with lymphopro- certain subsets of AML. There is hope that proteomics in liferative disorders, leukemia, and a variety of other cell AML will prompt new diagnostic or therapeutic biomark- populations [3-6]. These databases were developed pri- Page 1 of 8 (page number not for citation purposes)
- Journal of Translational Medicine 2009, 7:7 http://www.translational-medicine.com/content/7/1/7 marily from in vitro cell cultures. Experiences with corre- centrifugation to remove the precipitated nucleic acids, sponding in vivo samples are rare, even though cells from the supernatant was collected, for protein determination hematological disorders can easily be obtained for protein and for proteomic analysis. analysis. First investigations referring to the proteome of leukemia in vivo were undertaken from Hanash in the Protein determination middle 80's. Hanash screened polypeptides as markers to Since high concentration of urea and detergents interfere distinguish acute lymphoblastic leukemia (ALL) cell line- with any available protein assay system, we adapted a tur- ages [7]. Later the proteomic approach was used to iden- bidimetric assay especially for samples prepared for 2D tify Hsp27, which distinguishes between ALL in infants analysis[13]. In this assay, proteins are precipitated by and older children [8,9]. Recently, Balkhi and co-workers trichloroacetic acid and measured turbidimetrically at 720 were able to identify significant differences in the AML nm. Briefly, 35 ml of each sample was pipetted in dupli- proteome between cytogenetic groups of this disease. cate in wells of a 96-well microtitre plates (Nunc, Den- They postulated, that analysis of the post-translational mark). One hundred ml of 0.1 M HCl was added to each modifications could be useful to distinguish different sub- well and the mixture shaken for 1 mm. Twenty five ml of groups of AML [10]. 20% TCA was added to each well. The optical density was measured at 720 nm 5 min after TCA-addition using a Studies employing immunophenotyping methods in standard Dynatech MR 7000 ELISA photometer acute myeloid leukemias (AML) have shown a strong cor- (Dynatech, Hamburg). For evaluation, a non-linear stand- relation of surface antigen expression comparing bone ard curve with protein concentrations of 0.2, 1, 2 and 5 marrow and peripheral blood blast cells [11]. However, it mg/ml was used. Control material from Boehringer Man- remains unclear, whether there are differences in expres- nheim (Precinorm protein control serum) was used to sion levels on either protein or RNA-level which may indi- obtain the standard curves that were run with each deter- cate biological differences for both cell types. mination. In the present study, we aimed to investigate the profile of First dimension isoelectric focusing (IEF) protein expression of blast populations from peripheral First dimension glass tubes were placed in the Hoefer cast- blood and bone marrow aspirates using a proteomic system. Solution for IEF contains 8.24 g urea, 1.95 ml acr- ylamide solution (T = 28.38%, C = 1.92%)1, 600 μl car- approach with 2D-electrophoresis in newly diagnosed rier-ampholyte (CA) 5–7 (Servalyt), 200 μl CA 3.5–10 patients with AML. (Pharmacia), 3 ml Triton X 10%, 20 μl TEMED, and 30 μl ammonium persulfate 10%. The cathodic chamber was Materials and methods filled with 10 mM of sodium hydroxide and the anodic Sample preparation and solubilization Blast samples from bone marrow aspirates and peripheral chamber with 3.26 ml phosphoric acid 85%. The solution blood were isolated from six patients with Ficoll-centrifu- for the overlay contained 20% glycerol and 2% CA. Focus- gation and washed at least three times in large volumes of ing started with 200 V for 15 minutes, followed by 300 V phosphate-buffered saline (Table 1). The cell pellet was for 30 minutes and finally with 400 V for 60 minutes. solubilized according to Rabilloud in 9 M urea, 4% w/v After IE-focusing, the sample was added on the cathodic CHAPS, and 20 mM spermine and 40 mM DTT [12]. After side of the tube gel. The aliquot of the sample contained a Table 1: Patient and sample characteristics. WBC in μL (% blasts) Patient Sample-ID Age Gender FAB-subtype Karyotype Source A #02-05 60 Female M2 t(8;21) PB 4.8 (80%) #02-02 BM * B #02-06 22 Female M2 normal PB 379.0 (93%) #02-03 BM * C #02-24 63 Female M5b normal PB 120.0 (91%) #02-25 BM * D #02-33 46 Male M1 complex PB 11.2 (85%) #02-34 BM * E #02-37 27 Female M0 t(9;11) PB 5.2 (81%) #02-36 BM * F #02-39 58 Male M4 normal PB 37.0 (87%) #02-38 BM * WBC = white blood cell count, * = bone marrow samples were adjusted to 1.000.000 mononuclear cells per assay. Page 2 of 8 (page number not for citation purposes)
- Journal of Translational Medicine 2009, 7:7 http://www.translational-medicine.com/content/7/1/7 total of 10 μg of protein. Electrophoresis started with 200 In addition, for the patients A, B and E with refractory V for 15 minutes, followed by 300 V for 30 minutes and leukemia, there were additional samples available from finally 400 V for 12 hours. the time of relapse. The intervals for the date of collection from the first sample were: 6 months for patient A, 14 days for patient B, and 3 days for patient E. Analysis of the Second dimension SDS-page Tube-gels were sealed on top of linear polyacrylamide gels spot patterns from these samples showed an identical pro- (T = 30%, C = 2%) using a sealing solution (1% agarose, file as compared to the previously collected samples of the 0.2% SDS, 0.15 M Bis/Tris, 0.1 M HCl). The Iso-Dalt Sys- same individual (data not shown). tem contained a buffer of 58 g tris base, 299 g glycine, and 100 ml SDS 20%. The run was completed at 20 mA/gel Six proteins with two additional variants were found to be until the tracking dye reached the bottom of the gel [14]. expressed differentially within bone marrow and periph- After electrophoresis, the gels were fixed in 50% ethanol, eral blood cells of selected individuals (Table 2). Spot No. and 10% acetic acid for 12 hours. 5 (14-3-3 related) was only present in patient C, spot No. 121 and 122 (TCHTP and variant) was only present in patient F and G, respectively. Spot 60 (FK506 binding pro- Silver staining Proteins were visualized using the silver staining method tein 4) was absent in patient D and spots No. 91 (Ku anti- employing a modification of the method of Heukeshoven gen) and 115 (Rho A) were not present in patient C according to Sinha et al. [15,16]. (Figure 3). Furthermore, only patients F and G showed an expression of plasminogenactivator inhibitor-2 and a var- iant (spots 103 and 104). Image Analysis and Spot Identification Image analysis was performed using the PDQuest system according to the protocols provided by the manufacturer Discussion after scanning with the densitometer GS-710 (Bio-Rad, Analysis of cell populations in vivo can provide the highest CA, USA), the spot pattern of each patient sample was degree of fidelity for a snapshot of the protein changes summarized in a gel image. For protein identification, that occur as a cause or consequence of the malignancy. each gel image was matched to the previously 130 identi- Proteins rather than genes or mRNAs represent the key fied spots of the gastric carcinoma cell line EPG85-257 players in the cell. Expression levels of proteins determine [17]. To yield information about changes in the protein the cellular phenotype and its plasticity in response to expression gel images of peripheral and blood sample for external signals. The aim of this study was to investigate each patient were matched. The following criteria for dif- the protein expression profiles of myelogenous blasts ferential protein expression were used: (i) spot intensity: from patients with AML collected from two compart- four-fold increased = differential overexpression; (ii) spot ments, bone marrow and peripheral blood. intensity: four-fold decreased = differential under-expres- sion. We previously used a cell culture model derived from ther- moresistant gastric cancer to build up a database for 2D- electrophoresis patterns [17]. After matching the gel Results images of the AML samples with the images of the gastric Matching of samples In the pH range 4.0–8.0, conventional 2-D electrophore- cancer cell line, we found some differences in the protein sis of the 12 samples yielded about 700–900 spots, respec- patterns but overall, these changes were small: Seven pro- tively (Figure 1). We were able to identify a maximum of teins (with two variants) were clearly defined in the gastric 107 proteins in the AML samples. 23 Spots of the gastric carcinoma cell line but not in the AML samples (Spots- cancer cell line were not represented in the AML samples. No. 4, 64, 103, 108, 114, 121, 123) (Table 3). The major- ity of these proteins have unspecific or unknown func- Intra-individual analysis of the spot patterns showed a tions or they are clearly related to tissues and not to high correlation between the sample from peripheral hematological cells [18-23]. blood and bone marrow (Table 2). On/off-phenomena of As an example, protein spot No. 4 (14-3-3σ) is a family the identified spots were observed in four cases: Spot No. 19 (annexin 6) was found in patient A in the sample of member of proteins that regulate cellular activity by bind- ing and sequestering phosphorylated proteins. 14-3-3σ peripheral blood but not in bone marrow, in patient B an inverse constellation was detected concerning this protein promotes pre-mitotic cell-cycle arrest following DNA (Figure 2). As a third variance an absence of spot No. 102 damage, and its expression can be controlled by the p53 (phosphoglyceromutase) was only found in the bone tumor-suppressor gene [24]. None of the investigated AML-samples exhibited a 14-3-3σ expression in the 2D marrow of patient B. The fourth change concerned spot No. 130 (vimentin) which was only represented in the pattern. Analysis of other AML samples which did not peripheral blood sample of patient B. meet the inclusion criteria for this investigation showed Page 3 of 8 (page number not for citation purposes)
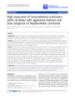
- Journal of Translational Medicine 2009, 7:7 http://www.translational-medicine.com/content/7/1/7 Mr 130 100 89 29 70 60 52 43 38 36 33 30 25 20 16 10 pI 4.9 4.1 4.5 5.1 5.5 5.9 6.3 6.9 7.4 7.8 Figure 1 2-D pattern of the silver stained gel image of the master gel image 2-D pattern of the silver stained gel image of the master gel image. 2-D pattern of the silver stained gel image of a master gel image containing the spot information of all investigated samples. For protein identification, each gel image was matched to the previously 130 identified spots of the gastric carcinoma cell line EPG85-257. Proteins identified to date are marked with arrows and numbered according to Sinha et al. [17]. Page 4 of 8 (page number not for citation purposes)
- Journal of Translational Medicine 2009, 7:7 http://www.translational-medicine.com/content/7/1/7 Table 2: Different protein expression in AML. Patient/Sample- A B C D E F No. Spot- Protein #02- #02- #02- #02- #02- #02- #02- #02- #02- #02- #02- #02- No. 05p 02b 06p 03b 24p 25b 33p 34b 37p 36b 39p 38b 5 14-3-3 related + + 19 Annexin 6, + + + + + + + + + + Calectrin (67 kDa) 60 FK506 binding + + + + + + + + + + protein 4 91 Ku antigen + + + + + + + + + + (86 kDa) 102 Phosphoglycero + + + + + + + + + + + mutase 103 Plasminogen + + + + activator inhibitor-2 104 Plasminogen + + + + activa. inhib.-2 var. 115 Rho A * * + + + + + + + + 121 TCHTP * * + + 122 TCHTP var. * * + + 130 Vimentin + + + + + + + + + + + Annexin 6 129 129 Patient A 76 76 77 67 77 67 #02-05p #02-02b Figure 2 Detail of the two-dimensional patterns of patient A Detail of the two-dimensional patterns of patient A. Detail of the two-dimensional patterns of patient A. Different expression of spot 19 (annexin 6) in the bone marrow sample in comparison to peripheral blood. Page 5 of 8 (page number not for citation purposes)
- Journal of Translational Medicine 2009, 7:7 http://www.translational-medicine.com/content/7/1/7 #02-02b #02-05p #02-03b #02-06p #02-24b #02-25p #02-39p #02-38b #02-36b #02-37p Figure 3the two-dimensional patterns with different expression of the Ku antigen Detail of Detail of the two-dimensional patterns with different expression of the Ku antigen. Selective deficiency of spot 91 (Ku antigene, marked with an arrow) in patient C whereas expression is detectable in other patients irrespectively of sample origin. similar results: the expression of 14-3-3σ in AML blast is identification of proteins that clearly discriminated an infrequent event. This observation corresponds to between the patients groups with defined chromosomal investigations in breast cancer and small cell lung carci- characteristics or clinical parameters such as patient sur- noma. In breast cancer a hypermethylation of the CpG vival [27]. island of the σ gene was found that leads to gene silencing and absence of 14-3-3σ. The authors conclude, that the Expression of the plasminogen activator inhibitor-2 (PAI- loss of σ expression contributes to malignant transforma- 2) was only found in patients E and F with the subtyp FAB tion by impairing the G2 cell cycle checkpoint function, M0 and M4, respectively. This finding is inline with data thus allowing an accumulation of genetic defects [25,26]. from the PAI-2 serum levels of patients with hematologi- cal malignancies, where different expression levels were Interestingly, there were only marginal differences in the correlated with different serum levels for PAI-2 in the AML expression profiles comparing patient to patient. This was subtypes FAB M4 and M0 [28]. As an explanation it was also observed in studies with patients with B-cell chronic postulated, that myeloid blasts, like their non-tumoral lymphocytic leukemia (CLL). In CLL, analysis allowed the counterparts, monocytes/macrophages, are able to syn- Page 6 of 8 (page number not for citation purposes)
- Journal of Translational Medicine 2009, 7:7 http://www.translational-medicine.com/content/7/1/7 Table 3: Proteins as expressed in the gastric cell line but not in AML. No. Protein name General function Ref. 14-3-3σ 4 Adapter protein for phosphoserin motifs. Regulated the interactions and subcellular [18] localization of signalling molecules. γ-Catenin Forms a complex with α- and β-Catenin to Cadherins, that are involved in the formation 64 [19] and maintenance of the histo-architecture. 103 Plasmonogen activator inhibitor-2 (PAI-2) Involved in the regulation and inhibition of binding between urokinase-type plasminogen [20] activator and its receptor, involved in physiological and pathological proteolysis and extracellular matrix degradation. Proteasome δ 108 Cleavage at peptide bonds with very broad specificity [21] 114 Reticulocalbin (RCN) RCN is a member of the EF-hand Ca(2+)-binding protein family and may regulate calcium- [22] dependent activities in the endoplasmatic reticulum lumen or post-ER compartment 121 TCHTP Cytoplasmatic Ca2(+)-binding protein [23] 123 Transgelin 2 Unknown thesize most components of the plasminogen activation Acknowledgements system. Among the numerous features shared by normal This work was supported by a grant from the Deutsche José Carreras Leukämie Stiftung, Munich, Germany (SP 03/06). monocytes and M4 cells were the capability to migrate to areas of inflammation and to infiltrate extramedullary tis- References sues like gingival enlargement [29]. 1. Sjoholt G, Anensen N, Wergeland L, Mc Cormack E, Bruserud O, Gjertsen BT: Proteomics in acute myelogenous leukaemia Furthermore, we have observed that the protein patterns (AML): methodological strategies and identification of pro- tein targets for novel antileukaemic therapy. Curr Drug Targets from samples from bone marrow and peripheral blood 2005, 6(6):631-646. from the same patient show a high correlation. The 2. Czibere A, Grall F, Aivado M: Perspectives of proteomics in observed changes are marginal and inter-individually var- acute myeloid leukemia. Expert Rev Anticancer Ther 2006, 6(11):1663-1675. iable. 3. Hanash SM, Teichroew D: Mining the human proteome: experi- ence with the human lymphoid protein database. Electrophore- sis 1998, 19(11):2004-2009. Conclusion 4. Hanash SM, Madoz-Gurpide J, Misek DE: Identification of novel In conclusion, the protein expression profile in AML targets for cancer therapy using expression proteomics. blasts collected from bone marrow aspirates in compari- Leukemia 2002, 16(4):478-485. 5. Lefkovits I, Kettman JR, Coleclough C: A strategy for founding a son to blasts from peripheral blood samples do not differ global lymphocyte proteinpaedia and gene catalogue. Immu- basically. This may indicate, that samples of peripheral nol Today 1990, 11(5):157-162. 6. Kettman JR, Coleclough C, Lefkovits I: Lymphocyte Proteinpae- blood with high amounts of blasts are to be considered dia stage two: T-cell polypeptides from a partitioned cDNA suitable for investigations of the proteome using 2D-elec- library revealed by the dual decay method. Int Arch Allergy trophoresis. Furthermore, protein expression profiling is Immunol 1994, 103(2):131-142. 7. Hanash SM, Baier LJ, McCurry L, Schwartz SA: Lineage-related likely to further impact the analysis of mechanisms polypeptide markers in acute lymphoblastic leukemia involved in acute leukemia by examining routinely avail- detected by two-dimensional gel electrophoresis. Proc Natl able biological material. Acad Sci USA 1986, 83(3):807-811. 8. Hanash SM, Kuick R, Strahler J, Richardson B, Reaman G, Stoolman L, Hanson C, Nichols D, Tueche HJ: Identification of a cellular Competing interests polypeptide that distinguishes between acute lymphoblastic leukemia in infants and in older children. Blood 1989, The authors declare that they have no competing interests. 73(2):527-532. 9. Strahler JR, Kuick R, Hanash SM: Diminished phosphorylation of Authors' contributions a heat shock protein (HSP 27) in infant acute lymphoblastic leukemia. Biochem Biophys Res Commun 1991, 175(1):134-142. GH, AL, DN, and JP carried out the 2D electrophoresis 10. Balkhi MY, Trivedi AK, Geletu M, Christopeit M, Bohlander SK, Behre and all other experimental work. PS, ET, and WKH coor- HM, Behre G: Proteomics of acute myeloid leukaemia: Cytogenetic risk groups differ specifically in their proteome, dinated the laboratory work and helped to draft the man- interactome and post-translational protein modifications. uscript. All authors read and approved the final Oncogene 2006, 25(53):7041-7058. manuscript. 11. Griffin JD, Davis R, Nelson DA, Davey FR, Mayer RJ, Schiffer C, McIn- tyre OR, Bloomfield CD: Use of surface marker analysis to pre- dict outcome of adult acute myeloblastic leukemia. Blood Note 1986, 68(6):1232-1241. 1%T = [(acrylamide + bis-acrylamide) × 100]/total weight 12. Rabilloud T: Use of thiourea to increase the solubility of mem- brane proteins in two-dimensional electrophoresis. Electro- phoresis 1998, 19(5):758-760. %C = (bis-acrylamide × 100)/(bis-alcrylamide + acryla- 13. Cheung CK, Mak YT, Swaminathan R: Automated trichloroacetic acid precipitation method for urine total protein. Ann Clin Bio- mide) chem 1987, 24(Pt 2):140-144. Page 7 of 8 (page number not for citation purposes)
- Journal of Translational Medicine 2009, 7:7 http://www.translational-medicine.com/content/7/1/7 14. Celis JE, Gesser B, Dejgaard K, Honore B, Leffers H, Madsen P, Andersen A, Basse B, Celis A, Lauridsen JB, et al.: Two dimensional gel human protein databases offer a systematic approach to the study of cell proliferation and differentiation. Int J Dev Biol 1989, 33(4):407-416. 15. Klose J, Kobalz U: Two-dimensional electrophoresis of pro- teins: an updated protocol and implications for a functional analysis of the genome. Electrophoresis 1995, 16(6):1034-1059. 16. Sinha P, Poland J, Schnolzer M, Rabilloud T: A new silver staining apparatus and procedure for matrix-assisted laser desorp- tion/ionization-time of flight analysis of proteins after two- dimensional electrophoresis. Proteomics 2001, 1(7):835-840. 17. Sinha P, Poland J, Schnolzer M, Celis JE, Lage H: Characterization of the differential protein expression associated with ther- moresistance in human gastric carcinoma cell lines. Electro- phoresis 2001, 22(14):2990-3000. 18. Ferl RJ, Manak MS, Reyes MF: The 14-3-3s. Genome Biol 2002, 3(7):. 19. Ozawa M: Identification of the region of alpha-catenin that plays an essential role in cadherin-mediated cell adhesion. J Biol Chem 1998, 273(45):29524-29529. 20. Andreasen PA, Egelund R, Petersen HH: The plasminogen activa- tion system in tumor growth, invasion, and metastasis. Cell Mol Life Sci 2000, 57(1):25-40. 21. Ding Q, Reinacker K, Dimayuga E, Nukala V, Drake J, Butterfield DA, Dunn JC, Martin S, Bruce-Keller AJ, Keller JN: Role of the protea- some in protein oxidation and neural viability following low- level oxidative stress. FEBS Lett 2003, 546(2–3):228-332. 22. Ozawa M, Muramatsu T: Reticulocalbin, a novel endoplasmic reticulum resident Ca(2+)-binding protein with multiple EF- hand motifs and a carboxyl-terminal HDEL sequence. J Biol Chem 1993, 268(1):699-705. 23. Reymond MA, Sanchez JC, Hughes GJ, Gunther K, Riese J, Tortola S, Peinado MA, Kirchner T, Hohenberger W, Hochstrasser DF, et al.: Standardized characterization of gene expression in human colorectal epithelium by two-dimensional electrophoresis. Electrophoresis 1997, 18(15):2842-2848. 24. Chan TA, Hermeking H, Lengauer C, Kinzler KW, Vogelstein B: 14- 3-3Sigma is required to prevent mitotic catastrophe after DNA damage. Nature 1999, 401(6753):616-620. 25. Osada H, Tatematsu Y, Yatabe Y, Nakagawa T, Konishi H, Harano T, Tezel E, Takada M, Takahashi T: Frequent and histological type- specific inactivation of 14-3-3sigma in human lung cancers. Oncogene 2002, 21(15):2418-2424. 26. Ferguson AT, Evron E, Umbricht CB, Pandita TK, Chan TA, Herme- king H, Marks JR, Lambers AR, Futreal PA, Stampfer MR, et al.: High frequency of hypermethylation at the 14-3-3 sigma locus leads to gene silencing in breast cancer. Proc Natl Acad Sci USA 2000, 97(11):6049-6054. 27. Voss T, Ahorn H, Haberl P, Dohner H, Wilgenbus K: Correlation of clinical data with proteomics profiles in 24 patients with B- cell chronic lymphocytic leukemia. Int J Cancer 2001, 91(2):180-186. 28. Scherrer A, Kruithof EK, Grob JP: Plasminogen activator inhibi- tor-2 in patients with monocytic leukemia. Leukemia 1991, 5(6):479-486. 29. Scherrer A, Wohlwend A, Kruithof EK, Vassalli JD, Sappino AP: Plas- minogen activation in human acute leukaemias. Br J Haematol 1999, 105(4):920-927. Publish with Bio Med Central and every scientist can read your work free of charge "BioMed Central will be the most significant development for disseminating the results of biomedical researc h in our lifetime." Sir Paul Nurse, Cancer Research UK Your research papers will be: available free of charge to the entire biomedical community peer reviewed and published immediately upon acceptance cited in PubMed and archived on PubMed Central yours — you keep the copyright BioMedcentral Submit your manuscript here: http://www.biomedcentral.com/info/publishing_adv.asp Page 8 of 8 (page number not for citation purposes)
CÓ THỂ BẠN MUỐN DOWNLOAD

-

báo cáo hóa học:" High dose concentration administration of ascorbic acid inhibits tumor growth in BALB/C mice implanted with sarcoma 180 cancer cells via the restriction of angiogenesis"
 9 p |
9 p |  74
|
74
|  6
6
-

báo cáo hóa học:" Highly efficient transduction of human plasmacytoid dendritic cells without phenotypic and functional maturation"
12 p | 49
| 4
-

báo cáo hóa học:" High prevalence of HIV-1 drug resistance among patients on first-line antiretroviral treatment in Lomé, Togo"
6 p | 44
| 4
-

báo cáo hóa học:" Highly active antiretroviral treatment for the prevention of HIV transmission"
8 p | 43
| 4
-
Báo cáo hóa học: " High expression of transcriptional coactivator p300 correlates with aggressive features and poor prognosis of hepatocellular carcinoma"
11 p | 45
| 4
-

Báo cáo hóa học: "High activity of sequential low dose chemo-modulating Temozolomide in combination with Fotemustine in metastatic melanoma. A feasibility study"
8 p | 72
| 4
-

báo cáo hóa học:" High abundances of neurotrophin 3 in atopic dermatitis mast cell"
7 p | 40
| 3
-

báo cáo hóa học:" High efficacy of lopinavir/r-based second-line antiretroviral treatment after 24 months of follow up at "
7 p | 36
| 3
-

báo cáo hóa học:" High rate of loss to clinical follow up among African HIV-infected patients attending a London clinic: a retrospective analysis of a clinical cohort"
10 p | 34
| 2
-

báo cáo hóa học:" High survival and treatment success sustained after two and three years of first-line ART for children in Cambodia"
10 p | 36
| 2
-

Báo cáo hóa học: " Research Article New Structured Illumination Technique for the Inspection of High-Reflective Surfaces: Application for the Detection of Structural Defects"
14 p | 64
| 2
-

báo cáo hóa học:" High energy tibial plateau fractures treated with hybrid external fixation"
7 p | 30
| 2
-

báo cáo hóa học:" High throughput RNAi assay optimization using adherent cell cytometry"
9 p | 33
| 2
-

báo cáo hóa học:" High ERCC1 expression predicts cisplatin-based chemotherapy resistance and poor outcome in unresectable squamous cell carcinoma of head and neck in a betel-chewing area"
8 p | 37
| 2
-

Báo cáo hóa học: " High level expression of human epithelial β-defensins (hBD-1, 2 and 3) in papillomavirus induced lesions"
8 p | 51
| 2
-

Báo cáo hóa học: " Generalized Models for high-throughput analysis of uncer- tain nonlinear systems"
4 p | 40
| 2
-

Báo cáo hóa học: " Research Article A High-End Real-Time Digital Film Processing Reconfigurable Platform"
15 p | 43
| 2


Chịu trách nhiệm nội dung:
Nguyễn Công Hà - Giám đốc Công ty TNHH TÀI LIỆU TRỰC TUYẾN VI NA
LIÊN HỆ
Địa chỉ: P402, 54A Nơ Trang Long, Phường 14, Q.Bình Thạnh, TP.HCM
Hotline: 093 303 0098
Email: support@tailieu.vn
Giấy phép Mạng Xã Hội số: 670/GP-BTTTT cấp ngày 30/11/2015 Copyright © 2022-2032 TaiLieu.VN. All rights reserved.

