MÔ HÌNH NƯỚC NGẦM
Phần 3: Mô hình nước ngầm có biên thay đổi theo thời gian (Transient Models) Nguyễn Mai Đăng Bộ môn Thủy văn & Tài nguyên nước dang@wru.vn 0989.551.699
Hãy nhớ lại ví dụ phần trước?
• Tìm lại file mà đã sử dụng từ phần 2
• Hoặc tạo lại nó bằng việc xem lại các
slides.
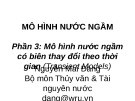
Ví dụ (Example)
Pumping Well
Layer 1
10 m
• Boundaries
3 1
Layer 2
– North & South: No-flow
5
-3 m -8 m
– East & West: Constant-head
• Layer 1 – unconfined (13 m)
No-flow Boundary
– Kh = 5x10⁻³ m/s; Kv = 5x10⁻⁴ m/s
)
)
m 9
– Porosity = 0.25
• Layer 2 – confined (5 m)
Pumping Well
– Kh = 1x10⁻³ m/s; Kv = 1x10⁻⁴ m/s
m 0 0 6
N
m 8 = h ( y r a d n u o B d a e H
= h ( y r a d n u o B d a e H
t
t
– Porosity = 0.25
n a
n a
t s n o C
t s n o C
No-flow Boundary
600 m
Adapted from Chiang, W-H and W. Kinzelbach, Processing Modflow: A Simulation System For Modeling Groundwater Flow and Pollution, 1996
Nhớ lại kết quả ví dụ trước?
Để có kết quả đường đẳng trị nước ngầm, hãy tích vào option này
Hãy luôn luôn tích vào lựa chọn này để lấy kết quả dòng chảy từ ô nọ chảy sáng ô kia
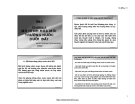
Mô hình nước ngầm có biên thay đổi theo thời gian (Transient Groundwater Models) • Mô hình Transient mô phỏng sự thay đổi theo thời gian
– Cần sử dụng mô hình này khi điều kiện biên thay đổi theo thời
gian (e.g., pumping rates, recharge, river stage, etc.)
• Thời kỳ “Stress”:
– Là khoảng thời gian mà điều kiện biên không thay đổi theo thời
gian;
– Thời kỳ Stress có thể có nhiều bước thời gian;
Time Steps
Time Steps
Time Steps
– Các điều kiện biên có thể thay đổi tại điểm đầu của thời kỳ
stress.
Time
Stress period
Stress period
Stress period
e.g., one day
Pumping and boundary conditions can change
e.g., one month
Mô hình nước ngầm thay đổi (Transient Model)
• Chuyển đổi mô hình ổn định sáng
• Open your model
•
mô hình Trasient
•
Select: Model MODFLOW Package Options
• Uncheck: Steady-State checkbox
•
Select: Basic Package Tab
•
Enter: Number of stress periods = 12
•
Select: Days
• Do you want to copy data? Select:
Select: OK
• Do you want to set up stress
Yes
periods? Select: Yes
Thời kỳ mô phỏng (Stress Periods)
• Sử dụng 12 thời kỳ stress, one for each day for 12 days
• Enter
– Length of each stress period (= 1 day)
– Number of time steps (= 1)
– Time step multiplier (= 1.0)
Các điều kiện bơm
•
•
Select: Layer 1
•
Select: BC Well
• Uncheck: “đ/k biên ổn
Select: BC Modify Layer
•
định”
Press: “Transient Data”
Uncheck this box
Press this button
Các điều kiện bơm (pumping conditions)
• Change the pumping rates from “m3/sec” to “m3/day”
• Enter: Starting and Ending Stress Period Numbers
• Enter: Q = 0 m3/d for stress periods 1, 2, and 3
• Enter: Q = -159,840 m3/d for stress periods 4 - 12
• Repeat for layer 2: Q = 0 m3/d in stress periods 1, 2 and 3;
Q = -1296 m3/d in periods 4 - 12
Truyền dẫn thủy lực (Hydraulic Conductivity)
• Change the hydraulic
conductivity values from “m/sec” to “m/day”
• Select: Props – Hydraulic
Conductivity
• Select: Props – Property
Values – Database
• Enter:
– Zone 1:
• Kx = 432 m/d
• Ky = 432 m/d
• Kz = 43.2 m/d
– Zone 2:
• Kx = 86.4 m/d
• Ky = 86.4 m/d
• Kz = 8.64 m/d
Hệ số trữ nước / độ rỗng (Storage/Porosity)
• Select: Props –
Storage/Porosity
• Select: Props –
Property Values – Database
• Enter:
– Zone 1 and
Zone 2:
• Ss = 0.0001
• Sy = 0.15
• Porosity = 0.15
Hệ số rò rỉ (Leakance)
• Select: cột (Props) –
Leakance
• Select: cột (Props) – Property
Values – Database
• Enter:
– Zone 1 and Zone 2:
• Hệ số rò rỉ
(Leakance) = 864 m/day
Các giếng quan trắc (Monitoring Wells)
•
•
Select: AE Well
•
Select: Row 15, Column 24
• Change: Pumping rate = 0.0
• Check box: Monitor
Select: Top layer = 1, and Bottom Layer = 2
•
Head/Concentration vs. Time
– Enter MW-1
•
Select: Well Name button
Add another Monitoting Well (MW-2) in cell (15, 18)
Select: OK
Mô hình với các giếng quan trắc (Model with Monitoring Wells)
Mô phỏng phương án chạy mô hình • Select: Calculator button (Run Simulation) • Would you like to process the results? Select: Yes • Select: Cell-by-cell flows
Switching Between Time Steps • There are several options that allow switching
between time steps in a transient run:
– Import Results (Plot->Import Results) Ctrl+Shift+I
– Next Time Step (Plot->Next Time Step) Ctrl+Shift+N
– Previous Time Step (Plot->Previous Time Step)
Ctrl+Shift+P
• Selecting the next time step will bring in the next set of heads, drawdowns, and cell-by-cell flows
Results – Stress Period 12
•
Row 7 Column 9
Các giếng quan trắc (Monitoring Wells) Select: Plot – Hydrograph - Monitoring Well
•
Select: Your Monitoring Wells
Row 2 Column 9