An investigation into the effect of potassium ions on the folding of silk fibroin studied by generalized two-dimensional NMR–NMR correlation and Raman spectroscopy Qing-Xia Ruan, Ping Zhou, Bing-Wen Hu and Dan Ji
The Key Laboratory of Molecular Engineering of Polymers, Ministry of Education, Department of Macromolecular Science, Fudan University, Shanghai, China
Keywords conformation transition; generalized two- dimensional NMR–NMR correlation; potassium ion; Raman spectroscopy; silk fibroin
Correspondence P. Zhou, The Key Laboratory of Molecular Engineering of Polymers, Ministry of Education, Department of Macromolecular Science, Fudan University, Shanghai 200433, China Fax: +86 21 65640293 Tel: +86 21 55664038 E-mail: pingzhou@fudan.edu.cn
(Received 16 October 2007, revised 11 November 2007, accepted 13 November 2007)
doi:10.1111/j.1742-4658.2007.06191.x
We used generalized two-dimensional NMR–NMR correlation to examine the effect of potassium ions on the conformation transition in silk fibroin to investigate the possibility that the fairly high K+ ion content found in the distal end of silk-secreting ducts in the silkworms could have a bearing on natural formation of the silk fiber. This has enabled us to propose a detailed mechanism for the transition process. Our evidence indicates that increasing the [K+] from 0 to 3.7 mgÆg)1 in the silk fibroin, as is thought to occur as the silk fibroin moves through the secretory pathway to the spigot, produces a sequence of secondary structural changes: helix and ⁄ or random coil fi helix-like fi b-sheet-like fi b-sheet. The sequence is the same as that produced in silk fibroin films by decreasing the pH of fibroin from 6.8 to 4.8. In addition, we used Raman spectroscopy to study the effect of K+ ions on the Fermi doublet resonance of the tyrosyl phenolic ring at 850 and 830 cm)1. The intensity ratio I850 ⁄ I830 at these wave numbers indicated that the hydrogen bonding formed by the tyrosyl pheno- lic-OH becomes more stable with an increase in the K+ ion concentration as above. Our investigation on the effect of K+ ions on fibroin may help provide a theoretical basis for understanding the natural silk-spinning process and the conditions required for biomimetic spinning. It may also have relevance to the aggregation of other b-sheet proteins, including prion proteins, neurofibrillary proteins and amyloid plaques.
Silk fibers have good tensile strength and toughness [1,2]. The predominant component of Bombyx mori silk is heavy-chain fibroin (up to 80% w ⁄ w). Silk fibers also contain light-chain fibroin, sericin and P25 [3,4]. Heavy-chain fibroin is thought to be largely responsi- ble for the tensile properties of silk fiber [5]. The amino acid sequence of this fibroin, the condensation behaviors of molecular chains into crystalline and
amorphous components, and its ordered assembly into nanofibrils, are all thought to be important in deter- mining fibroin’s mechanical properties. Several factors, including metallic ion content [1,6–9], shearing and ⁄ or extensional flow [10–12], fibroin concentration [1,10] and pH [1,6,7,10,13], are thought to influence the sec- ondary structure and aggregation of heavy-chain silk fibroin molecules.
Abbreviations CP-MAS, cross polarization-magic angle spinning; DFT, density functional theory; Ff1, class I filamentous viruses infecting F+ strains of Escherichia coli; ICP-MAS, inductively coupled plasma mass spectroscopy; KcsA, K+ conduction and selectivity architecture; NMR, nuclear magnetic resonance; PIXE, protein-induced X-ray emission; PrPc, cellular prion protein; PrPSc, scrapie-associated prion protein.
FEBS Journal 275 (2008) 219–232 ª 2007 The Authors Journal compilation ª 2007 FEBS
219
Q.-X. Ruan et al.
K+-induced conformation transition of silk fibroin
shearing, although decreases
traditional Fourier
transformation
Four types of repetitive sequence are found in the heavy-chain silk fibroin, with GAGAGS, GAG AGY and GAGAGVGY forming hydrophobic domains, and GTGSSGFGPYVA(N ⁄ H)GGYSGYE YAWSSESDFGT forming fairly well conserved hydro- philic spacers [14]. The hydrophobic domains give rise to the crystalline and semi-crystalline blocks, while the hydrophilic spacers have a noncrystalline W-loop struc- ture in the silk fiber [15,16]. Previous studies on films of regenerated silk fibroin and on the natural silk fibroin in the silk gland by X-ray diffraction [17–19], Raman spectroscopy [20,21], 13C and 15N solid-state NMR [22–34] have shown that fibroin exists in two conformation states. Silk I is thought to be constructed predominantly of multiple b-turns or 31-helix-like conformations, while Silk II consists of anti-parallel b-sheet (70%) and b-turn (30%) [30–33]. The transi- tion from Silk I to Silk II during natural spinning is thought to be largely brought about by extensional flow and ⁄ or in pH, changes in metallic ion contents and reduction in water content are thought to make a contribution as well.
views
detailed mechanisms of spinning and fiber formation are still unclear. Accordingly, we set out to investigate how changes in the [K+] from 0.5 to 3.1 mgÆg)1, found as the dope flows through the secretary pathway influence the evolution of secondary struc- [9,36,41], tures in the silk fibroin. We used a novel method, gen- eralized 2D correlation analysis, in this study. The method has been successfully applied to IR–IR [46– 48], Raman–Raman [46,47] and UV–UV [47,48] spec- trum analysis for a decade. In principle, the theory and method can be applied to a series of spectral func- tions affected by an independent variable such as tem- perature, concentration or time. It can reveal positive or negative correlations between two independent variables, and the sequence of these changes [46–48]. In the present study, we applied this method to NMR)NMR correlation [13] to determine the effect of changes in potassium ion content on the secondary structures of regenerated silk fibroin films. The results may provide information that cannot be obtained 2D-NMR by nuclear spectroscopy, which correlation spin behaviors during the period of nuclear spin evolution.
We also used 13C solid-state NMR and Raman spec- troscopy to study the effect of [K+] content changes on the environment of the tyrosine residues, the fourth in Bombyx most abundant amino acid (5.3 mol%) mori silk fibroin. We correlate the changes in the tyro- sine environment observed with changes in the evolu- tion of fibroin secondary structures determined by our generalized 2D NMR–NMR correlation analysis.
Results
13C CP-NMR spectroscopy
Our previous work demonstrated that K+, Ca2+, Cu2+and Zn2+ ions have effects on the secondary structures of regenerated fibroin. These ions promote the conformation transition from random coil (and ⁄ or helix-form) to b-sheet (or b-form) at certain concentra- tions [6,7,35]. Of the metallic elements present in the fibroin at the distal end of the secretary pathway, the potassium content is the highest (3.1 mgÆg)1) [36], and this element may play an important part in the spin- ning process [8,9,36–40]. Element analysis shows that the K+ ion content in the lumen of Bombyx mori silk- worm increases from the central part of the middle division to the anterior part of this division [9,41]. Knight and Vollrath have also demonstrated that K+ ion content changes in a similar way in the spider’s duct [42]. Chen et al. found that the K+ ions added to spidroin (spider fibroin) solution induced aggregation and precipitation of the protein as nanofibrils [43]. ICP-MS (inductively coupled plasma mass spectros- copy) element analysis showed that fast spinning led to a marked reduction of K content in spider dragline fil- aments [44,45], probably as a result of dilution of the content of the spinning duct caused by saturation of the natural water recovery mechanism for water expelled from the protein-rich phase as the thread is drawn down internally within the duct. Moreover, increasing the [K+] far beyond the natural concentra- tion in silkworm dope accelerates dissolution of natu- ral fibroin gel [39].
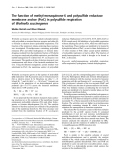
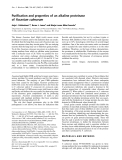
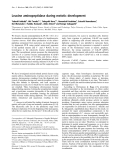
Figure 1A shows the one-dimensional solid-state 13C cross polarization-magic angle spinning (CP-MAS) NMR spectrum of regenerated silk fibroin film with added [K+] of 3.7 mgÆg)1, and Fig. 1B shows the spec- tra in the alanyl 13Cb region from 25 to 12 p.p.m. at the same added K+ ion concentration. The assignment of 13C chemical shift is summarized in Table 1. Sample ‘a’ in Fig. 1B is the original regenerated silk fibroin film, which has an intrinsic [K+] of 0.255 mgÆg)1 [35]. Samples ‘b’ to ‘g’ in Fig. 1B are silk fibroin films with added [K+] at 1.2, 2.5, 3.7, 5.0, 6.2, 12.5 mgÆg)1, respectively. The low intrinsic K+ ion content enables us to study the effect of added K+ ions on the silk fibroin. Figure 1B shows the effect of a progressive increase in [K+] on the alanyl Cb region of the spec- to secondary structural trum, which is
sensitive
Although many investigations on the influence of K+ ions on silk fibroin have been performed, the
FEBS Journal 275 (2008) 219–232 ª 2007 The Authors Journal compilation ª 2007 FEBS
220
Q.-X. Ruan et al.
K+-induced conformation transition of silk fibroin
B
A
(g)
(f)
(e)
(d)
(c)
∗
∗
(b)
∗∗
(a)
24
22
20
16
14
12
18 Chemical Shift / p.p.m.
Fig. 1. 13C CP-MAS NMR spectra of silk fibroin. (A) Full-range spectrum of silk fibroin with added [K+] at 3.7 mgÆg)1. The peaks marked with asterisks are spinning side bands. (B) The spectral alanyl Cb region in silk fibroin samples with added [K+] at (a) 0, (b) 1.2, (c) 2.5, (d) 3.7, (e) 5.0, (f) 6.2, and (g) 12.5 mgÆg)1, respectively.
Table 1. Assignment of 13C chemical shift (p.p.m.) of Bombyx mori regenerated silk fibroin filma.
C@O
Others
Ca
Cb
17.0
51.4 43.8 –b 57.5
60.8 37.3
175.7b 171.6b 172.4b 173.7
Ala Gly Ser Tyr
115.7 (Ce) 128.9 (Cc) 130.9 (Cd) 154.7 (Cn)
a The chemical shifts are normalized to the -CH2 peak of adaman- tine observed at 38.5 p.p.m. as a standard. b Could not be deter- mined unambiguously.
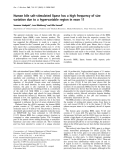
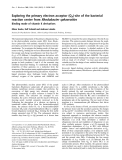
which is isotropic in the magnetic field, will be main- tained. The dipolar–dipolar interaction should not affect the line shape, which is determined solely by the distribution of components after the chemical shift anisotropy has been removed. Thus, as predicted, we obtained similar component contents at spinning rates of 9 kHz (Fig. 2B) and 5 kHz (Fig. 2A), confirming the reliability of the deconvolution. Table 2 summa- rizes the deconvoluted results for all the silk fibroin samples at the various added [K+]. To determine fur- ther the reliability of the deconvolution, we repeated the deconvolution three times for one spectrum. This gave deviations in percentage composition of < 2% for dominant components of samples ‘a’ (helix) and ‘b’ (b-sheet) in Fig. 2. The small deviations indicate con- sistent deconvolutions. As the shifts of minor amino acids, such as Pro, Lys and Ile, are close to the chemi- cal shifts of the minor components ‘c’ (b-sheet-like) and ‘d’ (helix-like), they probably account for the lar- ger deviations (> 2%) for these components. This is unlikely to have a significant effect on the results for the major components.
Figure 2C shows the effect of [K+] on the formation of total Silk II-related structures (determined by sum- ming the components of b-sheet-like and b-sheet). It shows that, as the added [K+] increases from 0 to 3.7 mgÆg)1, the silk fibroin conformations change par- tially from helix to b-sheet. At a [K+] of 3.7 mgÆg)1, the total Silk II-related conformation content peaked at 37%, only 13% higher than that obtained with- out addition of K+ ions (see Fig. 2C). Even so, this subtle change in b-sheet content may be functionally
changes in fibroin (see Experimental procedures). The line width around 17.0 p.p.m. initially narrowed, and then broadened again as [K+] increased. The spectra shown in Fig. 1B were all subjected to Gaussian deconvolution into four components to reveal the quantitative changes in the contents of the secondary structures. An example of the spectrum deconvolution in the alanyl Cb region is shown in Fig. 2A. In addi- tion, to check the reliability of the alanyl Cb spectra, we compared the effect of two spinning rates (5 and 9 kHz). No significant changes in the component con- tents were observed (Fig. 2A,B), but the line widths of the peaks were slightly narrower at the higher spinning rate (Fig. 2B) as a result of reduction in the dipolar– dipolar interaction. For alanyl Cb, the chemical shift anisotropy can be completely removed at both spin- ning rates, and only the dipolar–dipolar interaction,
FEBS Journal 275 (2008) 219–232 ª 2007 The Authors Journal compilation ª 2007 FEBS
221
300 150 250 100 0 –50 200 50 Chemical shift / p.p.m.
Q.-X. Ruan et al.
K+-induced conformation transition of silk fibroin
Fig. 2. The effect of [K+] on the silk fibroin conformation. (A, B) Deconvolutions of the solid-state 13C CP-MAS NMR alanyl Cb spectra at spin- ning rates of 5 and 9 kHz, respectively, showing experimental (bold solid line), deconvoluted (fine solid lines) and simulated (open square) results. The deconvoluted traces gave conformations of (a) helix and ⁄ or random coil of 66% for (A) and 67% for (B), (b) b-sheet of 16% for (A) and 17% for (B), (c) b-sheet-like of 8% for (A) and 7% for (B), and (d) helix-like of 10% for (A) and 9% for (B). Both (A) and (B) have Silk II-related conformations (b + c) of 24%. (C) The effect of added [K+] on the total Silk II-related conformations (summing b-sheet-like and b-sheet).
Table 2. Summary of secondary structural contents obtained by deconvoluting the alanyl Cb region of 13C NMR spectra of regenerated silk fibroin films with various added [K+].
Conformations in the regenerated silk fibroin (%)
Helix and ⁄ or random coil
Helix-like
Silk I-related (total helix and helix-like)
b-sheet-like
b-sheet
Silk II-related (total b-sheet and b-sheet-like)
Added [K+] (mgÆg)1)
66 61 52 53 60 61 67
10 12 18 10 9 10 6
8 11 11 5 5 6 9
16 16 19 32 26 23 18
76 73 70 63 69 71 73
24 27 30 37 31 29 27
0 1.2 2.5 3.7 5.0 6.2 12.5
The deviation in content percentage for the helix and ⁄ or random coil as well as for b-sheet-like was always <2%.
[K+]
from 3.7 to However, a further increase of 12.5 mgÆg)1 induced a decrease in total Silk II-related conformation.
significant in the natural spinning process. A greater increase in the Silk II content in the gland of the duct might lead to premature creation of solidified fibroin.
FEBS Journal 275 (2008) 219–232 ª 2007 The Authors Journal compilation ª 2007 FEBS
222
Q.-X. Ruan et al.
K+-induced conformation transition of silk fibroin
Tyr Cα
57.5 55.5
K+ mg·g–1
(d) fiber
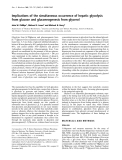
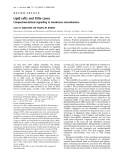
within the repetitive crystalline blocks as the confor- mation of the fibroin changes from Silk I to Silk II [34,49]. This confirms earlier evidence [34,49] that the environment of the tyrosine residues in fibroin under- goes a change in hydrophobicity during the formation of b-sheets.
(c) 3.7
Generalized 2D NMR–NMR correlation
(b) 2.5
(a) 0
80
70
60
50
40
30
Chemical shift / p.p.m.
Fig. 3. Solid-state 13C CP-MAS NMR spectra of the tyrosine resi- dues of regenerated silk fibroin with added [K+] at (a) 0, (b) 2.5 or (c) 3.7 mgÆg)1, and of fiber (d).
that, as
In addition, Fig. 3 demonstrates
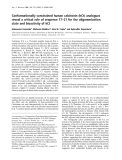
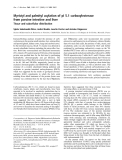
Generalized 2D NMR–NMR correlation spectroscopy of fibroin revealed more detailed information on the existence of intermediates and their evolution with increasing [K+]. To construct a generalized 2D NMR– NMR correlation map, component content changes increasing or decreasing in a monotonic direction are required. The first four points in Fig. 2C show a monotonic increase in total Silk II-related conforma- tions, and the corresponding 1D 13C NMR spectra from samples ‘a’ to ‘d’ in Fig. 1B are necessary and sufficient to plot a 2D NMR–NMR correlation map [13]. Figure 4A,B shows the synchronous and asyn- chronous 2D NMR–NMR correlation spectra. The averaged 1D 13C NMR spectrum profile is shown on the right and top sides of the 2D map.
[K+] increased from 0 to 3.7 mgÆg)1, the chemical shift of the tyrosyl Ca apical peak moved from the lower field (57.5 ± 0.5 p.p.m.) to the higher field (55.5 ± 0.5 p.p.m.). The movement of the tyrosyl Ca chemical to shift seen in regenerated silk films is thought indicate a change in the conformation of the tyrosine
Based on the Noda rule [46], the 2D synchronous correlation spectrum showed at least three auto-peaks at F(15.0 ± 0.5, 15.0 ± 0.5), F(17.0 ± 0.5, 17.0 ± 0.5)
B
A
.
.
i
i
m . p . p / t f i h s l a c m e h C
m . p . p / t f i h s l a c m e h C
14 15 16 17 18 19 20 21 22 23
14 15 16 17 18 19 20 21 22 23
23 22 21 20 19 18 17 16 15 14
23 22 21 20 19 18 17 16 15 14 Chemical shift / p.p.m.
Chemical shift / p.p.m.
15.0
20.0
C
0.000
12
24
20
16
22 14 18 Chemical shift / p.p.m.
Fig. 4. Generalized two-dimensional NMR– NMR synchronous (A) and asynchronous (B) correlation spectra of silk fibroin with added [K+] (from 0 to 3.7 mgÆg)1). The black and red regions represent the positive and nega- tive correlation intensities, respectively. (C) Is a slice along the 21.5 p.p.m. peak of the synchronous correlation map shown in (A).
FEBS Journal 275 (2008) 219–232 ª 2007 The Authors Journal compilation ª 2007 FEBS
223
Q.-X. Ruan et al.
K+-induced conformation transition of silk fibroin
indicates that, as the [K+] increases, the b-sheet-like conformation appears before the b-sheet.
is
there
another
correlated component
to
corresponding
[13]
Therefore, on the basis of the above analysis, there is evidence of a sequential change in fibroin secondary random coil fi helix- structure from helix and ⁄ or like fi b-sheet-like fi b-sheet as [K+] increases from 0 to 3.7 mgÆg)1. Changes in pH may induce the same series of secondary structural changes in vivo; the pH of the fibroin as it flows through secretary pathway changes from 6.8 to 4.8 [13], during which time the fibroin changes from a Silk I-like state to a Silk II state. This hypothesis is supported by evidence that preparing regenerated silk fibroin films at various pH values produced a similar series of secondary structural to those produced by K+ ions as changes described above. Thus a decrease in pH and a moder- ate increase in [K+] may have a synergic effect, promoting Silk II formation in vivo.
the increases
Raman spectroscopy and intensity ratio of I850/I830 for tyrosine residues
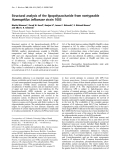
Figure 5A shows the Raman spectrum of a regenerated silk fibroin film without added K+ ions, while Fig. 5B focuses on the range from 900 to 810 cm)1 for fibroin films with the same concentrations of added K+ used for the 13C CP-MAS spectroscopy (see above).
corresponding
ranges
region II,
[K+]
indicating that
Figure 6A shows an example of deconvoluted Raman spectra from 900 to 810 cm)1 for a silk fibroin film. The ratio I850 ⁄ I830 is the ratio of the area of the deconvoluted peak at 850 cm)1 to that at 830 cm)1. These two peaks are assigned to Fermi doublet reso- nance (see Experimental procedures). The deviation of 4% for the ratio shown in Fig. 6B resulted from repeating the Gaussian deconvolution of the spectrum three times, demonstrating the reliability of the decon- volution process. Figure 6B shows a plot showing the effect of K+ on the I850 ⁄ I830 ratio as added K+ increased from 0 to 12.5 mgÆg)1. We divide this plot into three regions: region I, for [K+] ranges from 0– 1.2 mgÆg)1, where the ratio of I850 ⁄ I830 decreased from from 1.2– 3.0 to 1.8; for 6.2 mgÆg)1, in which the ratio of I850 ⁄ I830 increased from 1.8 to 2.2 with a possibly significant plateau at 3.7–6.2 mgÆg)1; region III, for [K+] ranges from 6.2–12.5 mgÆg)1, where the ratio of I850 ⁄ I830 further increased from 2.2 to 2.7.
Discussion
As described above, in the domains containing alanine residues, 13C CP-MAS NMR indicated that increasing [K+] from 0 to 3.7 mgÆg)1 induced a conformation
and F(20.0 ± 0.5, 20.0 ± 0.5) on the diagonal of Fig. 4A. This indicates the presence of at least three at components with chemical 15.0 ± 0.5, shifts 17.0 ± 0.5 and 20.0 ± 0.5 p.p.m. that vary with increasing [K+]. In addition, one negative (red) cross- peak in Fig. 4A, F(21.5 ± 0.5, 17.0 ± 0.5), indicates that at 21.5 ± 0.5 p.p.m. The positive (black) cross-peak at F(20.0 ± 0.5, 15.0 ± 0.5) indicates that the b-sheet conformation 20.0 ± 0.5 p.p.m. changes congruously with that of the helix-like confor- mation corresponding to 15.0 ± 0.5 p.p.m. Figure 4B shows a negative (red) cross-peak at Y(20.0 ± 0.5, 15.0 ± 0.5) in the asynchronous correlation spectrum, and application of Noda’s rule [46] to this peak indi- cates that the b-sheet conformation appeared after the helix-like conformation. Moreover, the cross-peaks at F(21.5 ± 0.5, 17.0 ± 0.5), F(20.0 ± 0.5, 17.0 ± 0.5) and F(17.0 ± 0.5, 15.0 ± 0.5) in the synchronous cor- relation spectrum of Fig. 4A are all negative, indicat- ing that in b-sheet-like and b-sheet conformations assigned to 21.5 ± 0.5 and 20.0 ± 0.5 p.p.m. are correlated with the decrease in helix conformation corresponding to 17.0 ± 0.5 p.p.m. In parallel, the helix conformation corresponding to 17.0 ± 0.5 p.p.m. changed inversely with the helix-like 15.0 ± 0.5 p.p.m. conformation to Furthermore, both cross-peaks at Y(21.5 ± 0.5, 17.0 ± 0.5) and Y(20.0 ± 0.5, 17.0 ± 0.5) are posi- tive in the asynchronous spectrum (Fig. 4B), indicating that both the b-sheet-like and b-sheet conformations appeared after the helix conformation. The cross-peaks at F ⁄ Y(17.0 ± 0.5, 15.0 ± 0.5) are negative in both synchronous and asynchronous spectra, indicating that the helix conformation appeared before the helix-like conformation. To demonstrate clearly the correlation between the conformations of b-sheet-like (21.5 ± (20.0 ± 0.5 p.p.m.), as well 0.5 p.p.m.) and b-sheet as b-sheet-like and helix-like (21.5 ± 0.5 p.p.m.) (15.0 ± 0.5 p.p.m.) conformations, Fig. 4A shows a slice along the 21.5 p.p.m. peak (shown in Fig. 4C) on the 2D synchronous correlation spectrum. It shows that there are two positive broad peaks at 20.0 ± 0.5 and 15.0 ± 0.5 p.p.m., the b-sheet (20.0 ± 0.5 p.p.m.) and helix-like (15.0 ± 0.5 p.p.m.) conformations changed congruously with the b-sheet- like (21.5 ± 0.5 p.p.m.) conformation. A negative sign for Y(21.5 ± 0.5, 15.0 ± 0.5) in the asynchronous spectrum indicates that the helix-like conformation appeared before the b-sheet-like conformation. Fur- cross-peak at Y(21.5 ± 0.5, thermore, a positive 20.0 ± 0.5) in the asynchronous spectrum (Fig. 4B), the same sign as that in the synchronous spectrum,
FEBS Journal 275 (2008) 219–232 ª 2007 The Authors Journal compilation ª 2007 FEBS
224
Q.-X. Ruan et al.
K+-induced conformation transition of silk fibroin
1659
B
A
4
853
3
(g)
(f)
2
(e)
830
y t i s n e t n i d e z
i l
1616
(d)
1
(c)
a m r o N
(b)
0
(a)
900
880
840
820
800
1800
1600
1400
1200
1000
860 Wavenumber / cm–1
Wavenumber / cm–1
Fig. 5. (A) Raman spectrum of silk fibroin film without added [K+]. (B) Spectra viewed at the tyrosine Fermi doublet resonance range from 900 to 810 cm)1, with added [K+] at (a) 0, (b) 1.2, (c) 2.5, (d) 3.7, (e) 5.0, (f) 6.2, and (g) 12.5 mgÆg)1.
A
B
Region I
3.2
855
3.0
Region II Region III
2.8
2.6
0 3 8
831
I /
2.4
0 5 8
I
2.2
2.0
1.8
900
880
860
840
820
0
2
6
14
4
8
12
10 Added [K+] / mg·g–1
Wavenumber / cm–1
Fig. 6. (A) Deconvoluted Raman spectrum with no added [K+] at the tyrosine Fermi doublet resonance around 850 and 830 cm)1. (B) The effect of added [K+] on the I850 ⁄ I830 ratio.
Ratio of I850 ⁄ I830 and tyrosine environment and tyrosine hydrogen bonding
of and ⁄ or
transition from helix-form to b-form through a intermediate sequence structures: secondary helix random coil fi helix-like fi b-sheet- like fi b-sheet. Further increase in [K+] from 3.7 to 12.5 mgÆg)1 lead to a reversal of the transition from b-sheet to helix. Raman spectroscopy showed that, as [K+] increased, the ratio I850 ⁄ I830 changed. Here, we correlate our 13C CP-MAS NMR and Raman spectroscopy findings, and consider how the K+ ion may bring about the changes in folding inferred from our observations.
Sianwiza et al. [50] used Raman spectroscopy to study Fermi doublet resonance of tyrosyl residues in several globular proteins, their deuterium derivatives and certain model compounds at various pH values. They correlated the relationship between I850 ⁄ I830 ratio and the hydrogen-bonding state of the phenolic hydroxyl group. They concluded that the tyrosyl phenolic-OH group in the interior of protein acts as a strong proton
FEBS Journal 275 (2008) 219–232 ª 2007 The Authors Journal compilation ª 2007 FEBS
225
Q.-X. Ruan et al.
K+-induced conformation transition of silk fibroin
+,
such as a lysyl NH3
silk-like model
including
peptides
change from a hydrophobic environment for the tyro- sine to one in which there is moderate hydrogen bond- ing. We therefore suggest that, when the regenerated silk fibroin is in the helix and ⁄ or random coil (Silk I state) conformation, tyrosyl groups exist in a highly hydrophobic environment with an I850 ⁄ I830 ratio of 3.0. The packing of the helix structure with an intra- chain H-bond is unfavorable for phenolic-OH hydro- gen-bonding interactions [49]. An increase in [K+] may induce movement of the main chains, causing tyrosine to leave its hydrophobic environment and be exposed on the surface of protein when the fibroin is conformation with a decreased in the helix-like I850 ⁄ I830 ratio. This change in tyrosine environment may allow the phenolic-OH oxygen to act as an accep- tor of a hydrogen atom, such as that of the serine hydroxyl group in the silk fibroin main chain [49], with weak hydrogen-bonding strength, causing the silk fibroin to undergo a secondary structural transition to the Silk II state. The fact that the serine residue is often in the proximity of a GYG triplet in Bombyx mori heavy-chain fibroin may facilitate this process as the tyrosine environment changes.
donor to an electronegative acceptor such as carboxyl oxygen, giving an I850 ⁄ I830 of 0.30. On the other hand, when this groups act as either a proton donor or an acceptor of moderate hydrogen-bonding strength, for example when exposed to solvent H2O molecules, the I850 ⁄ I830 ratio is 1.25. In contrast, when tyrosine acts as an acceptor of a strong hydrogen bond from an the electropositive donor I850 ⁄ I830 is 2.50 [50]. Moreover, when the phenolic-OH is depronated to a phenoxide ion, the I850 ⁄ I830 is 0.70. the increase in I850 ⁄ I830 from 0.3 to 2.5 is Thus, thought to result from a change in the tyrosyl pheno- lic-OH from a donor to an acceptor of a strong hydro- gen bond. Overman et al. [51,52] studied the Ff1 filamentous coat protein (pVIII), a non-globular pro- tein, in a bacterial virus. They found that the I850 ⁄ I830 ratio was higher than the maximum value of 2.5 noted by Sianwiza et al. [50], and suggested that this resulted from the tyrosyl group in this protein experiencing a highly hydrophobic environment. Taddei et al. [49] also studied the Fermi doublets in a series of synthe- (AGS- sized GAG)4AGYGAG, (AG)7YG(AG)7, (AG)12YG(AG)2, (AG)2(AGSGAG)AGVGYG(AG)2VGYG(AG)2SG and (AGSGAG)2AGYGAGYG(AG)3YGAG, compar- ing the I850 ⁄ I830 ratio of these peptides with those of Silk I chymotryptic precipitate (Cp) and Silk II Cp. They found that the I850 ⁄ I830 ratio of Silk I Cp (5.6) is much higher than that of Silk II Cp (2.9), and that the ratio of the former decreased progressively from 2.2 to 1.6 as the number of tyrosyl groups, Y, was increased from 1 to 3. The authors hypothesized that the tyrosyl groups experience different environments and hydro- gen-bonding arrangements in the Silk I and Silk II states. The typical packing of the Silk II structure traps the tyrosyl side chains in environments that are more unfavorable to phenoxyl hydrogen-bonding inter- action, i.e. the environment around tyrosyl groups is highly hydrophobic. In addition, according to the clas- sification of Sianwiza et al. [50] described above, the decreasing I850 ⁄ I830 ratio from 2.2 to 1.6 in Silk I indi- cates a progressively decreasing ability of tyrosine to act as an acceptor of strong hydrogen bonding with increasing tyrosine content [49].
The effect of K+ on fibroin secondary structure and tyrosine hydrogen bonding
conformation as
increased from 0 to 1.2 mgÆg)1, 13C As added [K+] CP-MAS indicated a change from helix and ⁄ or ran- dom coil and helix-like to a b-sheet-like conformation, and the I850 ⁄ I830 ratio changed from 3.0 to 1.8 (region I in Fig. 6B). The latter observation indicates a
As added [K+] increases from 1.2 to 3.7 mgÆg)1, 13C CP-MAS indicates a change from helix-related to b-sheet-related conformations, and the I850 ⁄ I830 ratio changes from 1.8 to 2.2 (region II in Fig. 6B). The latter observation suggests that the phenolic-OH acts progressively as an acceptor of strong hydrogen bond- ing, giving rise to the b-sheet-related conformation. The slight plateau (in region II), as [K+] increases from 3.7 to 6.2 mgÆg)1, may result from a plateau in the strength of hydrogen bonding to the tyrosine in the b-sheet-related conformation. In the re-orientation process of the tyrosine from helix-related to b-sheet- related structures, the tyrosyl phenolic-OH oxygen atom may be buried in the protein and form relatively strong hydrogen bonding with the –NH hydrogen donor from the inter-chain at the edge of the extended anti-parallel b-sheet [34]. At a [K+] of 3.7 mgÆg)1, the I850 ⁄ I830 ratio of 2.2 suggests that the hydrogen bond- ing between tyrosine phenolic-OH oxygen and the main chain hydrogen donor in the b-sheet conforma- tion is strongest at the point at which the total Silk II- related content reaches its maximum (Fig. 2C). The almost complete lack of lysine in the sequence of Bombyx mori heavy-chain fibroin may explain why the I850 ⁄ I830 ratio in fibroin films and fibroin-like peptides does not reach the value of 2.5 (see above and Ref. [50]). However, a further increase in [K+] up to 6.2 mgÆg)1 may result in some decrease in b-sheet- like the disordered intermediate reappears.
FEBS Journal 275 (2008) 219–232 ª 2007 The Authors Journal compilation ª 2007 FEBS
226
Q.-X. Ruan et al.
K+-induced conformation transition of silk fibroin
Fig. 7. Schematic representation of the hypothetical changes in heavy-chain fibroin structure induced by a progressive increase in [K+] in regions I–III shown in Fig. 6B. (A) In region I, the heavy-chain fibroin in the regenerated silk film consists mainly of Silk I structure, which includes helix (solid helical curve) and b-turn (solid loop line) structures. The dashed line shows the hydrophilic spacer sequence. (B) In region II, the secondary structure is predominantly anti-parallel b-sheet. The arrows indicate b-strands. (C) In region III, the helix structure appears again.
As added [K+]
increases from 6.2 to 12.5 mgÆg)1 (region III in Fig. 6B), the silk fibroin conformation is thought to return to the helix and ⁄ or random coil state. This may result from the tendency of this ion to prevent b-sheet hydrogen bond formation at high con- centrations as a consequence of its chaotropic effect. In region III, the I850 ⁄ I830 ratio increase to 2.7 indicates that tyrosine residues have returned to a hydrophobic environment. Figure 7 shows a schematic representa- tion of the hypothetical changes in heavy-chain fibroin structure induced by a progressive increase in [K+].
Relationship between K+ and VGYG ⁄ GYGV palindrome sequences
selectivity channel by allowing only the passage of almost dehydrated K+ ions across the cell membrane. At a high concentration of [K+], the structure of the channel is quite inflexible [56]. The potassium ion is constrained in an optimal geometry by a channel network of p–p-interacting tyrosine residues, such that a dehydrated K+ ion fits snugly with proper coordina- tion to the backbone carbonyl oxygen atoms. In this way, the channel pore geometry is controlled by coor- dination of the K+ ion to the binding sites in a stable energy conformation [57]. Interestingly, the structure is sensitive to pH, with the full-length KcsA channel being mostly closed to K+ entry at neutral pH, but stabilized in the open state at low intracellular pH [58]. A conformational pH sensitivity is also seen in fibroin in vitro [6,7,13], and may occur in vivo as the pH is reduced as the silk flows through the secretory path- way.
At a high K+ ion concentration in fibroin, these ions may interact with carbonyl oxygen atoms from VGYG ⁄ GYGV amino acid palindrome sequences. When [K+] is at 3.7 mgÆg)1, which leads to the highest content of total Silk II-related conformation, the molar ratio of K+ to tyrosine in the total VGYG ⁄ GYGV sequences is 1.5 to 1. It is possible that K+ ions are located in a cavity flanked by VGYG ⁄ GYGV palin- drome sequences. It is interesting to note that the sequence GYG appears to be ubiquitous in silk fibro- ins, spidroin and fibroin-like proteins [14,59–62].
Tyrosine function in silk and other proteins
carbonyl oxygen atoms of
the
There are two possible hypotheses to account for the effect of K+ ions on the secondary structure of fibroin: (a) they bind non-specifically to the negatively charged residues in the protein [40,53], or (b) they coordinate to specific domains [42,43]. We favor the latter hypo- thesis because there is good evidence that potassium ions have a selective effect on silk fibroin that is different from that produced by sodium ions [42,43]. The sequence of Bombyx mori heavy-chain silk fibroin has a large number of the amino acid palindrome sequences VGYG (21 repeats) ⁄ GYGV (11 repeats), and these special sequences oppose one another at the ends of the extended b-stands [14]. Interestingly, there is a similar sequence, TTVGYG, that is common to all K+ channels, for example the K+ ion-selective chan- nel of bacterial KcsA from Streptomyces lividans [54–56]. Electrostatic interactions bind the K+ ions to the fourfold VGYG sequence, with an O–K+ coordination dis- tance between 2.70 and 3.08 A˚ in a KcsA K+ channel structure [56,57]. This region of the pore acts as the
A study of the dynamics of tyrosine residues in both Silk I and Silk II conformations shows that the p-flip movement around Ca–Cb of the tyrosyl phenolic ring is fast, with a frequency of 106 Hz in the silk film
FEBS Journal 275 (2008) 219–232 ª 2007 The Authors Journal compilation ª 2007 FEBS
227
Q.-X. Ruan et al.
K+-induced conformation transition of silk fibroin
aromatic and polar groups. The stacking of similar res- idues on a flat cross b-sheet structure is seen in many unrelated peptides [67]. We suggest that a similar stacking of aromatic residues may occur in silks in which the b-sheets lie parallel to the long axis of the nanofibril.
In conclusion, our investigation on the effect of the K+ ion may help to provide a theoretical basis for understanding the natural silk-spinning process and the conditions required for biomimetic spinning. It may also have relevance for the aggregation of other b-sheet proteins, including prion protein, neurofibril- lary proteins and amyloid plaques.
Experimental procedures
Sample preparation
(Silk I state) [63] for which no hydrogen bonding exists in the tyrosyl groups, as evidenced by the high I850 ⁄ I830 ratio of 3.0. In contrast, it is much slow with a frequency of 103 Hz in the Silk II state in the silk fiber. This difference in p-flip movement is probably accounted for by a greater flexibility around tyrosyl Ca–Cb in the random coil form than in the b-sheet form. During the conformation transition of silk fibroin from helix and ⁄ or random coil to helix-like structure, the flexible tyrosine tends to be exposed on the exterior of the silk fibroin molecule and form weak hydrogen bonding as indicated by the decrease in the I850 ⁄ I830 ratio from 3.0 to 1.8 (region I). On the other hand, our results from Raman spectroscopy indicated that, during the silk fibroin conformation evolution from helix-like to b-sheet-like and then to b-sheet, the tyrosyl phenolic-OH becomes hydrogen-bonding of strong, as evidenced by the increase in the I850 ⁄ I830 ratio from 1.8 to 2.2.
The investigation of the dynamic fluorescence spec- troscopy of natively unfolded neurofibrillar human a-synuclein by Uversky et al. [64] showed that the structure of this protein is also significantly affected by the interaction with metal cations. K+ ions induce an increase in the intrinsic fluorescence of a-synuclein due to the changes in the environment of the tyrosine resi- dues, which result from binding between a-synuclein and metal ions, leading to a-synuclein conformational changes. Similar instances of stabilization of secondary structures by tyrosine hydrogen-bonding interactions also occur in some other proteins. For example, fibril- lin-rich microfibril, a large glycoprotein (350 kDa) that possesses multi-domain structures, has 94 tyrosine resi- dues and all are conserved in the bovine and human sequences [65]. The tyrosine at position 35 has a key role in the interaction between two domains; the side chain forms hydrophobic-packing interactions with the glycine residue at position 25 in the next domain. This interaction is important in stabilizing domains in their near-linear arrangement, and is necessary to form nanofibrils. In addition, an ultraviolet spectroscopy study of a prion protein by Torrent et al. [66] con- cluded that Tyr150 in the 132–160 region helps to maintain site-specific interactions to preserve local architecture in the hairpin region and to promote the formation of inter- or intra-molecular interactions. This region acts as the nucleus for b-sheet formation in the conversion of the PrPc form to the PrPSc form. The latter form leads to neuronal degeneration.
Raw silk fibers were extracted from Bombyx mori cocoons and degummed in boiling Na2CO3 aqueous solution (0.5 wt%) for 1 h. The fibers were then washed with deion- ized water and dried at 50 (cid:2)C in a vacuum oven for 24 h. The degummed fibers were dissolved in 100 mL of 9.3 m LiBr aqueous solution at 40 (cid:2)C for 1 h to produce regener- ated silk fibroin solutions. These were dialyzed at ambient temperature against deionized water, which was changed every 3 h for 3 days to remove the LiBr. The resultant regenerated fibroin concentration was about 2 wt% as determined by gravimetry.
There are a large number of proteins with repetitive folds where each of the repeats supplies a strand to one or more b-sheets. These show extensive aggrega- tion and stacking of similar residues, such as aliphatic,
FEBS Journal 275 (2008) 219–232 ª 2007 The Authors Journal compilation ª 2007 FEBS
228
A KCl solution at 0.1 wt% was prepared to provide the required [K+] in the studied samples. The intrinsic potassium element content of 0.255 ± 0.073 mgÆg)1 in the regenerated silk fibroin was determined using PIXE (proton- induced X-ray emission) [35]. A series of regenerated silk fibroin solutions at [K+] of 1.2, 2.5, 3.7, 5.0, 6.2 and 12.5 mgÆg)1 fibroin were prepared by mixing appropriate volumes of 0.1 wt% KCl aqueous solution and deionized water with 2 wt% silk fibroin solution to give a final fibroin concentration of 1 wt%. The regenerated silk membranes with added K+ were prepared from these solutions by cast- ing them on a shallow, smooth polystyrene membrane at room temperature for 3 days without forced evaporation to mimic the natural evaporation of water from silk dope. As the silk fibroin is a protein that readily changes its conforma- tion on aging, we were always cautious when preparing the fibroin samples. The fibroin films were prepared from freshly prepared regenerated silk fibroin. To rule out the possibility that the difference in the secondary structure content was produced by factors other than added K+ ions, we re-tested fibroin films and found that our method of preparing them gave stable samples that did not show slow maturational changes in secondary structure over time. We repeated our 13C CP-MAS NMR and Raman observations for three batches of fibroin samples and obtained very similar results.
Q.-X. Ruan et al.
K+-induced conformation transition of silk fibroin
13C CP-MAS NMR spectrum
factor,
is
t. ~hðm2; tÞ is the Hilbert–Noda external physical transformation of ~yðm2; tÞ The detailed theory is explained in [46,47]. When ~yðm1; tÞ and ~yðm2; tÞ are a series of NMR spectra perturbed by a single independent variable, for example [K+] changes here, and mi the resonance chemical shift, a generalized 2D NMR–NMR correlation spectrum is established based on Eqns (1,2).
Raman spectra
13C CP-MAS NMR experiments were performed using an InfinityPlus-300 NMR spectrometer (Varian Inc., Palo Alto, CA, USA) with a 13C resonance frequency of 75.5 MHz, contact time of 1.0 ms, pulse repeat time of 2 s, a 1H 90(cid:2) pulse width of 4 ls, 1H and 13C cross-polarization magnitudes of 62.5 kHz, a 1H decoupling magnitude of 62.5 kHz, and scanning accumulations of > 1200 to ensure a good signal to noise (S ⁄ N) ratio. The -CH2 peak of ada- mantine observed at 38.5 p.p.m. was used as the external reference. Samples were routinely spun at 5 kHz in a spin- ning rotor with 4 mm diameter. Some samples were spun at 9 kHz to check the reliability of the secondary structural determinations (see above).
The generalized 2D NMR–NMR correlation spectrum was constructed using 2d shige software (http://sci-tech. ksc.kwansei.ac.jp/~ozaki/e_2D.htm) written by Shigeaki Morita (Department of Chemistry, Kwansei Gakuin University, Gakuen Sanda, Japan).
Raman spectra were recorded on a Dilor Lab Ram-1B spectrometer (Jobin Yvon, Nancy, France), with an excita- tion wavelength of 632.8 nm produced by an argon laser with 6 mW power. The resolution of the spectrum was 1 cm)1, and the spectrum scanning range was from 1720 to 800 cm)1.
The spectra were normalized by the intensity of the car- bonyl (C=O) carbon peak. The alanyl Cb spectrum in the range 25–12 p.p.m. is sensitive to conformational changes, and can be used as a good indicator of silk fibroin confor- mation [33]. Zhou et al. calculated alanyl Cb chemical shifts in the main amino acid repeat, GAGAGS, of Bombyx mori silk heavy-chain fibroin, and determined possible conforma- tions on the basis of the DFT (density functional theory) method. The chemical shifts of 17.0 ± 0.5, 15.0 ± 0.5, 20.0 ± 0.5, 21.0 ± 0.5 p.p.m. were assigned to helix and ⁄ or random coil, helix-like, b-sheet and b-sheet-like con- formations, respectively [33]. Closely similar assignments were confirmed experimentally and theoretically by Asak- ura et al. [68]. Asakura et al.
The 1700–1630 cm)1 region is assigned to the amide I mode (C=O stretching) of the amino acids in the silk fibroin. The 1616 cm)1 band is assigned to the vibration peak of aromatic residues of tyrosine, phenylalanine and tryptophan [21,69], and is used as the reference value for intensity normalization of the Raman spectrum. The peaks around 850 and 830 cm)1 have been assigned to Fermi doublet resonance of the tyrosine aromatic ring between ring-breathing vibration and overtone of an out-of-plane ring-bending vibration for the para-substituted benzene [49,50]. The area ratio I850 ⁄ I830 is an indicator of the orien- tation, hydrogen-bonding strength of the phenolic-OH group, aggregation and degree of exposure of tyrosine resi- dues to the surface of the protein [49,50].
Acknowledgements
Generalized 2D NMR–NMR correlation spectroscopy
[34] studied the conformation-dependent chemical shifts of [13Ca]-Tyr, [13Cb]-Tyr and [13Ca]-Val resi- dues in Bombyx mori silk fibers in the Silk II conformation and in regenerated silk films in the Silk I conformation. Their work showed that the chemical shifts of [13Ca]-Val and [13Ca]-Tyr are sensitive to the protein conformation. A [13Ca]-Tyr chemical shift of 56.0 p.p.m. is characteristic of the helix-form in the silk film, while 54.2 p.p.m. is charac- teristic of the b-sheet form in the silk fiber [34].
The generalized 2D correlation function for a perturbation- based spectrum is defined [47] as:
T min
This work is supported by the National Science Foun- dation of China (grant numbers 10475017, 20434010 and 20673022). The authors also thank He-Yong He of the Department of Chemistry, and Tai-Liu Wu and Wen-Hua Yao of the Analytical Measurement Center, Fudan University, for their kind help with solid-state NMR and Raman measurements. David Knight (Department of Zoology, University of Oxford) kindly helped us polish the English, and made many impor- tant suggestions.
Z T max
ð2Þ
Wðm1; m2Þ ¼
~yðm1; tÞ (cid:3) ~hðm2; tÞdt
1 Tmax (cid:2) Tmin
T min
Z T max ð1Þ Uðm1; m2Þ ¼ ~yðm1; tÞ (cid:3) ~yðm2; tÞdt 1 Tmax (cid:2) Tmin
References
1 Magoshi J, Magoshi Y, Becker MA & Nakamura S
FEBS Journal 275 (2008) 219–232 ª 2007 The Authors Journal compilation ª 2007 FEBS
229
(1996) Biospinning (silk fiber formation, multiple spin- ning mechanisms). In Polymeric Materials Encyclopedia where F(m1,m2) and Y(m1,m2) are the generalized synchro- nous and asynchronous 2D correlation spectra, respectively. ~yðm1; tÞ and ~yðm2; tÞ are the spectral profiles perturbed by
Q.-X. Ruan et al.
K+-induced conformation transition of silk fibroin
(Salamone JC, ed.), Vol. 1, pp. 667–679. CRC Press, New York, NY.
14 Zhou CZ, Confalonieri F, Medina N, Zivanovic Y, Esnault C, Yang T, Jacquet M, Janin J, Duguet M, Perasso R et al. (2000) Fine organization of Bombyx mori fibroin heavy chain gene. Nucleic Acids Res 28, 2413–2419. 15 Asakura T, Yao JM, Yamane T, Umerura K & Ulrich 2 Tanaka K, Inoue S & Mizuno S (1999) Hydrophobic interaction of P25, containing Asn-linked oligosaccha- ride chains, with the H–L complex of silk fibroin pro- duced by Bombyx mori. Insect Biochem Mol Biol 29, 269–276.
KS (2002) Heterogeneous structure of silk fibers from Bombyx mori resolved by 13C solid-state NMR spectros- copy. J Am Chem Soc 124, 8794–8795.
3 Tanaka K, Kajiyama N, Ishikura K, Waga S, Kikuchi A, Ohtomo K, Takagi T & Mizuno S (1999) Determi- nation of the site of disulfide linkage between heavy and light chains of silk fibroin produced by Bombyx mori. Biochem Biophys Acta 1432, 92–103. 16 Ha SW, Gracz HS, Tonelli AE & Hudson SM (2005) Structural study of irregular amino acid sequences in the heavy chain of Bombyx mori silk fibroin. Biomacro- molecules 6, 2563–2569.
17 He SJ, Valluzzi R & Gido SP (1999) Silk I structure in Bombyx mori silk foams. Int J Biol Macromol 24, 187– 195. 4 Couble P, Chevillard M, Monie A, Ravel-Chapuis P & Prudhomme JC (1985) Structural organization of the P25 gene of Bombyx mori and comparative analysis of its 5’ flanking DNA with that of the fibroin gene. Nucleic Acids Res 13, 1801–1814.
18 Anderson JP (1998) Morphology and primary crystal structure of a silk-like protein polymer synthesized by genetically engineered Escherichia coli bacteria. Biopoly- mers 45, 307–321. 19 Asakura T, Yamane T, Nakazawa Y, Kameda T &
5 Kaplan DL, Adams WW, Farmer B & Viney C (1993) Silk: biology, structure, properties, and genetics. In Silk Polymers Materials Science and Biotechnology (Kaplan DL, Adams WW, Farmer B & Viney C, eds), pp. 2–16. The Division of Polymer Chemistry, Inc., Charlottes- ville, VA. 6 Zong XH, Zhou P, Shao ZZ, Chen SM, Chen X, Ando K (2001) Structure of Bombyx mori silk fibroin before spinning in solid state studied with wide angle X-ray scattering and 13C cross-polarization ⁄ magic angle spinning NMR. Biopolymers 58, 521–525.
Hu BW, Deng F & Yao WH (2004) Effect of pH and copper(II) on the conformation transitions of silk fibroin based on EPR, NMR, and Raman spectroscopy. Biochemistry 43, 11932–11941.
20 Monti P, Freddi G, Bertoluzza A, Kasai N & Tsukada M (1998) Raman spectroscopic studies of silk fibroin from Bombyx mori. J Raman Spectrosc 29, 297–304. 21 Monti P, Taddei P & Freddi G (2001) Raman spectro- scopic characterization of Bombyx mori silk fibroin: Raman spectrum of Silk I. J Raman Spectrosc 32, 103– 107. 7 Zhou P, Xie X, Knight DP, Zong XH, Deng F & Yao WH (2004) Effects of pH and calcium ions on the conformational transitions in silk fibroin using 2D Raman correlation spectroscopy and 13C solid-state NMR. Biochemistry 43, 11302–11311.
8 Tsuda H, Tanaka T, Inoue SI, Magoshi Y & Magoshi J (2003) Silkworm regulates the fibroin liquid gel using gradient of concentration of calcium and potassium ions. Polym Prep 44, 1214–1215. 22 Asakura T, Kuzuhara A, Tabeta R & Saito H (1985) Conformation characterization of Bombyx mori silk fibroin in the solid state by high-frequency 13C cross polarization–magic angle spinning NMR, X–ray diffrac- tion, and infrared spectroscopy. Macromolecules 18, 1841–1845.
9 Kobayashi M, Tanaka T, Inoue S, Tsuda H, Magoshi J & Magoshi Y (2001) Control of gel–sol transition of the silk fibroin by metal ions. Trans Mater Res Soc Jpn 26, 577–579.
23 Saito H, Tabeta R, Asakura T, Iwanaga Y, Shoji A, Ozaki T & Ando I (1984) High-resolution 13C NMR study of silk fibroin in the solid state by the cross-polar- ization–magic angle. Macromolecules 17, 1405–1412. 24 Ishida M, Asakura T, Yokoi M & Saito H (1990) Sol-
10 Terry AE, Knight DP, Porter D & Vollrath F (2004) pH induced changes in the rheology of silk fibroin solution from the middle division of Bombyx mori silkworm. Biomacromolecules 5, 768–772. 11 Shao ZZ & Vollrath F (2002) Surprising strength of vent- and mechanical-treatment-induced conformational transition of silk fibroins studies by high-resolution solid-state 13C NMR spectroscopy. Macromolecules 23, 88–94. silkworm silk. Nature 418, 741–741. 25 Nicholson LK, Asakura T, Demura M & Cross TA
12 Chen X, Knight DP, Shao ZZ & Vollrath F (2001) Regenerated Bombyx silk solutions studied with rheometry and FTIR. Polymer 42, 9969–9974.
(1993) A method for studying the structure of uniaxially aligned biopolymers using solid state 15N NMR: appli- cation to Bombyx mori silk fibroin fibers. Biopolymers 33, 847–861.
FEBS Journal 275 (2008) 219–232 ª 2007 The Authors Journal compilation ª 2007 FEBS
230
26 Asakura T, Aoki A, Demura M, Joers JM, Rosanske RC & Gullion T (1994) Structure of Bombyx mori silk 13 Hu BW, Zhou P, Noda I & Ruan QX (2006) General- ized two-dimensional correlation analysis of NMR and Raman spectra for structural evolution characteriza- tions of silk fibroin. J Phys Chem B 110, 18046–18051.
Q.-X. Ruan et al.
K+-induced conformation transition of silk fibroin
fibroin studied by REDOR NMR spectroscopy. Polym J 26, 1405–1408.
Materials Science and Biotechnology (Kaplan DL, Adams WW, Farmer B & Viney C, eds), Vol. 544, pp. 292–310. American Chemical Society, Washington, DC.
27 Asakura T, Demura M, Hiraishi Y, Ogawa K & Uy- ama A (1994) Determination of the structure of [1–13C]glycine– [15N]alanine double labeled Bombyx mori silk fibroin fibers using solid state 15N NMR. Chem Lett 41, 2249–2252. 28 Asakura T, Demura M, Date T, Miyashita N, Ogawa 39 Zhou L, Chen X, Shao ZZ, Huang YF & Knight DP (2005) Effect of metallic ions on silk formation in the mulberry silkworm, Bombyx mori. J Phys Chem B 109, 16937–16945.
K & Williamson MP (1997) NMR study of silk I struc- ture of Bombyx mori silk fibroin with 15N- and 13C- NMR chemical shift contour plots. Biopolymer 41, 193– 203. 40 Foo CWP, Bini E, Hensman J, Knight DP, Lewis RV & Kaplan DL (2006) Role of pH and charge on silk protein assembly in insects and spiders. Appl Phys A Mater Sci Process 82, 223–233. 41 Masatashi K, Toshihisa T, Shun-ichi I, Hidetoshi T,
29 Asakura T, Minami M, Shimada R, Demura M, Osanai M, Fujito T, Imanari M & Ulrich AS (1997) 2H–Label- ing of silk fibroin fibers and their structural character- ization by solid-state 2H–NMR. Macromolecules 30, 2429–2435. Jun M & Yoshiko M (2001) Study of sol–gel transition of silk fibroin. Polym Mater Sci Eng 84, 620–620. 42 Knight DP & Vollrath F (2001) Changes in element composition along the spinning duct in a Nephila spider. Naturwissenschaften 88, 179–182.
43 Chen X, Knight DP, Shao ZZ & Fritz V (2002) Rheological characterization of Nephila spidroin solution. Biochemistry 41, 14944–14950. 44 Thiel BL & Viney C (1997) Spider major ampullate silk 30 Demura M, Minami M, Asakura T & Cross TA (1998) Structure of Bombyx mori silk fibroin based on solid- state NMR orientational constraints and fiber diffrac- tion unit cell parameters. J Am Chem Soc 120, 1300– 1308.
(drag line): smart composite processing based on imperfect crystals. J Microsc 185, 179–187.
45 Theil BL, Kunkel DD & Viney C (1994) Physical and chemical microstructure of spider dragline – a study by analytical transmission electron-microscopy. Biopolymers 34, 1089–1097. 31 Asakura T, Ashida J, Yamane T, Kameda T, Nakaza- wa Y, Ohgo K & Komatsu K (2001) A repeated b–turn structure in poly(Ala–Gly) as a model for silk I of Bombyx mori silk fibroin studied with two-dimensional spin-diffusion NMR under off magic angle spinning and rotational echo double resonance. J Mol Biol 306, 291–305.
46 Noda I (1993) Generalized two-dimensional correlation method applicable to infrared, Raman, and other types of spectroscopy. Appl Spectrosc 47, 1329–1336. 47 Noda I, Dowrey AE, Marcott C, Story GM & Ozaki Y
(2000) Generalized two-dimensional correlation spectroscopy. Appl Spectrosc 54, 236A–248A. 48 Chae B, Lee SW, Ree M, Jung YM & Kim SB (2003)
32 Asakura T, Ashida J & Yamane T (2003) Structure of Bombyx mori silk fibroin before spinning in silkworm. In NMR Spectroscopy of Polymers in Solution and in the Solid State (Cheng HN & English AD, eds), pp. 71– 82. American Chemical Society, Washington, DC. 33 Zhou P, Li GY & Shao ZZ (2001) Structure of Bombyx mori silk fibroin based on the DFT chemical shift calcu- lation. J Phys Chem B 105, 12469–12476.
Photoreaction and molecular reorientation in a nanoscaled film of poly(methyl 4– (methacryloyloxy) cinnamate) studied by two-dimensional FTIR and UV correlation spectroscopy. Langmuir 19, 687–695. 49 Taddei P, Asakura T, Yao JM & Monti P (2004) 34 Asakura T, Sugino R & Yao JM (2002) Comparative structure analysis of tyrosine and valine residues in unprocessed silk fibroin (Silk I) and in the processed silk. Biochemistry 41, 4415–4424. 35 Li GY, Zhou P, Sun YJ, Yao WH, Mi Y, Yao HY,
Raman study of poly(alanine–glycine)-based peptides containing tyrosine, valine and serine as model for the semicrystalline domains of Bombyx mori silk fibroin. Biopolymers 75, 314–324. Shao ZZ & Yu TY (2001) The effect of metal ions on the conformation transition of silk fibroin. Chem J Chin Univ Chin 22, 860–862.
50 Sianwiza MN, Lord RC, Chen MC, Takamatsu Y, Harada I, Matsuura H & Shimanouchi T (1975) Interpretation of the doublet at 850 and 830 cm-1 in the Raman spectra of tyrosyl residues in proteins and certain model compounds. Biochemistry 14, 4870–4876. 51 Overman SA & Thomas GJ Jr (1995) Raman 36 Hossain KS, Ochi A, Ooyama E, Magoshi J & Nemoto N (2003) Dynamic light scattering of native silk fibroin solution extracted from different parts of the middle division of the silk gland of the Bombyx mori silkworm. Biomacromolecules 4, 350–359. 37 Tanaka T, Kobayashi M, Tsuda H, Inoue S, Magoshi
FEBS Journal 275 (2008) 219–232 ª 2007 The Authors Journal compilation ª 2007 FEBS
231
spectroscopy of the filamentous virus Ff (fd, f1, M13): structural interpretation for coat protein aromatics. Biochemistry 34, 5440–5451. Y, Nakamura S & Magoshi J (2002) Effect of inorganic salt on drawing of silk fibroin. Polym Prep 43, 408–408. 52 Overman SA & Thomas GJ Jr (1998) Amide modes of the a–helix: Raman spectroscopy of filamentous virus fd 38 Magoshi J, Magoshi Y & Nakamura S (1994) Mecha- nism of fiber formation of silkworm. In Silk Polymers:
Q.-X. Ruan et al.
K+-induced conformation transition of silk fibroin
62 Nathoo AN, Moeller RA, Westlund BA & Hart AC containing peptide 13C and 2H labels in coat protein subunits. Biochemistry 37, 5654–5665.
(2001) Identification of neuropeptide-like protein gene families in Caenorhabditis elegans and other species. Proc Natl Acad Sci USA 98, 14000–14005. 53 Kim UJ, Park J, Li CM, Jin HJ, Valluzzi R & Kaplan DL (2004) Structure and properties of silk hydrogels. Biomacromolecules 5, 786–792.
54 Heginbotham L, Abramson T & MacKinnon R (1992) A functional connection between the pores of distantly related ion channels as revealed by mutant K+ chan- nels. Science 258, 1152–1155. 63 Kameda T, Ohkawa Y, Yoshizawa K, Nakano E, Hira- oki T, Ulrich AS & Asakura T (1999) Dynamics of the tyrosine side chain in Bombyx mori and Samia cynthia ricini silk fibroin studied by solid state 2H NMR. Mac- romolecules 32, 8491–8495. 64 Uversky VN, Li J & Fink AL (2004) Metal-triggered
structural transformations, aggregation, and fibrillation of human alpha-synuclein: a possible molecular link between Parkinson’s disease and heavy metal exposure. J Biol Chem 276, 44284–44296. 65 Haston JL, Engelsen SB, Roessle M, Clarkson J,
55 Doyle DA, Cabral JM, Pfuetzner RA, Kuo A, Gulbis JM, Cohen SL, Chait BT & MacKinnon R (1998) The structure of the potassium channel: molecular basis of K+ conduction and selectivity. Science 280, 69–77. 56 Zhou Y, Morais-Cabral JH, Kaufman A & MacKinnon R (2001) Chemistry of ion coordination and hydration revealed by a K+ channel–Fab complex at 2.0 A˚ resolu- tion. Nature 414, 43–48. 57 Roux B (2005) Ion conduction and selectivity in K+ Blanch EW, Baldock C, Kielty CM & Wess TJ (2003) Raman microscopy and X–ray diffraction: a combined study of fibrillin-rich microfibrillar elasticity. J Biol Chem 278, 41189–41197.
channels. Annu Rev Biophys Biomol Struct 34, 153–171. 58 Heginbotham L, LeMasurier M, Kolmakova-Partensky L & Miller C (1999) Single Streptomyces lividans K+ channels: functional asymmetries and sidedness of pro- ton activation. J Gen Physiol 114, 551–560. 66 Torrent J, Alvarez-Martinez MT, Liautard JP, Balny C & Lange R (2005) The role of the 132-160 region in prion protein conformational transitions. Protein Sci 14, 956–967. 59 Colgin MA & Lewis RV (1998) Spider minor ampullate
67 Jenkins J & Pickersgill R (2001) The architecture of parallel beta-helices and related folds. Prog Biophys Mol Biol 77, 111–175. 68 Asakura T, Hamada M, Nakazawa Y, Ha SW & silk proteins contain new repetitive sequences and highly conserved non-silk-like spacer regions. Protein Sci 7, 667–672.
60 Xu M & Lewis RV (1990) Structure of a protein super- fiber: spider dragline silk. Proc Natl Acad Sci USA 87, 7120–7124. 61 Suzuki T, Kurokawa T, Hashimoto H & Sugiyama M Knight DP (2006) Conformational study of silk-like peptides containing the calcium-binding sequence from calbindin D9k using 13C CP ⁄ MAS NMR spectroscopy. Biomacromolecules 7, 627–634.
FEBS Journal 275 (2008) 219–232 ª 2007 The Authors Journal compilation ª 2007 FEBS
232
69 Tu AT (1982) Raman Spectroscopy in Biology: Princi- ples and Applications. John Wiley & Sons, Chichester, UK. (2002) cDNA sequence and tissue expression of Fugu rubripes prion protein-like: a candidate for the teleost orthologue of tetrapod PrPs. Biochem Biophys Res Commun 294, 912–917.