HUE JOURNAL OF MEDICINE AND PHARMACY ISSN 3030-4318; eISSN: 3030-4326HUE JOURNAL OF MEDICINE AND PHARMACY ISSN 3030-4318; eISSN: 3030-4326
84 85
Hue Journal of Medicine and Pharmacy, Volume 15, No.2/2025 Hue Journal of Medicine and Pharmacy, Volume 15, No.2/2025
Prevalence and risk factors of low bone mineral density in
spondyloarthritis
Nguyen Hoang Thanh Van*, Pham Thi Thuy Dung
Department of Internal Medicine - University of Medicine and Pharmacy, Hue University
Abstract
Background: Osteopenia is a common bone disorder that is the most prevalent underlying cause of
fractures. One of the causes of secondary osteopenia is spondyloarthritis. The rate of bone loss in patients
with spondyloarthritis is relatively high in the early stages of the disease. Objectives: This study is evaluated
the prevalence and risk factors of low bone mineral density by Dual Energy X-ray Absorptiometry (DEXA)
in spondyloarthritis. Material and Methods: A cross-sectional description combined to retrospective with
control group. The spondyloarthritis group included 40 patients at the Department of General Internal
Medicine-Endocrinology-Rheumatology, Hue University of Medicine and Pharmacy Hospital. The group of
patients with 40 healthy people had their bone mineral density measured at the Department of Functional
Exploration - Hue University of Medicine and Pharmacy Hospital. Results: Spondyloarthritis is common in
men, accounting for 67.5%, with onset in young patients. In spondyloarthritis patients, the average bone
mineral density in the lumbar spine was 0.908 ± 0.193 g/cm², at the femoral neck was 0.910 ± 0.208 g/cm²,
at the total hip was 0.910 ± 0.208 g/cm², much lower than the control group with statistical significance
(p<0.05). The rate of osteopenia in the lumbar spine is 22.5%, in the femoral neck and the total hip is 5%.
When comparing the mean bone mineral density of the spondyloarthritis group with the control group, in
the lumbar spine, the average bone mineral density of lumbar vertebrae L4 decreased the most by 12.7%.
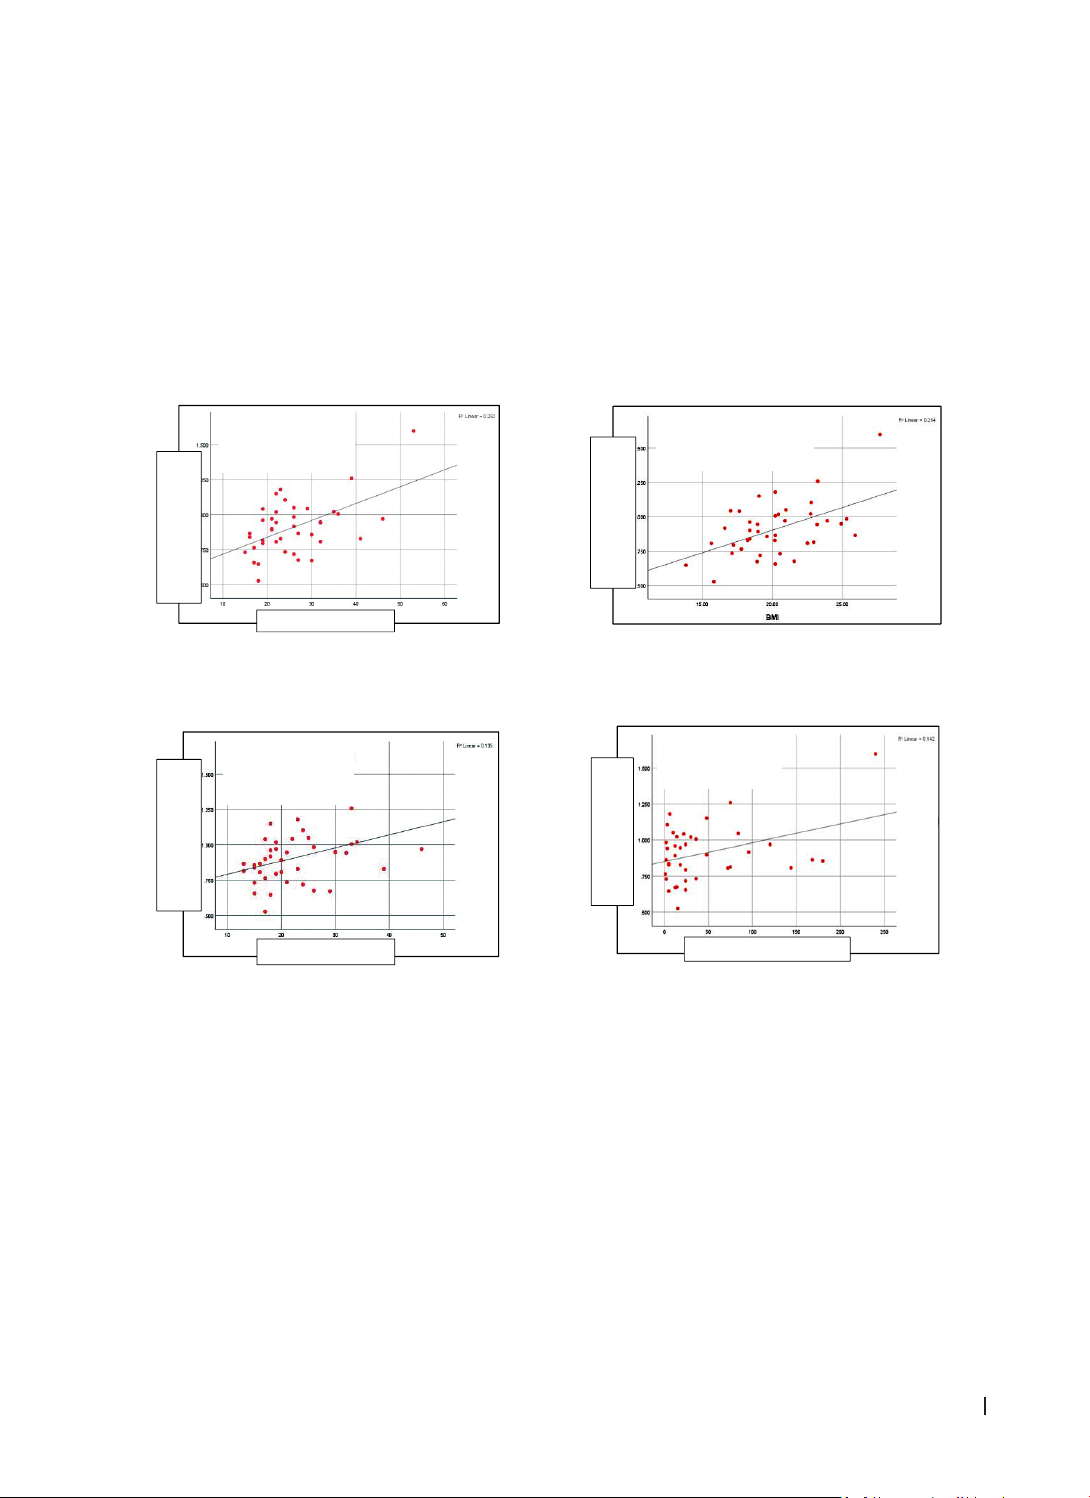
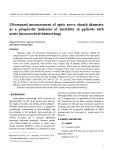
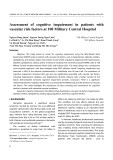
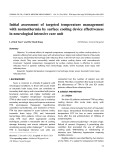
Bone mineral density in the lumbar spine positively correlates with age, age of disease onset, disease
duration, and BMI (body mass index), with no correlation with CRP value, erythrocyte sedimentation rate,
disease activity level, lesions sacroiliac joint injury on X-ray. Bone mineral density at the femoral neck
was not associated with sex, age, age of onset, disease duration, BMI, CRP, erythrocyte sedimentation rate,
disease activity level, sacroiliac joint damage on X-ray, and treatment. Conclusions: Osteopenia is common in
patients with spondyloarthritis, especially in the lumbar spine. Bone mineral density in the lumbar spine was
positively correlated with age, age of disease onset, disease duration, and BMI.
Keywords: spondyloarthritis, osteoporosis, bone mineral density, osteopenia, Vietnam.
*Corresponding Author: Nguyen Hoang Thanh Van
Email: nhtvan@huemed-univ.edu.vn; nhtvan@hueuni.edu.vn
Received: 12/1/2025; Accepted: 10/3/2025; Published: 28/4/2025
DOI: 10.34071/jmp.2025.2.13
1. INTRODUCTION
Osteoporosis is a bone disorder characterized
by decreased bone strength that increases the
fracture risk. Bone strength is reflected by bone
density and bone quality. Osteoporosis is the
most common underlying cause of fractures and
accounts for approximately 1.5 million fractures in
the United States each year. In addition, each year,
there are more than 500,000 hospitalizations, more
than 2.6 million medical visits, more than 800,000
emergency hospital admissions, and approximately
180,000 people enrolled in nursing homes in the
US. It is predicted that by 2040, the cost of treating
osteoporosis and its complications will increase from
100% to 200% [1].
Based on the cause, osteoporosis is divided
into two main groups: primary and secondary
osteoporosis [2]. One of the causes of secondary
osteoporosis is spondyloarthritis. Decreased bone
mineral density and osteoporotic vertebral fractures
are known complications of spondylitis, especially in
ankylosing spondylitis. A reduction in bone density
has been reported as high as 47% in the lumbar
and femoral spine, even in patients with early-
stage spondyloarthritis [3]. Patients with ankylosing
spondylitis may be at increased risk of bone loss due
to high levels of disease activity, proinflammatory
cytokines, mechanical factors (i.e., spinal stiffness,
vertebral deformity), and reduced physical activity or
mineralization defects associated with inflammatory
bowel conditions [4].
Therefore, it is essential to evaluate the risk
factors for reduced bone density and osteoporosis
and predict the risk of fracture in patients with
spondyloarthritis, from which there are treatment
and preventive measures to reduce the risk of fracture
HUE JOURNAL OF MEDICINE AND PHARMACY ISSN 3030-4318; eISSN: 3030-4326HUE JOURNAL OF MEDICINE AND PHARMACY ISSN 3030-4318; eISSN: 3030-4326
86 87
Hue Journal of Medicine and Pharmacy, Volume 15, No.2/2025 Hue Journal of Medicine and Pharmacy, Volume 15, No.2/2025
in patients. So, we conducted a study on the topic:
“Prevalence and risk factors of low bone mineral
density in spondyloarthritis” with the research
objective: Evaluation the prevalence and risk factors
of low bone mineral density by Dual Energy X-ray
Absorptiometry (DEXA) in spondyloarthritis
2. SUBJECTS AND METHODS
2.1. Research subjects
A cross-sectional descriptive study with
retrospective comparison was performed on
40 patients diagnosed with spondyloarthritis
according to ASAS 2009 criteria [5], being treated
at the Department of General Internal Medicine-
Endocrinology- Rheumatology - Hue Central Hospital
from June 2019 to November 2021 and the control
group were 40 people without spondyloarthritis and
other diseases affecting to bone mineral density.
2.1.1. Criteria for selecting disease groups:
The patient was diagnosed with spondyloarthritis
according to the Assessment of Spondylo Arthritis
International Society - ASAS 2009 criteria [5].
The patient had no physical, mental, or physical
disabilities or ability to communicate influence when
answering questions.
2.1.2. Criteria for selecting a control group: The
control group is those who went to the hospital for
medical examination at the Hue University Hospital
and did not have spondyloarthritis or diseases that
affect the results of BMD, such as diabetes, kidney
failure, hyperthyroidism, or hyperparathyroidism.
2.1.3. Exclusion criteria: It is crucial to note
that some patients did not provide their consent
to participate in the study. The patient is currently
battling an acute illness. Additionally, the patient
has undergone bilateral hip replacement. Its
important to consider that some patients may
have contraindications to DEXA bone density
measurement, such as pregnant women or those
who have recently undergone gastrointestinal
contrast and nuclear medicine testing. These
patients are advised to wait at least 72 hours before
measuring bone mineral density, or 7 days for long-
lived units such as gallium.
2.2. Research methods
A cross-sectional descriptive study with
retrospective comparison
2.3. Analyzing data
The data were collected and processed using
SPSS 26.0 software
3. RESULTS
3.1. General characteristics of the study group
3.1.1. Comparison of anthropometric characteristics of the spondyloarthritis group and the control
group
Table 1. Anthropometric characteristics of the spondyloarthritis group and the control group
Factorial SpA group (n = 40) Control group (n = 40) p
Gender Male 27 27
Female 13 13
Age
≤ 30 years 31 30 0.000
>30 years 9 10 0.942
Medium 25.78 ± 8.51 29.58 ± 6.45 0.027
BMI
Underweight 17.07 ±1.34 17.18 ± 1.28 0.879
Normal 20.54 ± 1.34 21.10 ± 1.35 0.173
Overweight 24.88 ± 1.61 24.78 ± 1.35 0.902
Medium 20.17 ± 3.01 21.53 ± 2.64 0.035
- The SpA group and the control group had a similar gender distribution.
- The mean age of the SpA group and control group was different between the two groups (p<0.05).
Notably, the number of subjects under 30 years old dominated in both groups.
- There was no difference in body mass index (BMI) between the underweight, normal, and overweight
groups (p>0.05).
HUE JOURNAL OF MEDICINE AND PHARMACY ISSN 3030-4318; eISSN: 3030-4326HUE JOURNAL OF MEDICINE AND PHARMACY ISSN 3030-4318; eISSN: 3030-4326
86 87
Hue Journal of Medicine and Pharmacy, Volume 15, No.2/2025 Hue Journal of Medicine and Pharmacy, Volume 15, No.2/2025
3.1.2. Clinical and sub-clinical characteristics of patients with spondyloarthritis
The spondyloarthritis group includes 40 subjects, of which 67.5% are male. The age of disease onset was
22.48 ± 7.61 years old. The mean duration of disease was 43.30 ± 56.37 months. Family factors account for 7.5%.
Table 2. Clinical and sub-clinical characteristics of patients with spondylarthitis
Median SD Min-Max
CRP (mg/l) 30.78 58.44 0.31 - 300.57
ESR (mm/h) 30.95 26.47 6 - 109
HLA-B27 5/6 (83.3%)
ASDAS-CRP 2.49 1.16 0.87-5.86
Sacroiliitis on x-ray Stage 0:10 (25%) Not qualified clinical criteria
New York: 14 (35%)
Qualification clinical
NewYork: 16 (40%)
MRI of sacroiliac
joints
No damage: 2/29 (6.9%) Active inflammation lesions:
19/29 (65.5%)
Chronic inflammation
lesions: 8/29 (27.6%)
Classification Ankylosing spondylitis: 16
(40%)
Non-radiographic axial
spondyloarthritis: 24 (60%)
Peripheral SpA: 0%
Treatment Nontreatment: 25 (62.5%) *cDMARDs: 2 (5%) **bDMARDs: 13 (32.5%)
*: conventional disease-modifying antirheumatic drugs
**: biologic disease-modifying antirheumatic drugs
- Sacroiliitis on x-ray qualification New York criteria accounts for only 40%.
- an MRI of the sacroiliac joints was performed on 29 patients. In which 93.1% of patients have sacroiliac
joint abnormalities, active inflammatory lesions account for 65.5%.
- All patients belong to the axial spondyloarthritis group, 40% have ankylosing spondylitis and 60% have
non-radiographic axial spondyloarthritis.
- Most patients with spondyloarthritis have not been treated, accounting for 62.5%. The treatment group
consisted of cDMARD (5%) and bDMARDs (32.5%).
3.2. Bone mineral density in spondyloarthritis
3.2.1. Prevalence of low bone mineral density of study subjects according to Z-score
Table 3. Prevalence of low bone mineral density by Z-score (Z-score ≤ -2)
Position SpA group (n = 40) Control group (n = 40)
N % N %
Lumbar spine 9 22.5 0 0
Femoral neck 2 5.0 0 0
Total hip 2 5.0 0 0
Any site 9 22.5 0 0
- There was no decrease in bone density in the control group.
- With the SpA group, the overall reduction in bone density was 22.5%, 22.5% in the lumbar spine, and 5%
at the femoral neck and the total hip.
3.2.2. Mean bone mineral density of spondyloarthritis group and control group
Table 4. Mean bone mineral density of spondyloarthritis group and control group
Position SpA group (n=40) Control group (n=40) p
L1 BMD 0.839 ± 0.184 0.956 ± 0.130 0.001
Z-score -0.412 ± 1.870 0.722 ± 1.193 0.002
L2 BMD 0.912 ± 0.196 1.026 ± 0.126 0.003
Z-score -0.412 ± 1.989 0.658 ± 1.161 0.005
L3 BMD 0.936 ± 0.201 1.064 ± 0.126 0.001
Z-score -0.655 ± 2.021 0.590 ± 1.133 0.001
HUE JOURNAL OF MEDICINE AND PHARMACY ISSN 3030-4318; eISSN: 3030-4326HUE JOURNAL OF MEDICINE AND PHARMACY ISSN 3030-4318; eISSN: 3030-4326
88 89
Hue Journal of Medicine and Pharmacy, Volume 15, No.2/2025 Hue Journal of Medicine and Pharmacy, Volume 15, No.2/2025
L4 BMD 0.934 ± 0.206 1.070 ± 0.117 0.001
Z-score -1.130 ± 2.112 0.180 ± 1.135 0.001
Lumbar spine BMD 0.908 ± 0.193 1.032 ± 0.117 0.001
Z-score -0.695 ± 1.981 0.505 ± 1.064 0.001
Femoral neck BMD 0.910 ± 0.208 1.056 ± 0.210 0.003
Z-score 0.483 ± 1.697 1.615 ± 1.463 0.002
Total hip BMD 0.970 ± 0.185 1.112 ± 0.163 0.001
Z-score -0.240 ± 1.221 0.665 ± 0.922 0.000
- The average BMD of the lumbar spine and femur of the SpA group was statistically significant (p<0.05)
lower than that of the control group.
3.2.3. Bone mineral density of the spondyloarthritis group and the control group by age
Table 5. Bone mineral density of the study group by age
BMD SpA group Control group p
Age ≤ 30 years n = 31 n = 30
Lumbar spine 0.869 ± 0,160 1.037 ± 0.131 0.000
Femoral neck 0.887 ± 0,202 1.061 ± 0.208 0.002
Total hip 0.948 ± 0,189 1.116 ± 0.173 0.001
Age > 30 years n = 9 n = 10
Lumbar spine 1.042 ± 0.246 1.019 ± 0.061 0.788
Femoral neck 0.989 ± 0.221 1.042 ± 0.227 0.616
Total hip 1.044 ± 0.162 1.097 ± 0.137 0.454
- Age ≤ 30 years: The BMD of the spondyloarthritis group was lower than that of the control group, with
statistical significance in both lumbar spine, femoral neck, and total hip (p<0.05).
3.2.4. Bone mineral density of spondyloarthritis group and control group according to BMI
Table 6. Bone mineral density of study subjects according to BMI
BMD SpA group Control group p
BMI < 18,5 n = 13 n = 5
Lumbar spine 0.830 ± 0.148 0.938 ± 0.052 0.134
Femoral neck 0.833 ± 0.183 0.924 ± 0.087 0.307
Total hip 0.902 ± 0.168 0.971 ± 0.061 0.391
18.5 ≤ BMI < 22.9 n = 20 n = 25
Lumbar spine 0.898 ± 0.162 1.024 ± 0.073 0.004
Femoral neck 0.944 ± 0.240 1.046 ± 0.201 0.127
Total hip 0.990 ± 0.215 1.098±0.146 0.064
BMI ≥ 23 n = 7 n = 10 p
Lumbar spine 1.081 ± 0.259 1.101 ± 0.183 0.849
Femoral neck 0.957 ± 0.108 1.148 ± 0.248 0.078
Total hip 1.037 ± 0.061 1.215 ± 0.183 0.015
- Underweight group: There was no difference in BMD between the spondyloarthritis group and the
control group (p>0.05).
HUE JOURNAL OF MEDICINE AND PHARMACY ISSN 3030-4318; eISSN: 3030-4326HUE JOURNAL OF MEDICINE AND PHARMACY ISSN 3030-4318; eISSN: 3030-4326
88 89
Hue Journal of Medicine and Pharmacy, Volume 15, No.2/2025 Hue Journal of Medicine and Pharmacy, Volume 15, No.2/2025
- Normal group: the BMD in the lumbar spine
of the spondyloarthritis group was statistically
significant compared with the control group
(p=0.004), and there was no significant difference in
the BMD in the femoral neck and the total hip in the
two groups (p>0.05).
- Overweight group, there was no difference in
BMD in the lumbar spine and femoral neck between
the two groups of spondyloarthritis and the control
group. Meanwhile, BMD at the total hip of the
spondyloarthritis group was statistically significantly
lower than that of the control group (p<0.05).
3.3. The relationship between BMD between
patients with spondyloarthritis and factors
Our comprehensive study has thoroughly
investigated the associations between the BMD of
the lumbar spine and key factors such as age, age at
onset of disease, duration of disease, and BMI. We
found no significant associations with gender, CRP,
ESR, sacroiliitis on X-ray, and treatment of disease.
The BMD at the femoral neck and the total hip was
also found to be unrelated to these factors.
5
Chard 4. Correlation between BMD of
lumbar spine with duration of disease
Chard 4. Correlation between BMD of lumbar
spine with duration of disease
with gender, CRP, ESR, sacroiliitis on X-ray, and treatment of disease. The BMD at the femoral neck and the total hip
was also found to be unrelated to these factors.
y=0.243 + 0.033x
r=0.531 (p<0.05)
y=0.698 + 0.009x
r=0.367 (p<0.05)
y=0.597 + 0.012x
r=0.531 (p=0.000)
y=0.852 + 0.001x
r=0.376 (p<0.05)
Chard 2. Correlation between BMD of
lumbar spine and BMI
Chard 3. Correlation between BMD o
f
lumbar spine with age of onset
Chard 1. Correlation between BMD of
lumbar spine and age
BMD-Spine
BMD-Spine
BMD-Spine
BMD-Spine
A
g
e of onset D
uration
of
disease
Age of onset
Chard 1. Correlation between BMD of lumbar spine
and age
5
Chard 4. Correlation between BMD of
lumbar spine with duration of disease
Chard 4. Correlation between BMD of lumbar
spine with duration of disease
with gender, CRP, ESR, sacroiliitis on X-ray, and treatment of disease. The BMD at the femoral neck and the total hip
was also found to be unrelated to these factors.
y=0.243 + 0.033x
r=0.531 (p<0.05)
y=0.698 + 0.009x
r=0.367 (p<0.05)
y=0.597 + 0.012x
r=0.531 (p=0.000)
y=0.852 + 0.001x
r=0.376 (p<0.05)
Chard 2. Correlation between BMD of
lumbar spine and BMI
Chard 3. Correlation between BMD o
f
lumbar spine with age of onset
Chard 1. Correlation between BMD of
lumbar spine and age
BMD-Spine
BMD-Spine
BMD-Spine
BMD-Spine
A
g
e of onset D
uration
of
disease
Age of onset
Chard 2. Correlation between BMD of lumbar spine
and BMI
f
g
uration
of
disease
Chard 3. Correlation between BMD of lumbar spine
with age of onset
5
Chard 4. Correlation between BMD of
lumbar spine with duration of disease
Chard 4. Correlation between BMD of lumbar
spine with duration of disease
with gender, CRP, ESR, sacroiliitis on X-ray, and treatment of disease. The BMD at the femoral neck and the total hip
was also found to be unrelated to these factors.
y=0.243 + 0.033x
r=0.531 (p<0.05)
y=0.698 + 0.009x
r=0.367 (p<0.05)
y=0.597 + 0.012x
r=0.531 (p=0.000)
y=0.852 + 0.001x
r=0.376 (p<0.05)
Chard 2. Correlation between BMD of
lumbar spine and BMI
Chard 3. Correlation between BMD o
f
lumbar spine with age of onset
Chard 1. Correlation between BMD of
lumbar spine and age
BMD-Spine
BMD-Spine
BMD-Spine
BMD-Spine
A
g
e of onset D
uration
of
disease
Age of onset
Chard 4. Correlation between BMD of lumbar spine
with duration of disease
4. DISCUSSION
4.1. Bone mineral density in patients with
spondyloarthritis
Through the study of BMD in 40 SpA patients
with an average age of 25.78 ±8 .51 compared
with 40 subjects without SpA with gender and age
homogeneity (group age ≤30 years old and >30
years old had similarity in numbers, especially with
age >30 years old in the two groups there was no
difference), the BMD of SpA patients at lumbar
spine was 0.908 ± 0.193 g/cm², and at the femoral
neck was 0.910 ± 0.208 g/cm², at the total hip was
0.970 ± 0.185 g/cm², lower than the control group
with a statistically significant difference (p<0.05).
The reduction rate in overall BMD in the SpA group
was 22.5%, mainly in the lumbar spine at 22.5%, the
femoral neck, and the total hip at 5%. The BMD at
each vertebra of SpA patients was lower than that of
the control group; the lowest was at the L4 position
(average BMD decreased 12.7% compared to the
control group). Thus, in our study, the BMD of SpA
patients decreased more at the lumbar spine. This
is also understandable when all spondyloarthritis
subjects in our study were axial spondyloarthritis,
with predominant expression at the spinal position.
Furthermore, in patients with spondyloarthritis, one