HUE JOURNAL OF MEDICINE AND PHARMACY ISSN 3030-4318; eISSN: 3030-4326 197
Hue Journal of Medicine and Pharmacy, Volume 14, No.6/2024
Prolonged QTc interval and its relationship to left ventricular
hypertrophy and left ventricular ejection fraction in hypertensive
patients
Le Thi Bich Thuan1*, Pham Hai Duong1, Nguyen Thi Hoai1, Nguyen Anh Huy1
(1) Hue University of Medicine and Pharmacy, Hue University
Abstract
Objective: The study aimed to determine the prevalence of prolonged QTc interval in hypertensive
patients and investigate its relationship and correlation with left ventricular hypertrophy and left ventricular
ejection fraction (EF) in hypertensive patients. Subjects and Methods: This study is a cross-sectional
descriptive study. The subjects were patients admitted to the Cardiology Department of Hue University
of Medicine and Pharmacy Hospital from February 2020 to February 2021, diagnosed with hypertension
according to the VNHA 2018 guidelines. The patients were divided into two groups: Group 1 with prolonged
QTc and Group 2 with normal QTc. Prolonged QTc was defined as QTc >450ms in males and >460ms in
females. All patients underwent echocardiography to assess left ventricular hypertrophy and left ventricular
ejection fraction (EF), and comparisons were made between the two groups. A p-value <0.05 was considered
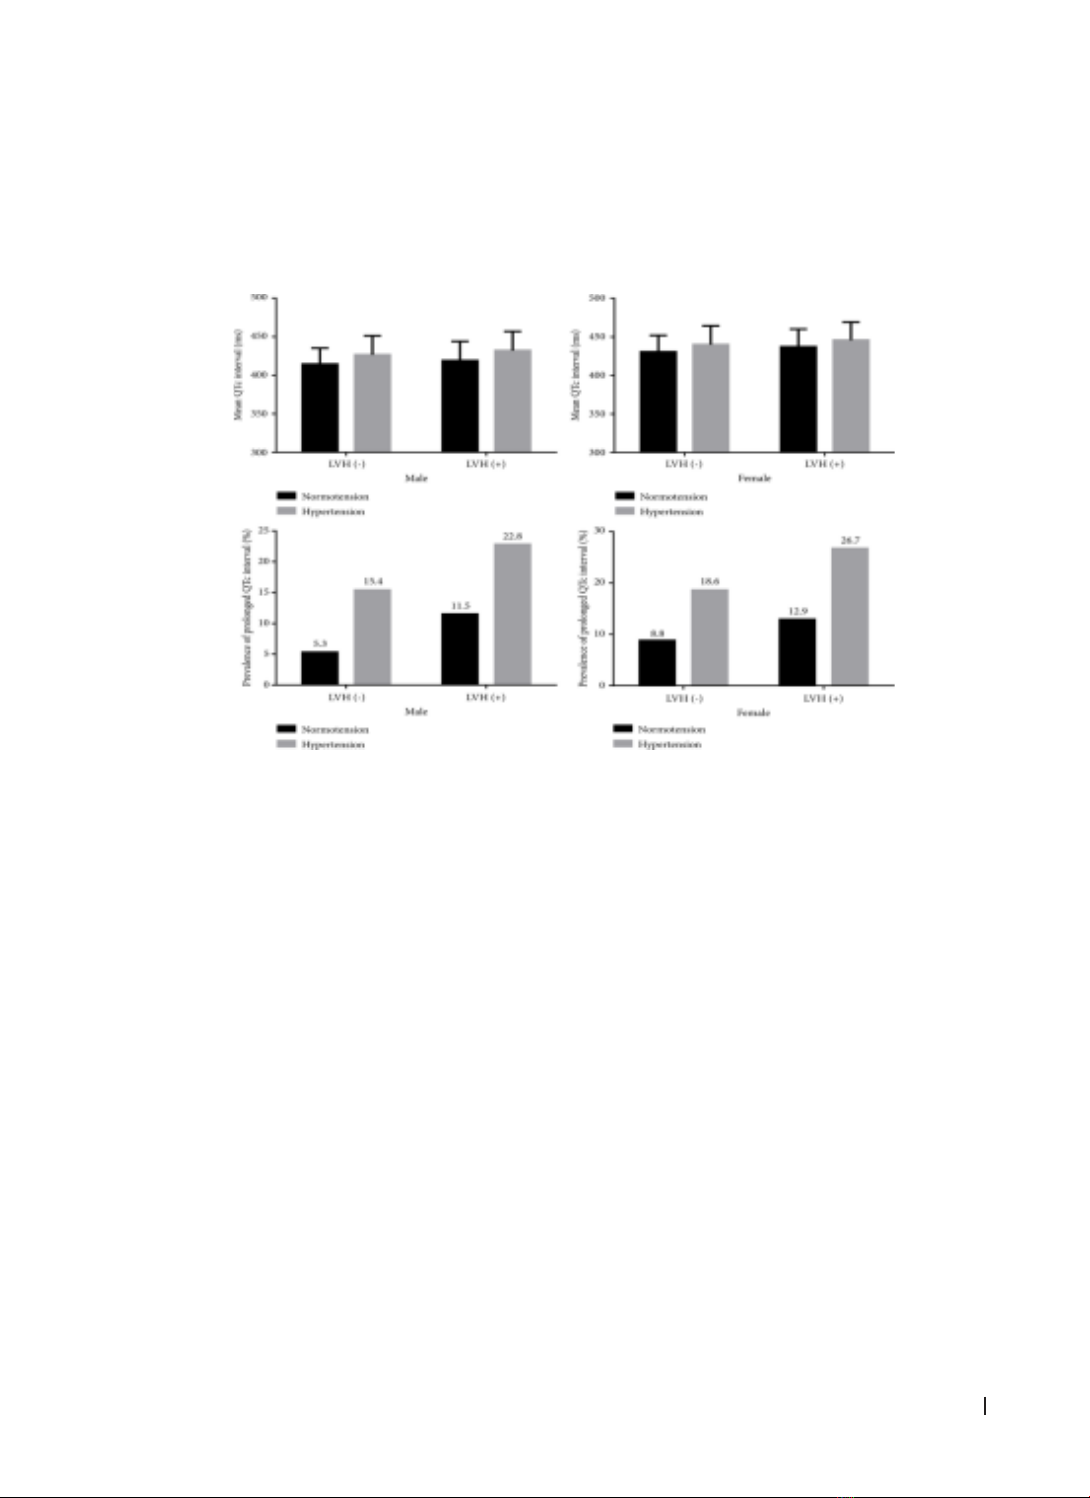
statistically significant. Results: A total of 133 patients were included in the study, with males accounting for
50.4%. Among them, 41 cases (30.8%) had a prolonged QTc interval, while 92 cases (69.2%) had a normal
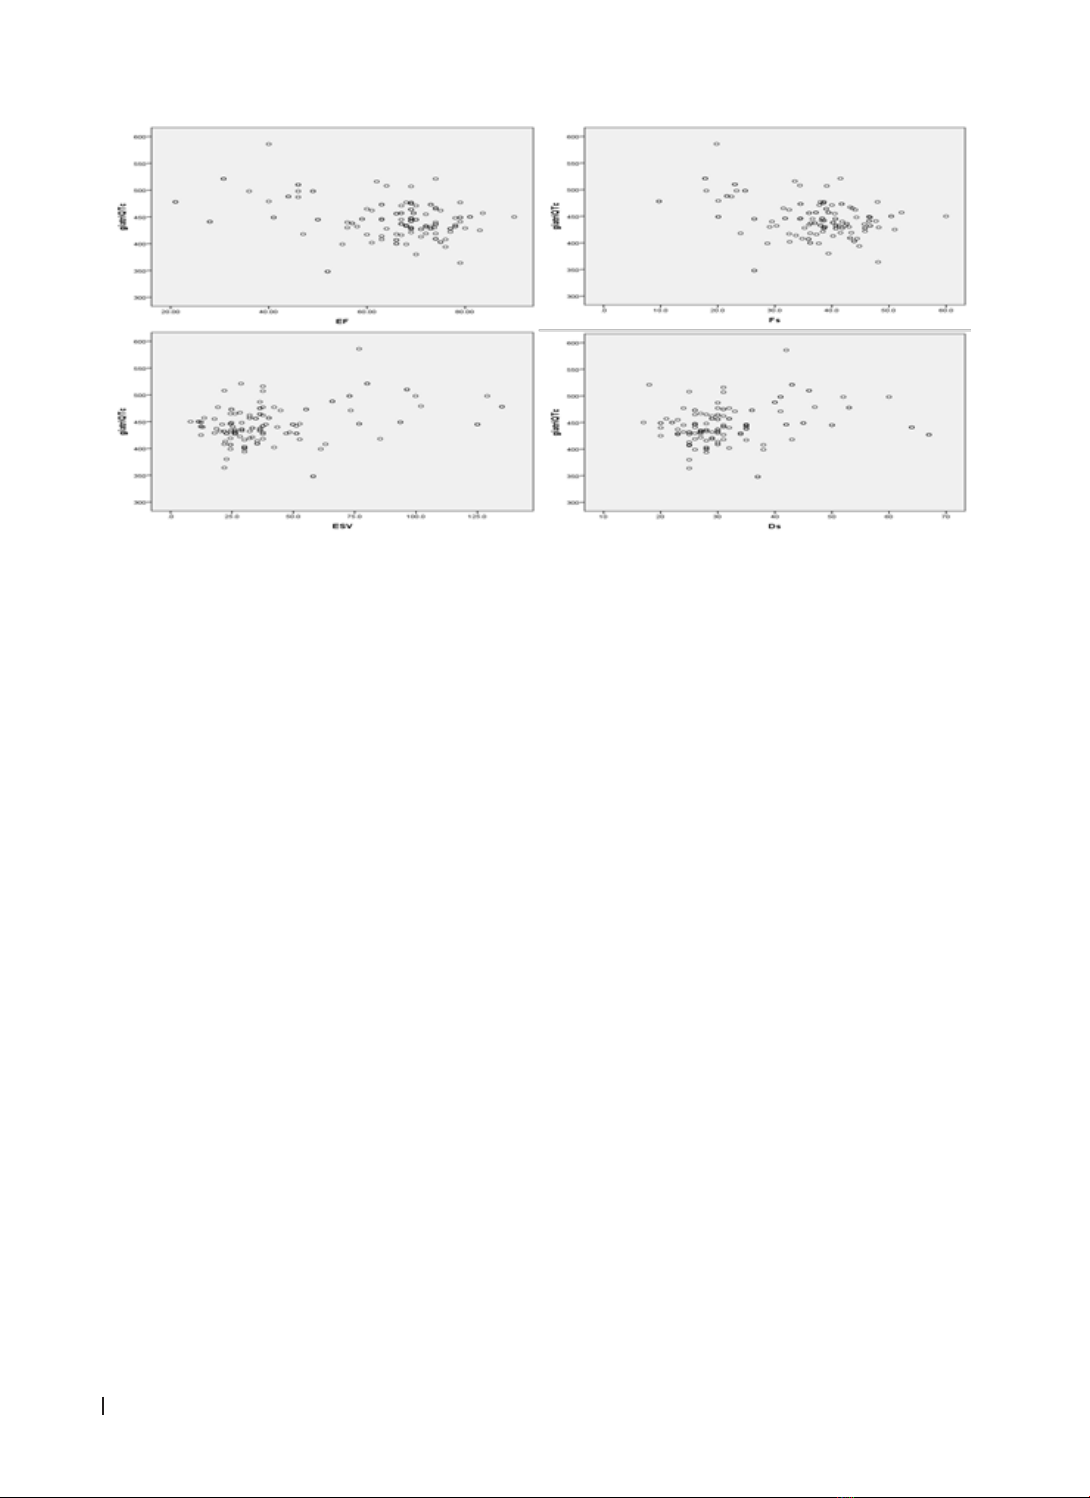
QTc interval. Patients in the prolonged QTc group had significantly lower ejection fraction and fractional
shortening (Fs), higher left ventricular mass index (LVMI), and greater end-diastolic volume (EDV) and end-
systolic volume (ESV) compared to those in the normal QTc group. QTc was negatively correlated with EF
and Fs and positively correlated with ESV and Ds. Furthermore, the prolonged QTc group had a higher
prevalence of heart failure, with statistically significant clinical symptoms of heart failure such as edema,
dyspnea, and tachycardia. Conclusion: The study indicates that prolonged QTc interval has a relatively high
prevalence among hypertensive patients. Prolonged QTc is associated with left ventricular hypertrophy and
left ventricular ejection fraction in hypertensive patients.
Keywords: QTc interval; hypertension; left ventricular hypertrophy; left ventricular ejection fraction.
Corresponding Author: Le Thi Bich Thuan. Email: ltbthuanvn@gmail.com
Received: 8/10/2024; Accepted: 24/11/2024; Published: 25/12/2024
DOI: 10.34071/jmp.2024.6.28
1. INTRODUCTION
Hypertension (HTN) is the most common
modifiable cardiovascular risk factor. The prevalence
of hypertension is increasing and is becoming younger
in age. Many studies have shown that a prolonged
corrected QT interval (QTc) on the electrocardiogram
(ECG) is associated with an increased risk of
cardiovascular mortality, all-cause mortality, and
the risk of ischemic heart disease in hypertensive
patients [1], [2], [3]. Research has demonstrated
that hypertension leads to left ventricular
hypertrophy (LVH), which alters conduction and
causes ventricular repolarization abnormalities,
resulting in prolonged QT intervals on resting ECG in
hypertensive heart disease [4]. Normally, the heart
functions as a coordinated muscle to contract and
relax, pumping blood to nourish the body, regulated
by the heart’s autonomic nodes to control heart rate
and rhythm. When the QTc interval is prolonged, it
extends the relative refractory period of the action
potential, disrupting the timing of each heartbeat
and triggering arrhythmias. This is the cause of
ventricular arrhythmias, sudden cardiac death,
stroke, and mortality in hypertensive patients [2],
[3].
With the aim of investigating the relationship
between prolonged QTc interval, left ventricular
hypertrophy, and left ventricular ejection fraction
(EF) in hypertensive patients, we conducted this
study with the objective to: identify prolonged QTc
in hypertensive patients and evaluate its correlation
with left ventricular hypertrophy and left ventricular
ejection fraction (EF) in this population.
2. STUDY SUBJECTS AND METHODS
Subjects and Methods
This study is a cross-sectional descriptive study.
The subjects were patients admitted to the Cardiology
Department of Hue University of Medicine and
Pharmacy Hospital from February 2020 to February
HUE JOURNAL OF MEDICINE AND PHARMACY ISSN 3030-4318; eISSN: 3030-4326
198
Hue Journal of Medicine and Pharmacy, Volume 14, No.6/2024
2021, diagnosed with hypertension according to
the VNHA 2018 guidelines. Subjects were divided
into two groups: Group 1: Prolonged QTc; Group 2:
Normal QTc.
Data collection
Information collected from patients included
name, age, gender, admission diagnosis, clinical
symptoms, ECG results, and echocardiographic
findings.
Inclusion criteria
Patients with a history of HTN, currently
under treatment, patients newly diagnosed with
HTN, confirmed through three measurements,
hypertension diagnosis criteria follow the 2018
VNHA guidelines: clinic blood pressure (BP) ≥ 140/90
mmHg [5].
Exclusion criteria
Cases where T-wave could not be clearly
identified. Patients with arrhythmias such as atrial
fibrillation, atrial flutter, or other rhythm disorders.
Conditions affecting the QT interval, such as
electrolyte imbalances (hypocalcemia, hypokalemia,
etc.), or medications like amiodarone, macrolide and
quinolone antibiotics, tricyclic antidepressants….
Electrocardiogram (ECG): ECGs were performed
using a CP50 12-lead electrocardiograph (Welch
Allyn, USA). ECG was measured once at hospital
admission for diagnosis. If changes occurred
during hospitalization, repeat measurements were
performed. ECG parameters analyzed included
rhythm, frequency, axis, waves, ST segment, QT
and QTc intervals, atrial fibrillation, associated
arrhythmias, ventricular hypertrophy, and myocardial
ischemia. The diagnostic criteria followed the 2010
VNHA guidelines and the 2014 AHA guidelines. QT
and QTc intervals were automatically calculated and
printed by the ECG machine to minimize subjective
error. Prolonged QTc was defined as >450 ms for
males and >460 ms for females.
Echocardiography
Transthoracic echocardiography was performed
following the recommendations of the American
Society of Echocardiography. Selected indices for
assessing left ventricular function included: left atrial
diameter (mm), left ventricular ejection fraction
(EF,%), fractional shortening (FS,%), left ventricular
systolic diameter (Ds, mm), left ventricular diastolic
diameter (Dd, mm), left ventricular mass index
(LVMI, g/m²), end-systolic volume (ESV), end-
diastolic volume (EDV) [6].
Data Analysis
Data were processed using SPSS version 20.0,
with p<0.05 considered statistically significant.
3. RESULTS
Among the 133 patients, 67 were male,
accounting for 50.4%. Group 1: 41 patients (30.8%)
had prolonged QTc intervals. Group 2: 92 patients
(69.2%) had normal QTc intervals. The mean age was
69.69 ± 11.99 years. There was a significant difference
in the mean heart rate between the two groups
(p=0.001). Symptoms such as dyspnea, limb edema,
and heart failure also showed statistically significant
differences between the two groups (p<0.05).
Table 1. General characteristics of study subjects
CharacteristicsTotal
(N=133)
Group 1
(n=41; 30.8%)
Group 2
(n=92; 69.2%) p
Male (n, %) 67 (50.4%) 18 (43.9%) 49 (53.3%) 0.319
Male to Female Ratio 67:66 18:23 49:43 0.319
Mean age 69.69 ± 11.99 72.17 ± 14.14 68.59 ± 10.80 0.153
SBP (mmHg) 148.69 ± 25.50 149.20 ± 20.35 147.56 ± 34.46 0.780
DBP (mmHg) 85.34 ± 14.59 85.65 ± 13.03 84.63 ± 17.76 0.743
Heart rate (bpm) 76.75 ± 14.68 82.76 ± 14.50 74.08 ± 14.30 0.001
Edema (%) 25 (18.80) 12 (29.27) 13 (14.13) 0.039
Dyspnea (%) 15 (11.29) 8 (19.51) 7 (7.61) 0.045
Heart failure (%) 17 (12.78) 11 (26.83) 6 (6.52) 0.001
SBP (systolic blood pressure), DBP (diastolic blood pressure).
The average QTc interval was 445.53 ± 36.8 ms, with the values for the two groups being 484.88 ± 25.41
ms for Group 1 and 427.99 ± 22.46 ms for Group 2, showing a statistically significant difference (p<0.001).
There was no significant difference in the mean PR interval between the two groups (p=0.100) (Table 2).
HUE JOURNAL OF MEDICINE AND PHARMACY ISSN 3030-4318; eISSN: 3030-4326 199
Hue Journal of Medicine and Pharmacy, Volume 14, No.6/2024
Table 2. Electrocardiographic characteristics of the study subjects
ECG Characteristics Total
(N=133)
Group 1
(n=41)
Group 2
(n=92) p
QTc interval (ms) 445.53 ± 36.48 484.88 ± 25.41 427.99 ± 21.46 <0.001
PR interval (ms) 169.41 ± 27.24 175.24 ±30.82 166.82 ± 25.23 0.100
There was a statistically significant difference in the mean values of LA, EF, Ds, ESV, EDV, FS, and LVMI
between the two groups, with p<0.05 (Table 3).
Table 3. Echocardiographic characteristics of study subjects
Parameters Total (N=133) Group 1 (n=41) Group 2 (n=92) p
LA (mm) 32.91 ± 7.14 34.63 ± 5.31 32.14 ± 7.73 0.033*
EF (%) 64.65 ± 13.31 57.80 ± 15.72 67.70 ± 10.85 0.001*
Dd (mm) 49.81 ± 8.34 50.44 ± 7.02 49.74 ± 9.59 0.535
Ds (mm) 32.94 ± 6.94 35.29 ± 9.35 30.99 ± 9.76 0.019*
ESV 41.93 ± 27.04 55.50 ± 32.33 35.88 ± 21.93 0.001*
EDV 115.82 ± 43.11 127.37 ± 39.78 110.67 ± 43.74 0.039*
FS (%) 36.97 ± 8.76 31.63 ± 9.98 39.34 ± 7.00 0.001*
LVMI (g/m2) 126.84 ± 46.00 144.34 ± 41.83 119.04 ± 45.83 0.003*
EF, ejection fraction; Dd, diastolic dimension; Ds, systolic dimension; ESV, end systolic volume; EDV, end
diastolic volume; FS, fraction shortening; LVMI, left ventricular mass index.
In the group with left ventricular hypertrophy, there was a correlation between left ventricular ejection
fraction and fractional shortening with the QTc interval, with p<0.05 (Table 4).
Table 4. Association between EF, Fs, and QTc interval
Left Ventricular
Hypertrophy
QTc Interval (ms) p
Prolonged Normal
EF (%) Yes 57.12 ± 16.04 65.35 ± 12.40 0.01*
No 66.33 ± 7.77 71.04 ± 7.04 0.274
Fs (%) Yes 31.24 ± 10.16 38.46 ± 7.04 0.001*
No 36.67 ± 6.60 40.60 ± 6.27 0.303
EF, ejection fraction; FS, fraction shortening.
There was a moderate inverse correlation between the QTc interval and EF, FS (p<0.001). A moderate
positive correlation was found between the QTc interval and ESV (p<0.001), and a weak positive correlation
was observed between the QTc interval and Ds (p=0.006) (Table 5).
Table 5. Correlation between QTc interval and echocardiographic parameters
Parameters QTc Interval (ms)
rp
LA (mm) 0.165 0.057
EF (%) -0.364 <0.001*
Dd (mm) 0.109 0.211
Ds (mm) 0.236 0.006*
ESV 0.438 <0.001*
EDV 0.209 0.16
Fs (%) -0.366 <0.001*
LVMI (g/m2) 0.161 0.064
LA, Left atrial diameter (in millimeters); EF, Ejection fraction; Dd; diastolic diameter; Ds, diameter systolic; ESV,
End-systolic volume; EDV, End-diastolic volume; FS, Fractional shortening; LVMI, Left ventricular mass index.
HUE JOURNAL OF MEDICINE AND PHARMACY ISSN 3030-4318; eISSN: 3030-4326
200
Hue Journal of Medicine and Pharmacy, Volume 14, No.6/2024
Figure 1. Correlation between QTc interval and echocardiographic parameters
From the correlation diagrams, it can be observed that there is a correlation between the QTc interval and
EF, FS, ESV, and Ds (Figure 1).
4. DISCUSSION
4.1. Assessment of Prolonged QTc in Hypertensive
Patients
The QT interval is measured from the onset of
the Q wave to the end of the T wave on the ECG,
representing the electrical systole time, which
includes both the depolarization and repolarization
phases of the ventricles. Numerous studies have
shown that the QTc interval is influenced by several
factors, including age, female gender, comorbidities,
electrolyte disturbances, and various medications [7],
[8]. The mechanism of prolonged QTc is related to
changes in ion channels and intracellular potassium
concentrations, leading to asynchronous early
depolarization and repolarization. Additionally,
structural changes in myocardial cells and the
conduction system may also play a role in abnormal
repolarization, contributing to the prolongation
of the QTc interval. It is known that prolonged QTc,
particularly during the repolarization phase, can
lead to dangerous ventricular arrhythmias, such as
torsades de pointes and ventricular fibrillation, which
can be life-threatening [9].
In our study, the rate of prolonged QTc in
hypertensive patients admitted to the Department
of Cardiology at the University of Medicine and
Pharmacy Hospital in Hue was 30.8%, with the mean
QTc values in Group 1 (patients with prolonged QTc)
and Group 2 (patients with normal QTc) being 489.02
± 28.99 and 428.57 ± 20.54, respectively (Table 2). Our
results showed a higher rate of 30.8% compared to the
28.3% rate found in the study by Karaye conducted on
the Nigerian population in 2011 [4]. This difference
may be attributed to regional and ethnic disparities.
Furthermore, cardiovascular disease characteristics
are often closely related to metabolism and lifestyle,
meaning that the rates observed in such studies may
vary depending on the time of study (2021 versus
2011).
According to a study by Guo-Zhe Sun et al. ( 2019),
conducted on 10533 residents aged 35 and older in
Liaoning Province, China, the incidence of prolonged
QTc in hypertensive patients was significantly
higher than in those with normal blood pressure,
with similar results across all subgroups by gender
and left ventricular wall thickness (p<0.001) [10].
Interestingly, our results were quite similar to those
found in a population study conducted by Qun Ma et
al. in Liaoning, China, from 2012-2013, where 31.6%
of 11209 participants aged over 35 had prolonged
QTc [11]. However, this rate was much lower than
that found in other studies focusing on hypertensive
patients. Specifically, a study by Adeseye et al. in 2012
found that 52.14% of newly diagnosed hypertensive
patients in Nigeria had a maximum QTc > 440ms [12].
More recently, a 2022 study by Sathiyanarayanan et
al. found that 52.5% of participants had prolonged
QTc, with 59.0% in the poorly controlled hypertension
group and 37.5% in the well-controlled group [13].
This is higher than the 30.8% found in our study. This
HUE JOURNAL OF MEDICINE AND PHARMACY ISSN 3030-4318; eISSN: 3030-4326 201
Hue Journal of Medicine and Pharmacy, Volume 14, No.6/2024
discrepancy could be explained by the smaller sample
size in our study, as well as potential differences
in the population and geographic location of the
participants. Therefore, a larger nationwide study
is necessary to accurately assess the prevalence of
prolonged QTc in hypertensive patients, a chronic
condition that is very common in Vietnam.
In comparison with the study by Sun et al. (2019),
the mean corrected QT (QTc) values and the rate of
prolonged QTc across gender, hypertension status,
and left ventricular hypertrophy can be seen in the
chart below [10].
Figure 2. Mean corrected QT (QTc) values and the rate of prolonged QTc occurrence by gender,
hypertension status, and left ventricular hypertrophy [10]
4.2. The Relationship and Correlation Between
Prolonged QTc and Echocardiographic Parameters in
Hypertensive Patients
Our study results (Table 3) show that when
comparing the two groups, the mean values of
left atrial diameter (LA), left ventricular ejection
fraction (EF), left ventricular systolic diameter (Ds),
end-systolic volume (ESV), end-diastolic volume
(EDV), fractional shortening (FS), and left ventricular
mass index (LVMI) showed statistically significant
differences with p<0.05. However, there were no
significant differences in the mean values of left
ventricular diastolic diameter (Dd). This suggests that
in hypertensive patients with prolonged QTc, there is
an impact on left ventricular function.
We observed a moderate inverse correlation
between QTc and EF, FS (p<0.001), a moderate
positive correlation between QTc and ESV (p<0.001),
and a weak positive correlation between QTc and Ds
(p=0.006).
The study by Kang Y.J. et al. (2006) showed that left
ventricular hypertrophy (LVH) affects heart function,
as well as cardiovascular morbidity and mortality [14].
In our study, 92 out of 133 patients (69.17%) had left
ventricular hypertrophy, which is consistent with other
studies showing a statistically significant correlation
between QTc and left ventricular hypertrophy in
hypertensive patients. Left ventricular hypertrophy is
defined as an LVMI > 95 g/m² in females and > 115 g/
m² in males [15].
The results showed that in the group with left
ventricular hypertrophy, EF and FS were lower in the
prolonged QTc group compared to the normal QTc
group, with statistical significance (p<0.001). However,
no such difference was found in the hypertensive
group without left ventricular hypertrophy (Table 4).
This can be explained by the fact that left ventricular
hypertrophy is a response of the heart to hypertension
and LVH has significant effects on the pathophysiology
of prolonged QTc [16].
Our study also noted a relationship between
prolonged QTc and heart failure symptoms, such as
tachycardia, edema, and dyspnea, compared to the
normal QTc group, with p<0.05. This result is similar
to the study by KM Karaye conducted on the Nigerian
population [4].
5. CONCLUSION
In the study of 133 hypertensive patients, 30.8%
had prolonged QTc. The QTc interval showed a