CÔNG NGHỆ https://jst-haui.vn
Tạp chí Khoa học và Công nghệ Trường Đại học Công nghiệp Hà Nội Tập 61 - Số 1 (01/2025)
110
KHOA H
ỌC
P
-
ISSN 1859
-
3585
-
ISSN 2615
-
961
9
A SIMULATION STUDY ON COMBUSTION CHARACTERISTICS
OF A SPARK IGNITION ENGINE WITH DIFFERENT FUELS:
GASOLINE, LPG, CNG, AND BIOGAS
NGHIÊN CỨU MÔ PHỎNG DIỄN BIẾN QUÁ TRÌNH CHÁY ĐỘNG CƠ ĐÁNH LỬA CƯỠNG BỨC
KHI SỬ DỤNG NHIÊN LIỆU XĂNG, LPG, CNG VÀ BIOGAS
Vu Minh Dien1, Nguyen Phi Truong1,*, Nguyen Huy Chien1,
Dang Van Binh1, Duong Minh Phuc1, Trinh Xuan Phong2
DOI: http://doi.org/10.57001/huih5804.2025.017
ABSTRACT
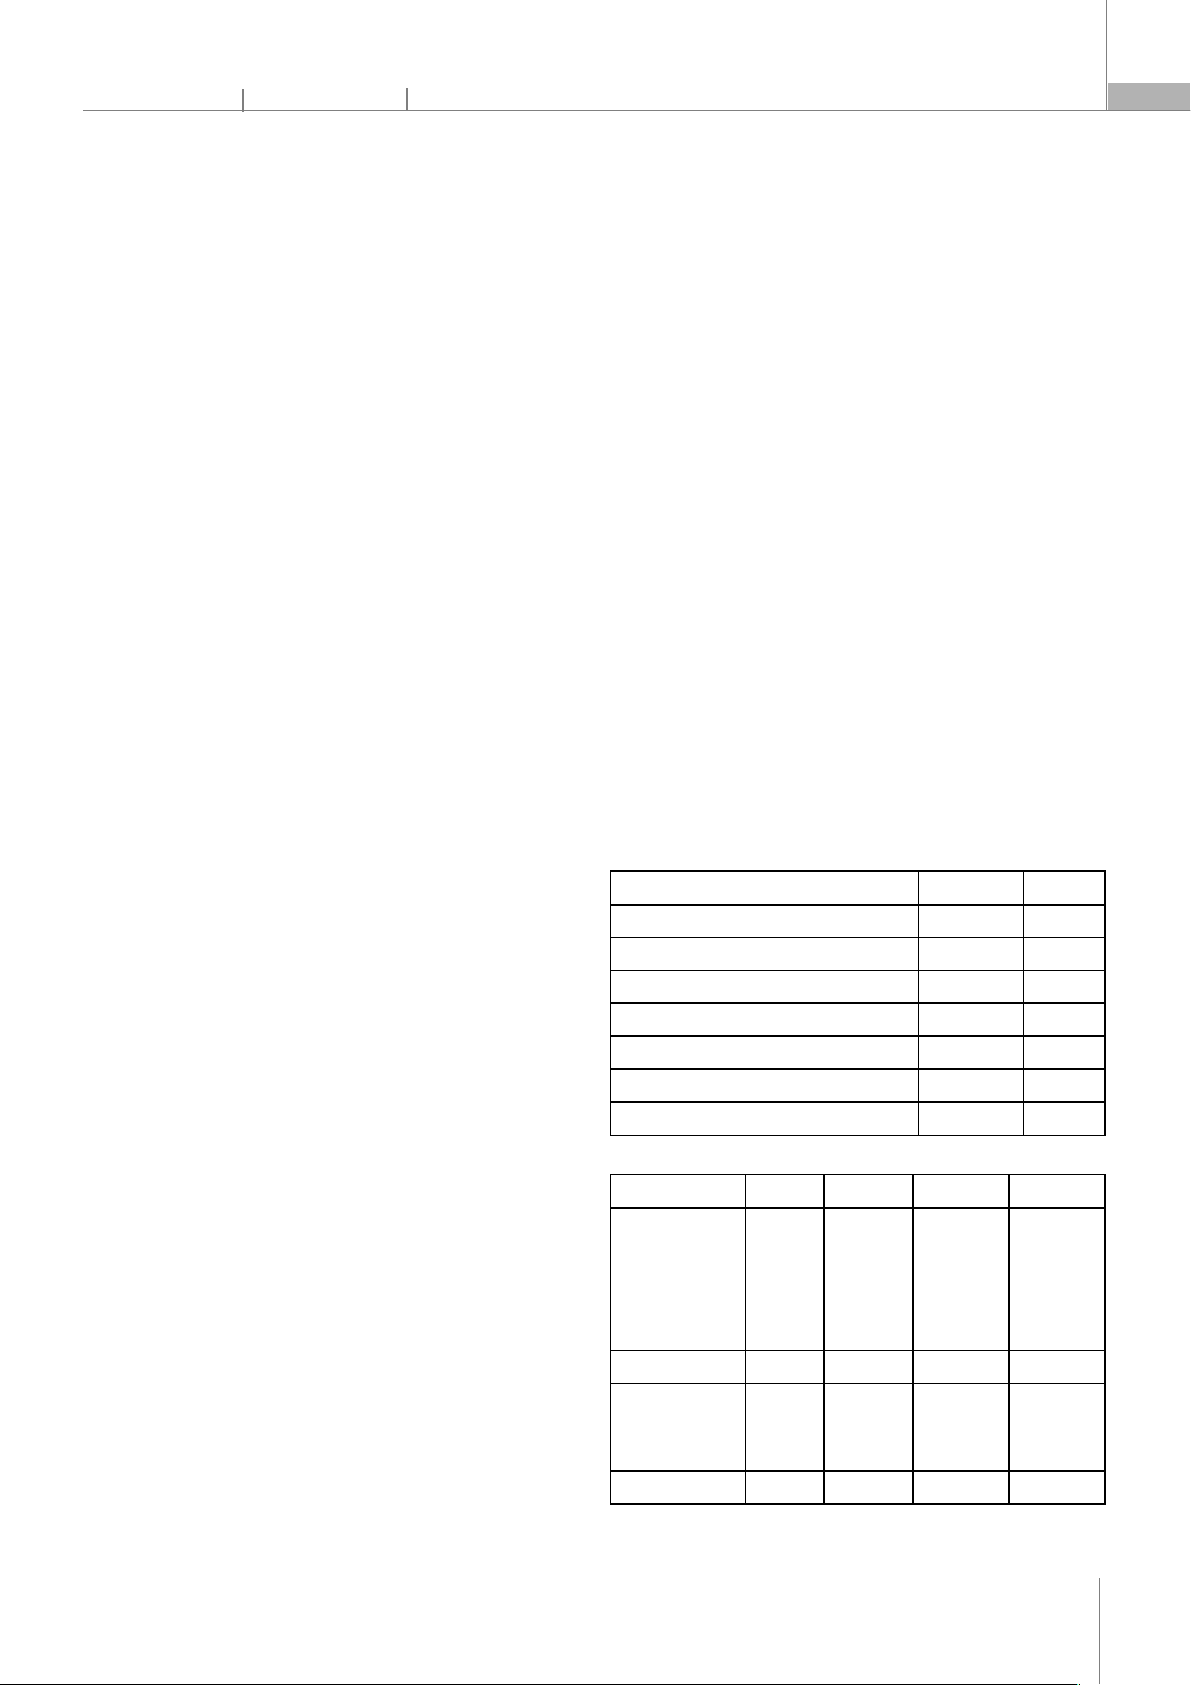
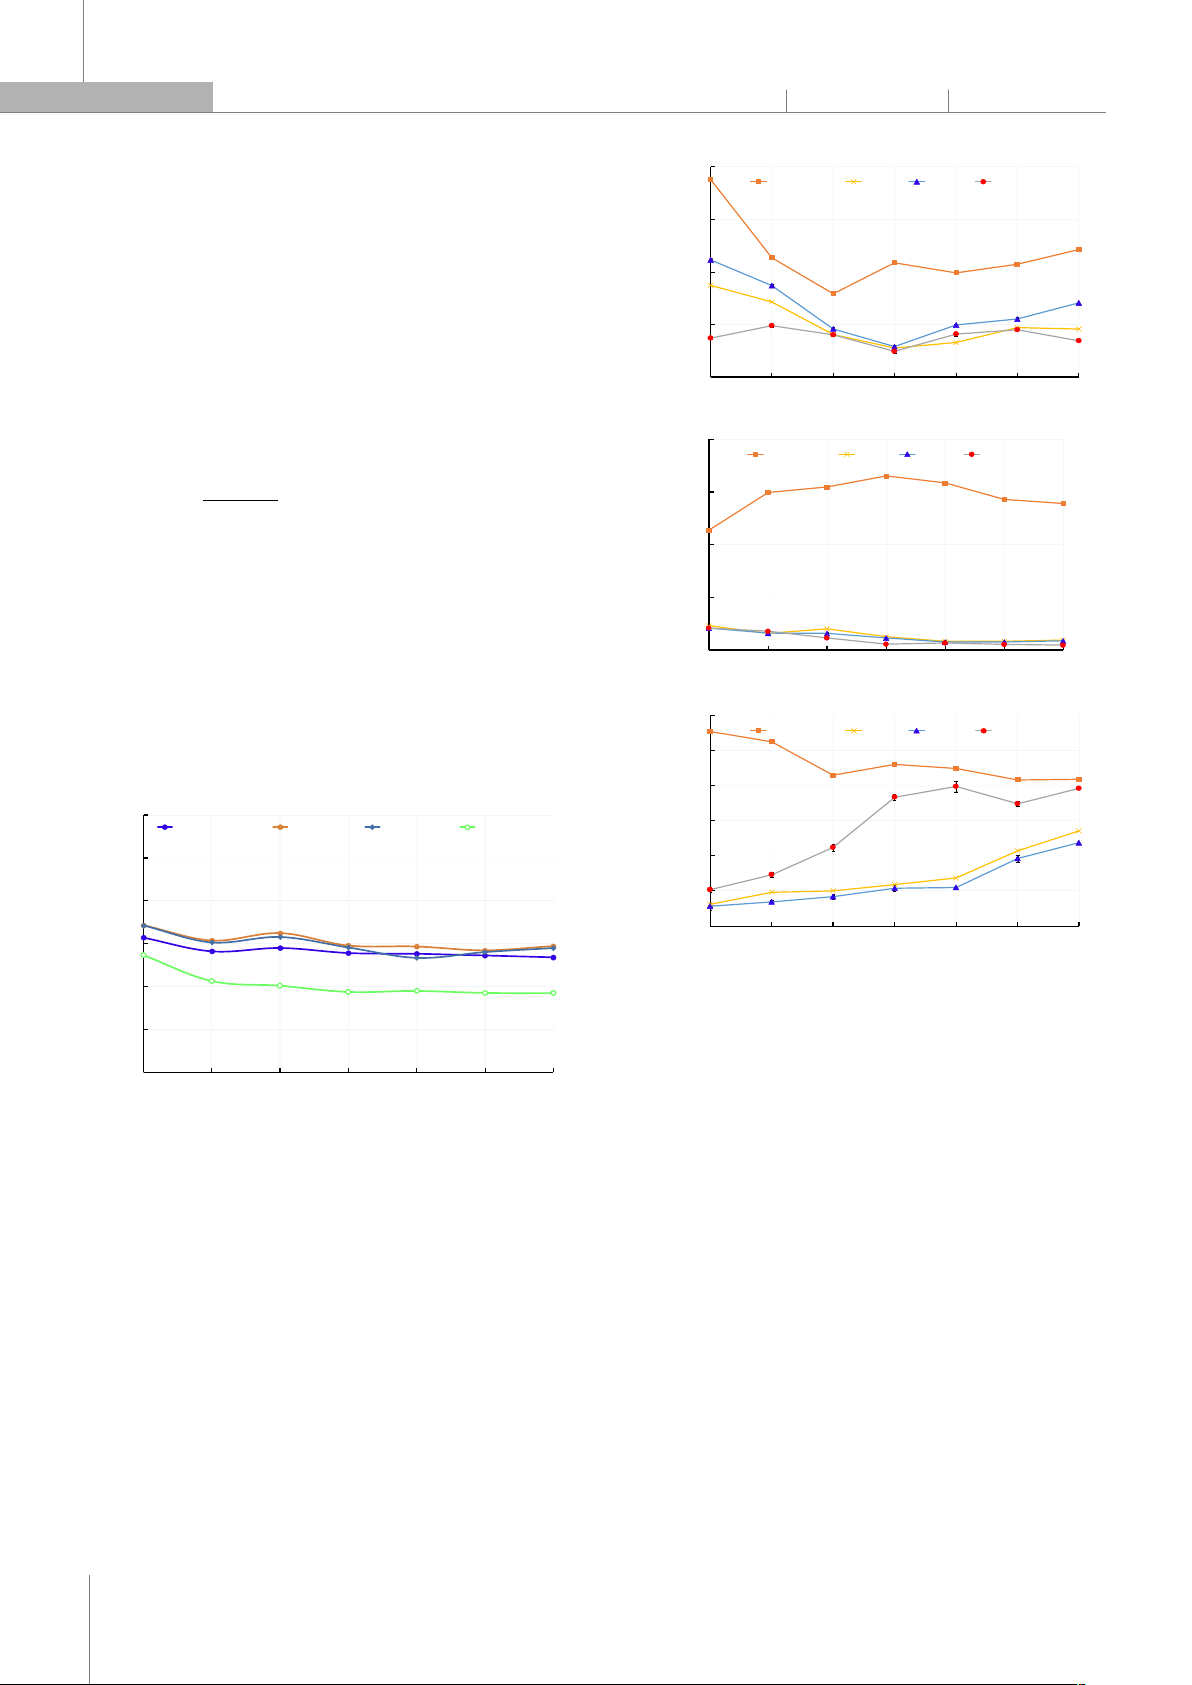
This paper presents a simulation investigation of the combustion characteristics, performance, and emission of a spark igniti
on engine fueled with gasoline,
liquified petroleum gas (LPG), compressed natural gas (CNG), and biogas. The simulation was conduct
ed on the advanced software AVL Boost. The engine model
was customed with different fuels in the simulation, but the air excess ratio (λ) was kept the same at 1.0. The difference in
fuel properties contributed to a later
combustion process for LPG, CNG, and biogas-fueled engines. The peak in-
cylinder pressure was 77.7; 62.9; 68.9 and 32.2bar for gasoline, LPG, CNG, and biogas.
The study's results indicated that the test engine's brake power decreased by up to 22.63; 17.22; and 39.10% on average
for LPG, CNG, and biogas. However, the
brake-specific energy consumption (BSEC) increased by 5.50 and 8.12% when fueled by LPG and CNG; and reduced by 27.4% for the bioag-
fueled engine.
Nevertheless, the exhaust emissions of the test engine that is powered by gaseous fuels significantly decreased. NOx
emissions decrease by 45.04; 56.75 and
66.75% on average for LPG, CNG, and biogas fuel. The average CO level of the engine when fueling with LPG, CNG, and biogas wa
s reduced by 91.44; 90.51 and
93.01%. The HC emission of the engine that LPG and CNG powere
d is considerably lower than that of the original engine, in turn, 73.72% and 69.29% on average,
while a reduction of 39.22% was observed for biogas-fueled engines on average.
Keywords: LPG, CNG, biogas, gasoline.
TÓM TẮT
Bài báo trình bày kết quả nghiên cứu mô phỏng quá trình cháy và tính năng kinh tế, kỹ thuật của động cơ đánh lửa cưỡng bức sử dụng nhiên liệ
u xăng, khí
hóa lỏng LPG, khí thiên nhiên nén CNG và khí sinh học biogas. Quá trình nghiên cứu thực hiện trên công cụ mô phỏng AVL Boost. Động cơ được mô phỏng ở ch
ế
độ toàn tải sử dụng các nhiên liệu khác nhau với tỷ lệ hòa trộn được duy trì ở hệ số dư lượng không khí bằng 1,0. Kết quả cho thấy, sự khác biệt về tính chất củ
a
nhiên liệu làm quá trình cháy có xu hướng muộn hơn khi sử dụng LPG, CNG và biogas so với xăng. Áp suất cực đại bên trong xylanh lần lượt đạ
t 77,7; 62,9; 68,9
32,2bar đối với xăng, LPG, CNG và biogas. Công suất có ích của động cơ đặc tính ngoài giảm trung bình 22,63; 17,22 39,10% khi động cơ s
dụng LPG,
CNG và biogas. Suất tiêu hao năng lượng BSEC có xu hướng tăng trung bình 5,5% và 8,12% khi sử dụng LPG và CNG. Tuy nhiên đối với trư
ờng hợp sử dụng biogas,
BSEC lại có xu hướng giảm 27,4% so với trường hợp sử dụng nhiên liệu xăng. Các thành phần phát thải của động cơ có xu hướng giảm khi sử dụng nhiên li
ệu khí
so với nhiên liệu xăng truyền thống. Phát thải NOx giảm 45,04%, 56,75% và 66,75%; CO giảm 91,44; 90,51 và 93,01%; HC giảm 73,72; 69,29 và 39,22% khi s
dụng LPG, CNG và biogas.
Từ khóa: LPG, CNG, khí sinh học, nhiên liệu xăng.
1Hanoi University of Industry, Vietnam
2Nam Dinh University of Technology Education, Vietnam
*Email: truongnp@haui.edu.vn
Received: 06/9/2024
Revised: 19/11/2024
Accepted: 26/01/2025
P-ISSN 1859-3585 E-ISSN 2615-9619 https://jst-haui.vn SCIENCE - TECHNOLOGY
Vol. 61 - No. 1 (Jan 2025) HaUI Journal of Science and Technology 111
1. INTRODUCTION
Numerous studies show that developing nations' top
priority is reducing air pollution from motorized
transportation. Researchers have increasingly focused on
replacing fossil fuels like petrol and diesel oil with other
energy sources. Alternative fuels have been tested in new
and old automobiles in Vietnam. Biodiesel [1], liquefied
petroleum gas [2], natural gas (NG) [3], and biogas [4]
have advanced in the country due to significant research
on their use in vehicles.
Alternative fuels for internal combustion engines,
such as NG, with its main component of CH4, may replace
traditional energy sources. These gaseous fuels may
minimize diesel engine NOx, soot, and greenhouse gas
emissions [5]. Since CH4 has a higher H/C ratio than
gasoline [6], CO and CO2 pollutants are minimized. Biogas
improves engine combustion due to uniform air quality.
This may improve combustion and lower HC emissions.
Gas engines produce less HC than petrol engines due to
limited fuel absorption/desorption from lubricating oil
and cylinder walls, especially in cold starts [7]. Besides,
LPG (Liquefied Petroleum Gas), which consists of butane
(C4H10) and propane (C3H8) has been used as a fuel or duel
fuel in engines. P.R. Chitragar et al. conducted an
experimental investigation to investigate the
combustion and emission of a 4-stroke gasoline engine
that operates on LPG. It was discovered that the toxic
emissions of CO, HC, and NOx were reduced in LPG at
stationary compared to gasoline [8]. Gaseous fuel can
work without knocking due to its wide combustion limit
and high RON. Hosmath observed that CH4's higher RON
index than petrol allows the engine to run at a higher
compression ratio without detonation and enhance
thermal efficiency. Biogas is also used as fuel in both S.I.
engines and dual fuel in diesel engines. Biogas contains
almost CH4 (around 65% and CO2 (around 33%) and other
gas). A high RON index and slow combustion rate prolong
combustion and lower thermal efficiency of a biogas-
fueled engine [9].
Researchers found that natural gas-fueled engines
converted from petrol engines function badly,
notwithstanding emission reduction. Adding natural gas
reduces charged air at the end of the intake stroke,
lowering engine power. Yontar & Doğu (2018) found that
using pure CH4 fuel in dual-fuel CNG-gasoline spark
ignition (S.I) engines reduced volumetric efficiency by
10%, resulting in inferior engine performance compared
to petrol engines [10]. Even with improved ignition
timing, mixing CH4 with external gasoline lowered brake
mean effective pressure by 16% [11]. Due to its high CO2
content, biogas fuel has a lower heating value of
23,400kJ/m3 [9], reducing engine power.
A simulation study was done to determine the
affected engine performance and emissions of an S.I.
engine fueled with different kinds of fuels, including
conventional gasoline, CNG, LPG, and biogas (65% CH4
and 35% CO2). Advanced modeling software AVL-Boost
evaluates in-cylinder pressure and temperature, as well as
the rate of heat release (RHR) of the engine with fuels.
2. MATERIAL AND METHOD
2.1. Studying procedure
The engine was selected and then converted to run on
either gasoline or gas fuel. In addition, a water electrolysis
distillation was equipped to supply HHO to the test
engine.
2.2. Fuel and engine specification
This study simulated a 4-cylinder, inline, multi-port
injection engine. The first fuel was conventional gasoline.
Table 1 lists the test engine's primary parameters. Table 2
presents the main characteristics of fuels obtained from
the literature.
Table 1. The main parameters of the test engine
Parameters Symbol Value
Branch and model (-) 1NZ-FE -
Bore x Stroke (mm) SxD 84.7x75
Cylinder (-) I 4
Max power output (kW) at 6000rpm Ne 80
Max torque output (Nm) at 4200rpm Me max 140
Minimum fuel consumption (g/kWh) ge 220
Compression ratio (-) 10.5:1
Table 2. The main characteristics of fuels [12-14]
Characteristics Gasoline LPG CNG Biogas
Composition C85H15
50% C3H8
and
50%C4H10
95% CH4 and
other
impurified
components
65% CH4,
34% CO2, and
other
impurified
components
Octane number 92.4 106 120 130
Latent heat of
vaporization
(kJ/kg)
270 795 508
244
Density (kg/m3) 730 550 1.21
CÔNG NGHỆ https://jst-haui.vn
Tạp chí Khoa học và Công nghệ Trường Đại học Công nghiệp Hà Nội Tập 61 - Số 1 (01/2025)
112
KHOA H
ỌC
P
-
ISSN 1859
-
3585
-
ISSN 2615
-
961
9
LHV (MJ/kg) 44 46 50 23,600
Combustion rate
(m/s) 0.43 0.40 0.38 0.25
Combustion
temperature (K) 2266 2240 2227
H/C Ratio 1/5.7 1/2.0 1/3 -
A/F Ratio 14.7 15.6 17.0 6.05
Physical State Liquid Pressurized
Liquid
Compressed
gas
Gas
2.3. Model development
The use of AVL Boost commercial software created the
simulation model, as shown in Fig. 1. Model-building
includes model construction, governing equation
selection, and initialization data. Engine pressure cycles
are estimated using the first thermodynamic rule. This
problem requires a combustion model, wall heat transfer
model, and gas characteristics as a function of pressure,
temperature, and mixture composition [15].
Figure 1. Simulation model of the 1NZFE engine
SB: System boundary; CL: Air cleaner; I: Injectors; C: Cylinder; PF: Plenum;
MP: Measurement points; R: Restrictor; J: Conjuntions
2.4. Simulation procedure
The developed model first ran a fully open throttle
with speeds ranging from 1500 to 4500rpm at 500rpm
intervals. The simulated results of brake power and fuel
consumption of an engine fueled with gasoline were
used to validate the developed model. Then, the
developed model was used to simulate another kind of
fuel. In the simulation process, the air excess ratio was
maintained at 1.0 for any kind of fuel.
3. RESULTS AND DISCUSSION
3.1. Model validation
Fig. 2a shows the variation of brake mean effective
pressure (BMEP) as a function of simulated cycles at a
constant speed of 4200rpm and fully opened throttle
with conventional gasoline fuel. Over the initial cycles
before coverage at simulation cycle 60, BMEP fluctuates
by less than 0.01%. Fig. 2b validates the full-load model
by comparing actual and simulated data. The output
power (Ne), torque (Me), and brake-specific fuel
consumption (BSFC) modeling data match the actual. The
simulated Ne and BSFC curves deviated by 2.23% and
3.41% on average from experimental values, confirming
that the experiment and simulation agree well.
Figure 2. Comparison of engine performance obtained from simulation
and vendor
3.2. In-cylinder pressure
For gasoline and gaseous fuel simulations, the lambda
ratio was kept constant at 1.0, and the ignition time
changed to maximize brake torque (MBT). Fig. 3
compares in-cylinder pressure profiles at maximum
power and 4200rpm. Due to its higher RON, lower
heating value, and flame speed of gaseous fuel, gas-
fueled engines have lower peak in-cylinder pressure than
the original gasoline engine. The peak pressure was
77.7bar at a crank angle (CA) of 370, 62.9 bar at CA of 372,
6.80
6.85
6.90
6.95
7.00
7.05
0 10 20 30 40
BMEP (bar)
Simulated cycles (-)
(a)
4200 rpm, fully opened throttle
250
275
300
325
350
375
400
425
450
475
500
0
30
60
90
120
150
1000 1500 2000 2500 3000 3500 4000 4500 5000
ge (g/kWh)
Ne (kW), Me (Nm)
Speed (rpm)
Ne-ex Ne-si Me-si
Me-ex ge-ex ge-si
g
e
N
e
M
e
(b)
P-ISSN 1859-3585 E-ISSN 2615-9619 https://jst-haui.vn SCIENCE - TECHNOLOGY
Vol. 61 - No. 1 (Jan 2025) HaUI Journal of Science and Technology 113
68.9bar at CA of 372, and 32.2bar at CA of 374 for gasoline,
LPG, CNG, and biogas.
Figure 3. Simulation comparison of in-cylinder pressure with different fuels
Figure 4. Simulation comparison of pressure rise with different fuels
AVL Boost predicts pressure rise as a function of crank
angle based on heat release. Conventional gasoline fuel
increases engine pressure by 2.98bar/deg, while peak
pressure increases it by 2.67bar/deg, 2.45bar/deg, and
0.78bar/deg for LPG, CNG, and biogas.
3.3. In-cylinder temperature
Figure 5. Simulation comparison of in-cylinder temperature with different
fuels
As illustrated in Fig. 5, the combustion process is
inclined to migrate to the right, indicating that it is more
delayed when the engine is operated with gaseous fuel
than a conventional engine, especially for biogas-fueled
engines. The peak temperature of the original gasoline
was 2791K at a CA of 373, while for LPG, CNG, and biogas
engines, peak temperatures were approximately 2752K
at CA 375, 2788K at CA 373, and 1994K at CA 400. This
suggests that the biogas engine's expansion stroke was
substantially delayed, resulting in an increase in heat loss
through the cylinder wall.
3.4. Combustion characteristics
Figure 6. Simulation comparison of RHR with different fuels
For maximum torque condition, Fig. 6 compares
combustion parameters RHR in the cylinders for different
fuels. It is clear that the use of gaseous fuel results in a
longer combustion process. The RHR patterns differ
dramatically around the top dead center. RHR peaks at
78.8J/deg at CA 366, 72.1J/deg at CA 368, 67.1J/deg at CA
365, and 20.9J/deg at CA 386 for gasoline, LPG, CNG, and
biogas engines.
3.5. Engine brake power and energy consumption
Figure 7. Simulation comparison of brake power with different fuels
The experimental comparison of the engine
performance curves as a function of the engine speeds
when the engine is operating at maximum load on
either gasoline or gaseous fuels is illustrated in Fig. 7.
The brake power of the test engine decreased by an
average of 22.63%, 17.22%, and 39.10% when LPG, CNG,
0
1,000,000
2,000,000
3,000,000
4,000,000
5,000,000
6,000,000
7,000,000
8,000,000
9,000,000
300 320 340 360 380 400 420
In-cylinder pressure (Pa)
Crank angle (deg)
P_Gasoline (Pa)
P_LPG (Pa)
P_CNG (Pa)
P_Biogas (Pa)
-300,000
-200,000
-100,000
0
100,000
200,000
300,000
400,000
300 320 340 360 380 400 420
In-cylinder pressure rise (Pa)
Crank angle (deg)
ΔP_Gasoline (Pa)
ΔP_LPG (Pa)
ΔP_CNG (Pa)
ΔP_Biogas (Pa)
0
500
1,000
1,500
2,000
2,500
3,000
300 320 340 360 380 400 420
In-cylinder temperature (K)
Crank angle (deg)
T_Gasoline (K)
T_LPG (K)
T_CNG (K)
T_Biogas (K)
-10
0
10
20
30
40
50
60
70
80
90
300 320 340 360 380 400 420
Rate of Heat release (J/deg)
Crank angle (deg)
R_Gasoline (J/deg)
R_LPG (J/deg)
R_CNG (J/deg)
R_Biogas (J/deg)
0
10
20
30
40
50
60
1500 2000 2500 3000 3500 4000 4500
Brake power (kW)
Speed (rpm)
Ne-gasoline Ne-LPG Ne-CNG Ne-Biogas
Full throttle posistion
CÔNG NGHỆ https://jst-haui.vn
Tạp chí Khoa học và Công nghệ Trường Đại học Công nghiệp Hà Nội Tập 61 - Số 1 (01/2025)
114
KHOA H
ỌC
P
-
ISSN 1859
-
3585
-
ISSN 2615
-
961
9
and biogas were used. This is a result of the lower
heating value and reduction of the intake mixture
caused by gas in the intake manifold. Moreover, as
discussed above, the engine efficiency may be reduced
because of an extended expansion stroke in gaseous-
fueled engines that contributes to high heat loss
through the cylinder wall.
This study employs brake-specific energy
consumption (BSEC) instead of BSFC since energy input
differs. The BSEC is calculated using the following
equation (1).
BSEC
=
m
LHV
Ne
=
BSFC
LHV
(1)
Where: m is the mass flow of fuel (kg/h), LHV is the
lower heating value of fuel, and Ne is the brake power
(kW).
Compared to gasoline, the average specific energy
consumption (BSEC) of the test engine operating on LPG
and CNG increased by 5.50% and 8.12%, as illustrated in
Fig. 8. However, for biogas-fueled engines, the BSEC was
reduced by 27.4% despite a remarkable brake power
degradation.
Figure 8. Simulation comparison of BSEC with different fuels
3.6. Engine emission
CO, NOx and HC are among the pollutants that
emanate from S.I. engines. The used fuel is not burned
completely, resulting in the formation of CO emissions.
NOx, are the outcome of the reactions between nitrogen
and oxygen atoms in high-pressure and high-
temperature environments. HC emissions are the result of
incomplete fuel combustion, unburned hydrocarbons
from crevices, and the absorption and desorption of fuel
by lubricating oil coatings and camshaft overlap duration.
Fig. 9 shows the comparison of emissions of engines
fueled with different fuels.
Figure 9. Simulation comparison of emissions with different fuels
The simulation was conducted at full load conditions
as the throttle was in the fully opened position, and the
air excess ratio was at the stoichiometric condition of 1.0
for all fuels. As shown in Fig. 9a, the formation of NOx is
contingent upon the combustion temperature, as
evidenced by numerous studies that reported a
significant reduction of approximately 45.04%, 56.75%,
and 66.75% on average for LPG, CNG, and biogas fuel.
This finding is consistent with Yujun's conclusion [16].
The most significant distinction between gaseous fuel
and petroleum is the lower carbon content, which
contributes to a remarkable CO level drop. The average
CO level of the engine when fueling with LPG, CNG, and
biogas was reduced by 91.44%, 90.51%, and 93.01%. The
HC emission of the engine that is powered by LPG and
CNG is considerably lower than that of the original
engine, in turn 73.72% and 69.29% on average.
Meanwhile, the HC level is reduced by 39.22% for biogas-
0
5
10
15
20
25
30
1500 2000 2500 3000 3500 4000 4500
BSEC (MJ/kWh)
Speed (rpm)
BSEC-gasoline BSEC-LPG BSEC-CNG BSEC-Biogas
Full throttle posistion
0
1,000
2,000
3,000
4,000
1500 2000 2500 3000 3500 4000 4500
NOx emission (ppm)
Engine speed (rpm)
Gasoline LPG CNG Biogas
(a)
0
10,000
20,000
30,000
40,000
1500 2000 2500 3000 3500 4000 4500
CO (ppm)
Engine speed (rpm)
Gasoline LPG CNG Biogas
(b)
0
300
600
900
1,200
1,500
1,800
1500 2000 2500 3000 3500 4000 4500
HC (ppm)
Engine speed (rpm)
Gasoline LPG CNG Biogas
(c)