
RESEARCH Open Access
CYP1A1 MspI and exon7 gene polymorphisms
and lung cancer risk: An updated meta-analysis
and review
Ping Zhan
1†
, Qin Wang
2†
, Qian Qian
1
, Shu-Zhen Wei
3
and Li-Ke Yu
1*
Abstract
Background: Many studies have examined the association between the CYP1A1 MspI and exon 7 gene
polymorphisms and lung cancer risk in various populations, but their results have been inconsistent.
Methods: To assess this relationship more precisely, a meta-analysis and review were performed. The PubMed,
Embase, Web of Science, and CNKI database was searched for case-control studies published up to June 2010.
Data were extracted and pooled odds ratios (OR) with 95% confidence intervals (CI) were calculated.
Results: Ultimately, 64 studies, comprising 18,397 subjects from 49 case-control studies of the MspI genotype and
18,518 patients from 40 case-control studies of the exon 7 genotype, were included. A significantly elevated lung
cancer risk was associated with 2 MspI genotype variants (for type C vs Type A: OR = 1.26, 95% CI = 1.12-1.42; for types
B and C combined vs Type A: OR = 1.20, 95% CI = 1.13-1.28) in overall population. In the stratified analysis, a significant
association was found in Asians, Caucasians, lung SCC, lung AC and Male population, not in mixed population, lung
SCLC and Female population. However, inconsistent results were observed for CYP1A1 exon7 in our meta-analysis, two
variants of the exon 7 polymorphism were associated with a significantly higher risk for lung cancer (for Val/Val vs Ile/Ile:
OR = 1.24, 95% CI = 1.09-1.42; for (Ile/Val +Val/Val) vs Ile/Ile: OR = 1.15, 95% CI = 1.07-1.24) in overall population. In the
stratified analysis, a significant assocation was found in Asians, Caucasians, lung SCC and Female population, not in
mixed population, lung AD, lung SCLC and Male population. Additionally, a significant association was found in smoker
population and not found in non-smoker populations for CYP1A1 MspI and exon7 gene.
Conclusions: This meta-analysis suggests that the MspI and exon 7 polymorphisms of CYP1A1 correlate with
increased lung cancer susceptibility and there is an interaction between two genotypes of CYP1A1 polymorphism
and smoking, but these associations vary in different ethnic populations, histological types of lung caner and
gender of case and control population.
Keywords: CYP1A1, Polymorphism, Lung cancer, Susceptibility, Meta-analysis
1. Introduction
Lung cancer remains the most lethal cancer worldwide,
despite improvements in diagnostic and therapeutic tech-
niques [1]. Its incidence has not peaked in many parts of
world, particularly in China, which has become a major
public health challenge all the world [2]. The mechanism
of lung carcinogenesis is not understood. Although
cigarette smoking is the major cause of lung cancer, not
all smokers develop lung cancer [3], which suggests that
other causes such as genetic susceptibility might contri-
bute to the variation in individual lung cancer risk [4,5].
Many environmental carcinogens require metabolic acti-
vation by drug-metabolizing enzymes. In recent years,
several common low-penetrance genes have been impli-
cated as potential lung cancer susceptibility genes.
Cytochrome P450 1A1 (CYP1A1) metabolizes several
suspected procarcinogens, particularly polycyclic aromatic
hydrocarbons (PAHs), into highly reactive intermediates
[6]. These compounds bind to DNA to form adducts,
* Correspondence: yulike_nanjing@163.com
†Contributed equally
1
First Department of Respiratory Medicine, Nanjing Chest Hospital, 215
Guangzhou Road, Nanjing 210029, China
Full list of author information is available at the end of the article
Zhan et al.Journal of Experimental & Clinical Cancer Research 2011, 30:99
http://www.jeccr.com/content/30/1/99
© 2011 Zhan et al; licensee BioMed Central Ltd. This is an Open Access article distributed under the terms of the Creative Commons
Attribution License (http://creativecommons.org/licenses/by/2.0), which permits unrestricted use, distribution, and reproduction in
any medium, provided the original work is properly cited.

which, if unrepaired, can initiate or accelerate carcinogen-
esis. Although PAHs are ubiquitous in the environment,
notable sources of exposure that cause the greatest con-
cern include smoking, air pollution, diet, and certain occu-
pations [7]. Two functionally important nonsynonymous
polymorphisms have been described for the CYP1A1
gene, a base substitution at codon 462 in exon 7, resulting
in substitution of isoleucine with valine (Ile462Val (exon
7)) (National Center for Biotechnology Information single
nucleotide polymorphism(SNP) identifier rs1048943;
adenine (A) to guanine (G) substitution at nucleotide 2455
(2455A.G)) and a point mutation (thymine (T) to cytosine
(C)) at the MspI site in the 3’-untranslated region
(rs4646903;3801T.C) [8]. The MspI restriction site poly-
morphism resulted in three genotypes: a predominant
homozygous m1 allele without the MspI site (genotype A),
the heterozygote (genotype B), and a homozygous rare m2
allele with the MspI site (genotype C). The exon 7 restric-
tion site polymorphism resulted in three genotypes: a pre-
dominant homozygous (Ile/Ile), the heterozygote (Ile/Val),
and the rare homozygous(Val/Val).
An association between CYP1A1 polymorphisms and
lung cancer was first reported by Kawajiri and co-workers
in 1990 among an Asian study population (Febs Lett
1990;263:131-133)[9], after which many studies analyzed
the influence of CYP1A1 polymorphisms on lung cancer
risk; no clear consensus, however, was reached. Moreover,
3 meta-analyses have reported conflicting results. Houl-
ston RS [10] found no statistically significant association
between the MspI polymorphism and lung cancer risk in
2000,inameta-analysisperformedbyLeMarchandL
et al. [11] included only 11 studies, the exon 7 polymorph-
ism did not correlate with lung cancer risk. Shi × [12],
however, noted a greater risk of lung cancer for CYP1A1
MspI and exon 7 polymorphism carriers in a meta-analysis
that included only Chinese population.
A single study might not be powered sufficiently to
detect a small effect of the polymorphisms on lung cancer,
particularly in relatively small sample sizes. Various types
of study populations and study designs might also have
contributed to these disparate findings. To clarify the
effect of the CYP1A1 polymorphism on the risk for lung
cancer, we performed an updated meta-analysis of all eligi-
ble case-control studies to date and conducted the sub-
group analysis by stratification according to the ethnicity
source, histological types of lung caner, gender and smok-
ing status of case and control population.
2. Materials and methods
2.1 Publication search
We searched for studies in the PubMed, Embase, Web of
Science, and CNKI (China National Knowledge Infrastruc-
ture) electronic databases to include in this meta-analysis,
using the terms “CYP1A1,”“Cytochrome P450 1A1,”
“polymorphism,”and “lung cancer.”An upper date limit
of June, 2010 was applied; no lower date limit was used.
The search was performed without any restrictions on lan-
guage and was focused on studies that had been con-
ducted in humans. We also reviewed the Cochrane
Library for relevant articles. Concurrently, the reference
lists of reviews and retrieved articles were searched manu-
ally. When the same patient population appeared in sev-
eral publications, only the most recent or complete study
was included in this meta-analysis.
2.2 Inclusion criteria
For inclusion, the studies must have met the following
criteria: they (1) evaluated CYP1A1 gene polymorphisms
and lung cancer risk; (2) were case-control studies or
nested-case control study; (3) supplied the number of
individual genotypes for the CYP1A1 MspI and exon 7
polymorphisms in lung cancer cases and controls,
respectively; and (4) demonstrated that the distribution
of genotypes among controls were in Hardy-Weinberg
equilibrium.
2.3 Data extraction
Information was extracted carefully from all eligible
publications independently by 2 authors, based on the
inclusion criteria above. Disagreements were resolved
through a discussion between the 2 authors.
The following data were collected from each study: first
author’s surname, year of publication, ethnicity, total
numbers of cases and controls, and numbers of cases and
controls who harbored the MspI and exon 7 genotypes,
respectively. If data from any category were not reported
in the primary study, the items were designated “not
applicable.”We did not contact the author of the primary
study to request the information. Ethnicities were cate-
gorized as Asian, Caucasian, and mixed. Histological type
of lung cancer was divided to lung squamous carcinoma
(SCC), adenocarcinoma (AC) and small cell lung cancer
(SCLC) in our meta-analysis. The definition of smoking
history is very complicated. The smoking histories
covered different periods if changes in the number of
cigarettes smoked per day or type of tobacco products
occurred. Cigarette types were classified as filtered or
unfiltered commercial products and local traditional
hand-made khii yo and yamuan, both unfiltered. Accord-
ing to the general standards, non-smokers were defined
as subjects who had smoked less than 100 cigarettes in
their lifetime. Although the precise definition of never-
smoking status varied slightly among the studies, the
smoking status was classified as non-smokers (or never
smoker) and smokers (regardless of the extent of smok-
ing) in our meta-analysis. We did not require a minimum
number of patients for a study to be included in our
meta-analysis.
Zhan et al.Journal of Experimental & Clinical Cancer Research 2011, 30:99
http://www.jeccr.com/content/30/1/99
Page 2 of 17

2.4 Statistical analysis
OR (odds ratios) with 95% CIs were used to determine
the strength of association between the CYP1A1MspI
and exon7 polymorphisms and lung cancer risk. We
evaluated this risk with regard to combinations of var-
iants (i.e., type B and type C for MspI and Ile/Val and
Val/Val for exon 7) versus the wild-type homozygotes
(type A for MspI and Ile/Ile for exon 7).
The pooled ORs for the risk were calculated. Subgroup
analyses were performed by ethnicity. Heterogeneity
assumptions were assessed by chi-square-based Q-test
[13]. A P value greater than 0.10 for the Q-test indicated
a lack of heterogeneity among studies, so that the pooled
OR estimate of each study was calculated by the fixed-
effects model (the Mantel-Haenszel method) [14]. Other-
wise, the random-effects model (the DerSimonian and
Laird method) was used [15]. In addition, subgroup ana-
lysis stratified by ethnicity, gender and histological types
of lung caner was also performed.
One-way sensitivity analyses were performed to deter-
mine the stability of the results–each individual study in
the meta-analysis was omitted to reflect the influence of
the individual dataset on the pooled OR [16].
Potential publication biases were estimated by funnel
plot, in which the standard error of log (OR) of each study
was plotted against its log (OR). An asymmetrical plot
suggests a publication bias. Funnel plot asymmetry was
assessed by Egger’s linear regression test, a linear regres-
sion approach that measures the funnel plot asymmetry
on a natural logarithm scale of the OR. The significance of
the intercept was determined by t-test, as suggested by
Egger (P < 0.05 was considered a statistically significant
publication bias) [17].
All calculations were performed using STATA, version
10.0 (Stata Corporation, College Station, TX).
3. Results
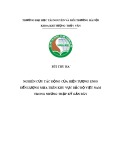
3.1 Study characteristics
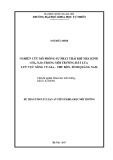
Two hundred and fifty-seven potentially relevant cita-
tions were reviewed, and 64 publications met the inclu-
sion criteria and included in our meta-analysis [9,18-80].
Study search process was shown in Figure 1. Table 1
presents the principal characteristics of these studies.
For the MspI genotype, 49 studies of 7658 lung cancer
cases and 11839 controls were ultimately analyzed. Rai-
mondi’s study [58] sorted the data for Caucasians and
Asians; therefore, each group in the study was consid-
ered separately in the pooled subgroup analyses. For the
exon7 polymorphism, 40 studies of 6067 lung cancer
cases and 12451 controls were analyzed.
Of the 64 publications, 50 were published in English
and 14 were written in Chinese. The sample sizes ran-
ged from 104 to 1824. All cases were histologically
confirmed. The controls were primarily healthy popula-
tions and matched for age, ethnicity, and smoking
status.
There were 26 groups of Asians, 11 groups of Cauca-
sians, and 12 mixed populations for MspI; for exon7, there
were 22 groups of Asians, 10 groups of Caucasians, and 8
mixed populations. All polymorphisms in the control sub-
jects were in Hardy-Weinberg equilibrium.
3.2 Meta-analysis results
3.2.1 Association of CYP1A1 MspI variant with lung cancer
risk
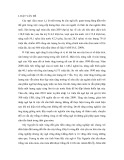
Table 2 lists the primary results. Overall, a significantly
elevated risk of lung cancer was associated with 2 variants
of CYP1A1 MspI (for Type C vs Type A: OR = 1.26, 95%
CI = 1.12-1.42, P= 0.003 for heterogeneity; for types B
and C combined vs Type A: OR = 1.20, 95% CI = 1.13-
1.28, P= 0.000 for heterogeneity) (Figure 2).
In the stratified analysis by ethnicity, significantly
increased risks were observed among Asians for both type
C vs Type A (OR = 1.24, 95% CI = 1.12-1.43; P= 0.004 for
heterogeneity), types B and C combined vs Type A (OR =
1.30, 95% CI = 1.17-1.44; P= 0.002 for heterogeneity). In
Caucasians, there was also significant association in Type
C vs Type A (OR = 1.25; 95% CI = 1.09-1.36; P= 0.052 for
heterogeneity), types B and C combined vs Type A (OR =
1.35; 95% CI = 1.18-1.54; P= 0.046 for heterogeneity).
However, in mixed populations, no significant associations
were observed (Table 2).
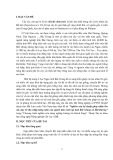
Fourteen [9,19,22,24,26,29,31,32,40,47,53,58,64,78] out
of 64 studies examined the association of CYP1A1 MspI
genotype and the risk of different histological types of lung
cancer including SCC, AC and SCLC. Among lung SCC
and lung AC, significantly increased risks were observed
for both type C vs Type A, types B and C combined vs
Type A. However, among lung SCLC, no significant asso-
ciations were observed for both type C vs Type A (OR =
0.96; 95% CI = 0.70-1.26; P= 0.864 for heterogeneity) or
types B and C combined vs Type A (OR = 1.06; 95% CI =
0.77-1.45; P= 0.976 for heterogeneity) (Figure 3).
Seven [45,56,61,64,74-76] out of 64 studies included
the association of CYP1A1 MspI genotype and lung
caner risk stratified by gender (Male and Female). For
Male population (3 studies), significantly increased risks
were observed for both type C vs Type A (OR = 1.39;
95% CI = 1.23-1.79; P= 0.210 for heterogeneity), types B
and C combined vs Type A (OR = 1.46; 95% CI = 1.07-
1.98; P= 0.380 for heterogeneity). However, for Female
population (7 studies), no significant associations were
observed for both type C vs Type A (OR = 0.92; 95%
CI = 0.84-1.16; P= 0.003 for heterogeneity) or types B
and C combined vs Type A (OR = 0.85; 95% CI = 0.71-
1.02; P= 0.000 for heterogeneity) (Figure 4).
Zhan et al.Journal of Experimental & Clinical Cancer Research 2011, 30:99
http://www.jeccr.com/content/30/1/99
Page 3 of 17

Thirteen [24,31,47,56,59-61,64,72,75,78] out of 64 stu-
dies included the association of CYP1A1 MspI genotype
and lung caner risk stratified by smoking status (non-
smokers or never smokers and smokers). For smokers,
significantly increased risks were observed for both type
C vs Type A (OR = 1. 62; 95% CI = 1.33-1.96; P= 0.000
for heterogeneity), types B and C combined vs Type A
(OR = 1.75; 95% CI = 1.44-2.13; P= 0.003 for heteroge-
neity). However, for non-smokers, no significant associa-
tions were observed for both type C vs Type A (OR =
1.18; 95% CI = 0.96-1.186; P= 0.086 for heterogeneity)
or types B and C combined vs Type A (OR = 1.09; 95%
CI = 0.90-1.33; P= 0.114 for heterogeneity) (Figure 5).
3.2.2 Association of CYP1A1 exon7 variant with lung cancer
risk
For all studies in the meta-analysis, the genotype, an
increased risk for lung cancer was associated with 2 exon7
variants (for Val/Val vs Ile/Ile: OR = 1.24, 95% CI = 1.09-
1.42, P= 0.004 for heterogeneity; for Ile/Val and Val/Val
combined vs Ile/Ile: OR = 1.15, 95% CI = 1.07-1.24, P=
0.000 for heterogeneity) (Figure 6).
In the stratified analysis by ethnicity, the risk was higher
in Asian carriers of Val/Val vs Ile/Ile (OR = 1.22, 95%
CI = 1.16-1.59; P= 0.016 for heterogeneity), Ile/Val and
Val/Val combined vs Ile/Ile (OR = 1.21, 95% CI = 1.09-
1.34; P= 0.000 for heterogeneity). A significant association
Figure 1 The flow diagram of search strategy.
Zhan et al.Journal of Experimental & Clinical Cancer Research 2011, 30:99
http://www.jeccr.com/content/30/1/99
Page 4 of 17

Table 1 Distribution of CYP1A1 MspI and exon7 genotypes among lung cancer cases and controls included in this meta-analysis
First author-year Ethnicity(country of origin) Total sample size
(case/control)
Lung cancer cases
of MspI genotype
Controls of
MspI genotype
Lung cancer cases
of exon7 genotype
Controls of exon7 genotype
Type B Type C Type A Type B Type C Type A Ile/Val Val/Val Ile/Ile Ile/Val Val/Val Ile/Ile
Kawajiri K-1990 Asia(Japan) 68/104 28 16 24 42 11 51 NA NA NA NA NA NA
Tefre T-1991 Caucasian(Norway) 221/212 47 2 172 43 2 167 NA NA NA NA NA NA
Hirvonen A-1992 Caucasian(Finnish) 87/121 22 0 65 24 2 95 NA NA NA NA NA NA
Shields PG-1993 Mixed populations 56/48 11 2 43 12 3 33 NA NA NA NA NA NA
Nakachi K-1993 Asia(Japan) 31/127 7 13 11 55 11 61 11 6 14 44 4 79
Alexandrie AK-1994 Caucasian(Sweden) 296/329 44 4 248 52 1 276 16 0 280 23 0 306
Kelsey K.T -1994 Mixed(African Americans) 72/97 11 1 60 21 2 74 NA NA NA NA NA NA
Cantlay AM-1995 Caucasian(Edinburgh) 129/281 NA NA NA NA NA NA 21 2 106 33 3 245
Kihara M-1995 Asia(Japan) 97/258 45 16 36 105 41 112 31 5 59 98 14 143
Xu XP-1996 Caucasian(USA) 207/238 35 2 170 48 2 233 NA NA NA NA NA NA
Garcia-ClosaM-1997 Mixed populations 416/446 75 4 337 73 4 369 NA NA NA NA NA NA
Ishibe N-1997 Mixed(Mexican and African) 171/295 68 12 91 106 35 154 31 7 132 70 20 204
Hong YS-1998 Asia(Korean) 85/63 45 6 34 31 3 29 68 1 16 60 1 2
Taioli E-1998 Mixed populations 105/307 30 9 59 101 18 170 8 1 94 18 0 272
Sugimura H-1998 Asia(Japan) 247/185 NA NA NA NA NA NA 94 28 125 84 7 94
Le Marchand L-1998 Mixed populations 341/456 121 35 183 160 44 250 68 6 263 105 13 335
Xue KX-1999 Asia(china) 103/131 NA NA NA NA NA NA 31 18 54 36 11 36
Hu YL-1999 Asia(china) 59/132 22 15 22 76 22 34 33 7 19 102 9 21
London SJ-2000 Asia(China) 214/669 NA NA NA NA NA NA 39 8 167 130 27 512
Dresler CM-2000 Caucasian(USA) 158/149 37* 121 17* 132 NA NA NA NA NA NA
Song N-2001 Asia(China) 217/404 129 28 60 175 56 173 130 9 78 181 13 210
Ratnasinghe D-2001 Caucasian(USA) 282/324 NA NA NA NA NA NA 36 3 243 48 3 273
Quinones L-2001 Caucasians(Chile) 60/174 29 10 16 38 16 86 35 10 15 52 14 54
Chen S-2001 Asia(china) 106/106 NA NA NA NA NA NA 38 10 58 33 3 70
Xue KX-2001 Asia(china) 106/106 NA NA NA NA NA NA 38 10 58 33 3 33
Yin LH-2002 Asia(china) 84/84 34 13 37 38 18 28 NA NA NA NA NA NA
Zhou XW-2002 Asia(china) 92/98 43 15 34 34 13 51 66 11 15 65 6 65
Cai XL-2003 Asia(china) 91/138 23 36 32 46 39 53 NA NA NA NA NA NA
Kiyohara C-2003 Asia(Japan) 158/259 64 17 77 115 28 116 NA NA NA NA NA NA
Taioli E-2003 Mixed populations 109/424 MspI
110/707exon7
20 5 84 75 4 345 16 1 93 70 2 635
Wang J-2003 Asia(china) 162/181 76 22 64 78 38 65 NA NA NA NA NA NA
Dialyna IA-2003 Caucasians (Greek) 122/178 28 5 89 45 3 130 NA NA NA NA NA NA
Dong CT-2004 Asia(china) 82/91 NA NA NA NA NA NA 36 18 28 32 10 32
Gu YF-2004 Asia(china) 180/224 129 * 51 138* 86 NA NA NA NA NA NA
Liang GY-2004 Asia(china) 152/152 82 20 50 71 11 70 NA NA NA NA NA NA
Zhan et al.Journal of Experimental & Clinical Cancer Research 2011, 30:99
http://www.jeccr.com/content/30/1/99
Page 5 of 17


%20--%3e%3cdefs%3e%3cstyle%3e%20.st0%20{%20fill:%20%23fff;%20}%20.st1%20{%20fill:%20%237800fa;%20}%20%3c/style%3e%3c/defs%3e%3cpath%20class='st1'%20d='M117.78,12.18H43.11c2.9,3.47,4.65,7.94,4.65,12.82,0,5.6-2.3,10.66-6.01,14.29h76.02l7.22-13.56-7.22-13.56Z'/%3e%3cg%3e%3cpath%20class='st0'%20d='M53.58,26.17h-.59v-1.46h.59v-4.96h2.83c1.78,0,2.67.94,2.67,2.82v5.76c0,1.87-.89,2.81-2.67,2.81h-2.83v-4.96ZM55.36,21.37v3.34h1.1v1.46h-1.1v3.34h1.01c.61,0,.91-.37.91-1.1v-5.93c0-.74-.3-1.1-.91-1.1h-1.01Z'/%3e%3cpath%20class='st0'%20d='M65.99,31.14h-1.8l-.31-2.07h-2.19l-.31,2.07h-1.64l1.82-11.39h2.62l1.82,11.39ZM65.28,18.04c-.25.46-.51.77-.75.94-.21.15-.47.22-.79.22-.26,0-.57-.07-.92-.22l-.38-.15c-.14-.05-.26-.07-.37-.07-.3,0-.53.18-.71.54l-.91-.68c.25-.46.51-.77.75-.94.21-.14.48-.21.79-.21.26,0,.57.07.92.21l.38.15c.14.05.26.07.37.07.3,0,.53-.18.71-.54l.91.68ZM61.91,27.52h1.73l-.87-5.76-.87,5.76Z'/%3e%3cpath%20class='st0'%20d='M74.53,26.89v1.52c0,1.91-.89,2.86-2.67,2.86s-2.67-.95-2.67-2.86v-5.93c0-1.91.89-2.86,2.67-2.86s2.67.95,2.67,2.86v1.11h-1.69v-1.22c0-.75-.31-1.12-.93-1.12s-.93.37-.93,1.12v6.15c0,.74.31,1.11.93,1.11s.93-.37.93-1.11v-1.63h1.69Z'/%3e%3cpath%20class='st0'%20d='M81.4,31.14h-1.8l-.31-2.07h-2.19l-.31,2.07h-1.64l1.82-11.39h2.62l1.82,11.39ZM75.9,19.2l1.52-1.91h1.71l1.51,1.91h-1.61l-.76-.95-.75.95h-1.61ZM77.32,27.52h1.73l-.87-5.76-.87,5.76ZM83.1,15.99l-1.76,1.91h-1.26l1.17-1.91h1.86Z'/%3e%3cpath%20class='st0'%20d='M84.86,19.75c1.78,0,2.67.94,2.67,2.82v1.48c0,1.87-.89,2.81-2.67,2.81h-.85v4.28h-1.79v-11.39h2.64ZM84.01,21.37v3.86h.85c.58,0,.87-.36.87-1.08v-1.71c0-.71-.29-1.07-.87-1.07h-.85Z'/%3e%3cpath%20class='st0'%20d='M93.51,19.75c1.78,0,2.67.94,2.67,2.82v1.48c0,1.87-.89,2.81-2.67,2.81h-.85v4.28h-1.79v-11.39h2.64ZM92.66,21.37v3.86h.85c.58,0,.87-.36.87-1.08v-1.71c0-.71-.29-1.07-.87-1.07h-.85Z'/%3e%3cpath%20class='st0'%20d='M98.8,31.14h-1.79v-11.39h1.79v4.88h2.03v-4.88h1.83v11.39h-1.83v-4.88h-2.03v4.88Z'/%3e%3cpath%20class='st0'%20d='M105.36,24.55h2.46v1.62h-2.46v3.34h3.09v1.63h-4.88v-11.39h4.88v1.63h-3.09v3.18ZM108.17,17.29l-1.76,1.91h-1.26l1.17-1.91h1.86Z'/%3e%3cpath%20class='st0'%20d='M112.2,19.75c1.78,0,2.67.94,2.67,2.82v1.48c0,1.87-.89,2.81-2.67,2.81h-.85v4.28h-1.79v-11.39h2.64ZM111.35,21.37v3.86h.85c.58,0,.87-.36.87-1.08v-1.71c0-.71-.29-1.07-.87-1.07h-.85Z'/%3e%3c/g%3e%3ccircle%20class='st1'%20cx='25'%20cy='25'%20r='20'/%3e%3cpath%20class='st0'%20d='M32.78,19.27c2.92,0,4.43,2.55,5.28,5.33l.71,2.17c.14.38-.33.75-.71.75h-5.61c.19-.33.24-.71.09-1.08l-.75-2.45c-.43-1.32-.99-2.64-1.79-3.77.75-.57,1.65-.94,2.78-.94h0ZM25,18.38c3.25,0,4.9,2.78,5.89,5.89l.76,2.45c.14.42-.33.8-.8.8h-11.69c-.42,0-.94-.38-.8-.8l.75-2.45c.99-3.11,2.64-5.89,5.89-5.89h0ZM25,11.35c1.74,0,3.11,1.37,3.11,3.11s-1.37,3.11-3.11,3.11-3.11-1.41-3.11-3.11,1.41-3.11,3.11-3.11h0ZM17.27,19.27c1.08,0,1.98.38,2.73.94-.8,1.13-1.37,2.45-1.74,3.77l-.8,2.45c-.14.38-.05.75.09,1.08h-5.56c-.42,0-.9-.38-.75-.75l.71-2.17c.9-2.78,2.41-5.33,5.33-5.33h0ZM17.27,12.91c1.51,0,2.78,1.27,2.78,2.83s-1.27,2.83-2.78,2.83-2.83-1.27-2.83-2.83,1.27-2.83,2.83-2.83h0ZM32.78,12.91c1.56,0,2.78,1.27,2.78,2.83s-1.23,2.83-2.78,2.83-2.83-1.27-2.83-2.83,1.27-2.83,2.83-2.83h0ZM27.07,28.56v.09c0,.57-.24,1.08-.61,1.46h0v.05c-.38.33-.9.57-1.46.57s-1.08-.24-1.46-.61h0c-.38-.38-.61-.9-.61-1.46v-.09h1.41v.09c0,.19.05.38.19.47v.05c.09.09.28.19.47.19s.38-.09.47-.19v-.05c.14-.09.24-.28.24-.47t-.05-.09h1.41ZM30.99,28.56v.09c0,1.65-.66,3.16-1.74,4.24-1.08,1.08-2.59,1.79-4.24,1.79s-3.16-.71-4.24-1.79l-.05-.05c-1.04-1.08-1.7-2.55-1.7-4.2v-.09h1.41v.09c0,1.27.47,2.4,1.27,3.25h.05c.85.85,1.98,1.37,3.25,1.37s2.4-.52,3.25-1.37c.85-.8,1.37-1.98,1.37-3.25v-.09h1.37ZM34.99,28.56v.09c0,2.78-1.13,5.28-2.92,7.07-1.79,1.79-4.29,2.92-7.07,2.92s-5.23-1.13-7.07-2.92c-1.79-1.79-2.92-4.29-2.92-7.07v-.09h1.41v.09c0,2.4.94,4.53,2.5,6.08,1.56,1.56,3.72,2.5,6.08,2.5s4.52-.94,6.08-2.5c1.56-1.56,2.5-3.68,2.5-6.08v-.09h1.41Z'/%3e%3c/svg%3e)