
RESEARC H Open Access
Effects of RNA interference-mediated gene
silencing of JMJD2A on human breast
cancer cell line MDA-MB-231 in vitro
Bei-Xu Li, Ming-Chang Zhang, Cheng-Liang Luo, Peng Yang, Hui Li, Hong-Mei Xu, Hong-Fei Xu, Yi-Wen Shen,
Ai-Min Xue and Zi-Qin Zhao
*
Abstract
Previous data demonstrate that JMJD2A is a cancer-associated gene and may be involved in human breast cancer
by demethylation of H3K9me3. The aim of this study was to investigate depressive effects on JMJD2A by
transfection with JMJD2A-sepcific siRNA in human breast cancer cell line MDA-MB-231 and effects on cell
proliferation, invasion and migration. JMJD2A-specific siRNA was chemically synthesised and transfected into
human breast cancer cell line MDA-MB-231. Expression levels of JMJD2A were detected by quantitative real-time
PCR and Western blot analysis. Cells proliferation was evaluated by using flow cytometric anlysis and MTT assay.
The abilities of invasion and migration were evaluated by cell migration and invasion assay with Boyden chambers.
The results showed that the transfection was successful and expression levels of JMJD2A mRNA and protein in
siRNA group were both down-regulated. By MTT assay, the mean actual absorbance in siRNA group was
significantly lower than that in blank control group (P < 0.05) and negative control group (P < 0.05). In addition,
the percentage of cells in G0/G1 phase in siRNA group was significantly more than that in blank control group (P
< 0.05) and negative control group (P < 0.05). Furthermore, by cell invasion and migration assay, the decreased
number of migrated cells in siRNA group was observed (P < 0.05). These data imply that silencing JMJD2A gene
could result in cell cycle change and proliferation inhibition, and lead to suppress tumor cell invasion and
migration. It provides a new perspective in understanding the pleiotropic functions of JMJD2A and its contribution
to human breast cancer.
Keywords: JMJD2A, transfection, proliferation, invasion, migration
Background
Human breast cancer is one of the most frequent malig-
nant tumors with the incidence rate increasing year by
year. Based on the GLOBOCAN 2008 estimates, breast
cancer is the most frequently diagnosed cancer and the
leading cause of cancer death among females, account-
ing for 23% of the total cancer cases and 14% of the
cancer deaths [1]. The prognosis of the patients with
advanced stage breast cancer is poor, because of the
progression and metastasis of the disease, even surgical
removal, chemotherapy and endocrine therapy were
employed for most cases. Prevention and treatment of
breast cancer require a better understanding of the
molecular mechanisms underlying the progression of
breast cancer.
Gene therapies for tumor were focused on in recent
years, including gene replacement, antisense nucleic acid
technique, cytokine gene therapy and RNA interference
(RNAi) technique. RNAi is a post-transcriptional regula-
tion and provides a rapid means of depleting mRNAs by
introducing double-stranded RNA homologous to a par-
ticular message leading to its sequence-specific degrada-
tion. It is simple, specific and effective to use small
interfering RNA (siRNA) to silence target gene [2].
Jumonji Domain Containing 2A (JMJD2A, also known
as JHDM3 or KDM4A) was identified and characterized
in 2004 [3]. JMJD2A belongs to the JmjC domain-con-
taining family JMJD2 proteins, which are lysine tri-
methyl-specific histone demethylases catalyzing the
* Correspondence: zqzhao@shmu.edu.cn
Department of Forensic Medicine, Shanghai Medical College, Fudan
University, Shanghai 200032, PR China
Li et al.Journal of Experimental & Clinical Cancer Research 2011, 30:90
http://www.jeccr.com/content/30/1/90
© 2011 Li et al; licensee BioMed Central Ltd. This is an Open Access article distributed under the terms of the Creative Commons
Attribution License (http://creativecommons.org/licenses/by/2.0), which permits unrestricted use, distribution, and reproduction in
any medium, provided the original work is properly cited.

demethylation of trimethylated H3K9 (H3K9me3) and
H3K36 (H3K36me3) [4-6]. JMJD2 family genes are can-
cer-associated genes [3]. JMJD2A is widely expressed in
human tissues and cell lines, and high endogenous
expression of JMJD2A mRNA was found in several cell
types, including human T-cell lymphotropic virus 1-
infected cell lines, the HT1376 bladder carcinoma cell
line, the U2OS osteosarcoma cell line and the prostate
cancer cell line [7,8]. However, there are rare literatures
focusing on the relationship between JMJD2A and
breast cancer.
In this study, JMJD2A-specific siRNA was chemically
synthesised and transfected into human breast cancer
cell line MDA-MB-231. The levels on JMJD2A mRNA
and its protein expression, and biological characteristics
of MDA-MB-231 cells including proliferation, migration
and invasion were investigated.
Materials and methods
JMJD2A siRNA synthesis
JMJD2A siRNA was chemically synthesised by Qiagen
Technology Co. Ltd (Shanghai, China). siRNA was
diluted to 20 μmol/L with free-RNase water. siRNA
duplexes were synthesised as follows: Sense sequence: 5’-
GAGUUAUCAACUCAAGAUA-3’, Antisense sequence:
5’-UAUCUUGAGUUGAUAACUC-3’.
Cell transfection
Human breast cancer cell line MDA-MB-231 in this
research was preserved in our laboratory. At 24 h
before transfection, MDA-MB-231 cells in logarithmic
growth phase were seeded into 6-well plates, at a den-
sity of 5 × 10
5
cells per well and incubated in RPMI
1640 medium (GIBCO, Invitrogen, USA) containing
10% FBS (GIBCO, Invitrogen, USA). RPMI 1640 med-
ium containing 10% FBS was replaced by serum-free
Opti-MEM (GIBCO, Invitrogen, USA) at 8 h later.
HiPerFect Transfection Reagent and Negative control
siRNA were purchased from Qiagen Technology Co.
Ltd (Shanghai, China). Transfection compounds were
prepared in three groups as follows: siRNA group (100
μl Opti-MEM, 6 μl HiPerFect Transfection Reagent
and 5 μl JMJD2A siRNA), negative control group (100
μl Opti-MEM, 6 μl HiPerFect Transfection Reagent
and 5 μl negative control siRNA) and blank control
group (100 μl Opti-MEM). Transfection compounds
were placed at room temperature for 10 minutes and
then dropped onto 6-well plates. Bulk volume of the
compounds was 2200 μl per well. Both Opti-MEM and
transfection compounds were replaced by complete
medium at 24 h after transfection. FAM-siRNA was
transfected to measure the efficiency of transfection
simultaneously according to the manufacturer’s
instructions.
Quantitative real-time PCR
Total RNA of three groups was extracted respectively with
the RNAiso Reagent kit (TaKaRa, Dalian, China) at 48 h
after transfection. cDNA was generated by reverse tran-
scription of 2 μg of total RNA using random primers and
PrimeScript RT Master Mix Perfect Real Time (TaKaRa,
Dalian, China) in a total reaction volume of 40 μl accord-
ing to the manufacturer’s instructions. The sequences of
forward and reverse oligonucleotide primers, specific to
JMJD2A and housekeeping genes, were designed using
Primer5 software. The primers used are: 5’-TGTGC
TGTGCTCCTGTAG -3’and 5’-GTCTCCTTCCTCTC
CATCC -3’for JMJD2A; 5’-TGACGCTGGGGCTGG-
CATTG -3’and 5’-GCTCTTGCTGGGGCTGGTGG -3’
for GAPDH. Primers were synthesised by Shanghai
Daweike Biotechnology Co. Ltd (Shanghai, China).
Real-time quantitative PCR was performed in an ABI
PRISM 7500 Real-Time System. A 10-fold dilution of
each cDNA was amplified in a 20-μl volume, using the
SYBR Premix Ex TaqTM Perfect Real Time (TaKaRa,
Dalian, China), with 0.2 μM final concentrations of each
primer. PCR cycle conditions were 95°C for 30 s, and
40 cycles of 95°C for 5 s and 60°C for 34 s. The amplifi-
cation specificity was evaluated with melting curve ana-
lysis. Threshold cycle Ct, which correlates inversely with
the target mRNA levels, was calculated using the second
derivative maximum algorithm provided by the iCycler
software. For JMJD2A, the mRNA levels were normal-
ized to GAPDH mRNA levels [9].
Western blot
At 72 h after transfection, cells in different treatment
groups were homogenized in Western blot analysis buf-
fer containing 10 mM Tris-HCl (pH 7.4), 150 mM
NaCl, 1% (v/v) Triton X-100, 1% sodium deoxycholate,
0.1% SDS, 5 mM EDTA, 1 mM PMSF, 0.28 kU/L apro-
tinin, 50 mg/L leupeptin, 1 mM benzamidine and 7 mg/
L pepstain A. The homogenate was then centrifuged at
12, 000 rpm for 10 min at 4°C and the supernatant was
retained and preserved at -80°C for later use. Protein
concentration was determined using a BCA kit (Pierce).
Twenty micrograms of protein from each group were
subject to electrophoresis on 10% SDS-PAGE gel using
a constant current. Proteins were transferred to nitrocel-
lulose membranes on a semidry electrotransferring unit
and incubated with monoclonal rabbit anti-human
JMJD2A antibody (Cell Signaling Technology, USA,
1:1000) in Tris-buffered saline containing 0.1% Tween-
20(TBST)and5%nonfatdrymilkovernightat4°C.
After the overnight incubation with the primary antibo-
dies, membranes were washed and incubated with HRP-
labelled goat anti-rabbit second antibody (Santa Cruz
Biotechnology Inc., USA) in TBST for 2 h. Immunoreac-
tivity was detected with enhanced chemoluminescent
Li et al.Journal of Experimental & Clinical Cancer Research 2011, 30:90
http://www.jeccr.com/content/30/1/90
Page 2 of 9

autoradiography (ECL kit, Amersham), according to the
manufacturer’s instructions. The membranes were
reprobed with GAPDH (Cell Signaling Technology,
USA, 1:1000) after striping. The signal intensity of pri-
mary antibody binding was quantitatively analyzed with
Sigma Scan Pro 5 and was normalized to a loading con-
trol, GAPDH [10].
Flow cytometric anlysis (FCM)
At 72 h after transfection, cells in different treatment
groups were collected with trypsinization, then washed
with PBS twice. Cells were fixed in 70% ethanol for 1 h
at room temperature. After centrifugation, the cell pellet
was resuspended in PBS (pH 7.4), containing 100 μL
RNase A (1 mg/mL) and 400 μL propidium iodide (50
μg/mL). The cells were incubated for 30 min at room
temperature, and DNA content was determined by flow
cytometry using a FACScan flow cytometer at 488 nm
and the data were input to computer and analyzed by
software Light cycle. The experiment was performed
three times in triplicate [11]. Proliferation indexes (PI)
was calculated as follows: PI = (S+G2/M)/(G0/G1+S
+G2/M)×100%.
MTT assay
MDA-MB-231 cells were seeded into 96-well plates at a
density of 1 × 10
4
cells per well and incubated in RPMI
1640 medium containing 10% FBS. RPMI 1640 medium
containing 10% FBS was replaced by serum-free Opti-
MEM 8 h later. These cells were grouped as indicated
above (cell transfection).Thebulkvolumeofthetrans-
fection compounds was 100 μl per well. Opti-MEM and
transfection compounds were replaced by complete
medium at 24 h after transfection. After 72 h of incuba-
tion, MDA-MB-231 cells were incubated for an addi-
tional 4 hours with 20 μl MTT (Sigma Chemical Co.,
USA, 5 mg/ml). Then the supernatant was removed,
and 150 μl DMSO was added. Absorbance at 570 nm
(A570) of three groups and DMSO (Sigma Chemical
Co., USA) was measured with a microplate reader
(Model 550, Bio-Rad, USA) [11]. All experiments were
carried out eight times. Actual absorbance = absorbance
of the experimental group-absorbance of DMSO.
In vitro cell migration and invasion assay
At 24 h after transfection, the cells in different groups
were treated with trypsin and re-suspended as single-
cell solutions. A total of 2 × 10
5
cells in 0.5 ml of
serum-free RPMI 1640 medium were seeded on a 8 μm-
pore polycarbonate membrane Boyden chambers insert
in a transwell apparatus (Costar, Cambridge, MA), either
coated with (invasion) or without (migration) Matrigel
(BDBiosciences,SanJose,CA).600μlRPMI1640con-
taining 20% FBS was added to the lower chamber. After
the cells were incubated for 72 h (invasion) or 36 h
(migration) at 37°C in a 5% CO
2
incubator, the cells on
the top surface of the insert were removed by wiping
with a cotton swab. The cells that migrated to the bot-
tom surface of the insert were fixed in 100% methanol
for 2 min, stained in Giemsa for 2 min, rinsed in PBS
and then subjected to microscopic inspection (×200).
Values for invasion and migration were obtained by
counting five fields per membrane and represented the
average of three independent experiments [12].
Statistics analysis
The data were presented as means-standard errors (SE)
for MDA-MB-231 cells in each group. Statistical analysis
was carried out by one-way ANOVA followed by Dun-
nett t-test or Student t-test (two means comparison).
Statistical analysis was given using the related programs
in SPSS 12.0. Differences were considered significant
when P < 0.05.
Results
JMJD2A siRNA synthesis
The sequence of chemically synthesized JMJD2A siRNA
was consistent with the requirements, and the purity
reached to 98%. This met the experiment requirements.
Observation of cell transfection results
MDA-MB-231 cells transfected with FAM-siRNA were
subjected to Fluorescence microscopy at 8 h after trans-
fection. The green fluorescence cells were considered to
be transfected successfully. As shown in Figure 1A, cell
transfection was successful and HiPerFect Transfection
Reagent was effective. The transfection efficiency was
about 72.3%.
Transfection with JMJD2A-specific siRNA down-regulated
JMJD2A mRNA levels to silence JMJD2A gene
According to the results of quantitative real-time PCR
(Figure 1B), no significant difference (P > 0.05) was
detected in the levels of JMJD2A mRNA between blank
control group (0.998 ± 0.170) and negative control
group (0.997 ± 0.150). The mRNA expression of siRNA
group (0.386 ± 0.108) were significantly lower than that
in blank control group (P < 0.05) and negative control
group (P < 0.05), respectively. These data suggested that
JMJD2A mRNA levels in MDA-MB-231 cells decreased
significantly after transfection with JMJD2A siRNA.
Transfection with JMJD2A-specific siRNA could result
in JMJD2A mRNA degradation to silence JMJD2A gene.
Transfection with JMJD2A-specific siRNA inhibited
JMJD2A protein expression in MDA-MB-231 cells
Western blot analysis showed that, the levels of JMJD2A
protein expression in the siRNA group (0.093 ± 0.051)
Li et al.Journal of Experimental & Clinical Cancer Research 2011, 30:90
http://www.jeccr.com/content/30/1/90
Page 3 of 9
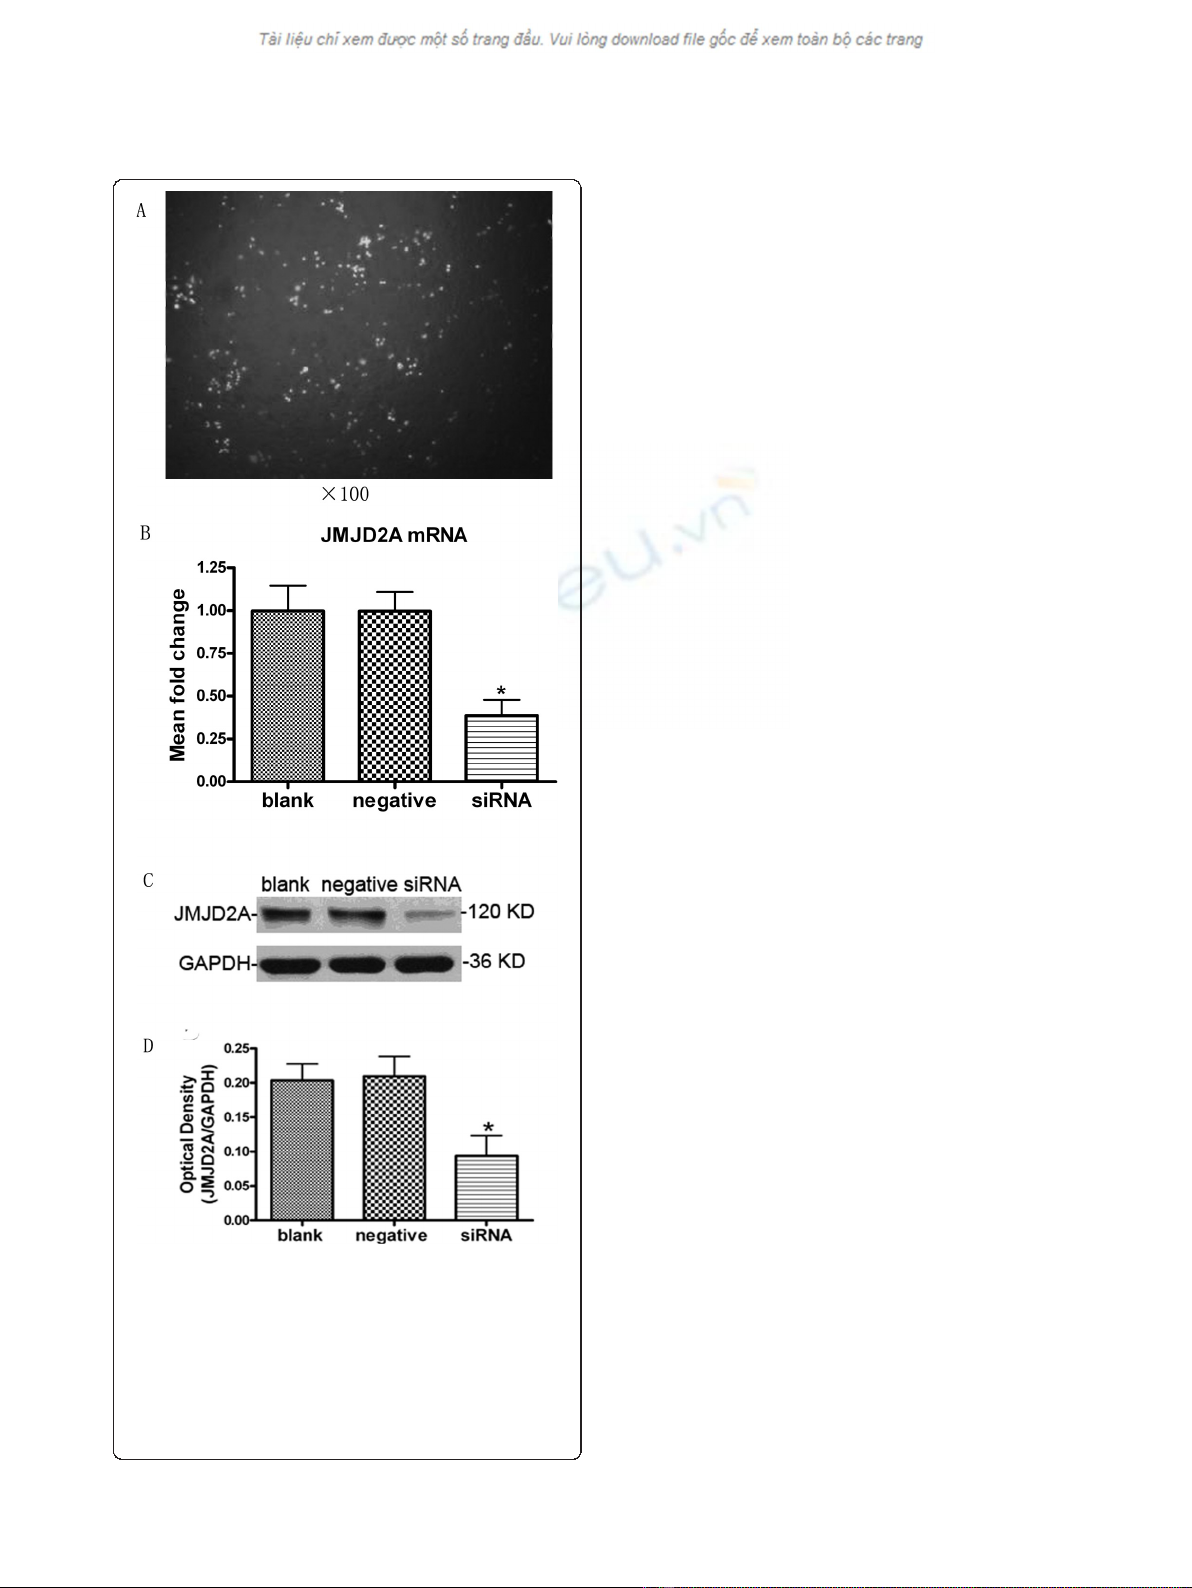
were significantly lower than that in blank control group
(0.203 ± 0.042) and negative control group (0.210 ±
0.050), respectively (P < 0.05; Figure 1C and 1D), while
the difference between blank control group and negative
control group was not significant (P > 0.05; Figure 1C
and 1D). These data indicated that JMJD2A-specific
siRNA silencing mRNA could significantly reduce the
levels of JMJD2A protein expression in MDA-MB-231
cells.
Silencing JMJD2A gene resulted in cell cycle changes and
proliferation inhibition in MDA-MB-231 cells
Cell cycle analysis by FCM revealed that JMJD2A siRNA
could induce changes in cell cycle of MDA-MB-231
cells. The mean value of the experiments was shown in
Figure 2A, B and 2C. There were no significant differ-
ences (P > 0.05) in the percentages of cells at each
phase between blank control group and negative control
group. Compared with blank control group (30.3 ±
2.7%) and negative control group (34.2 ± 2.3%) respec-
tively, there was a significant difference (P < 0.05) in the
percentage of cells in G0/G1 phase in siRNA group
(44.3 ± 1.6%). Similarly, there was a significant differ-
ence (P < 0.05) in the percentage of cells in S phase in
siRNA group (43.4 ± 2.3%), versus blank control group
(58.4 ± 2.1%) and negative control group (52.8 ± 2.2%),
respectively. However, there was no significant differ-
ence (P > 0.05) in the percentage of cells in G2/M
phase in siRNA group (12.1 ± 2.2%), relative to blank
control group (11.0 ± 1.2%) and negative control group
(13.3 ± 1.8%), respectively. Silencing JMJD2A gene
could increase the percentage of cells at G0/G1 phase
and decrease the percentage of cells at S phase. The
results suggested that the treatment could arrest cells at
the G1/S checkpoint and delay cell cycle into S phase.
Furthermore, proliferation indexes (PI) of each group
were calculated. We found that there was a significant
difference (P < 0.05) in PI of siRNA group (55.6 ±
2.1%), versus blank control group (69.6 ± 2.1%) and
negative control group (65.9 ± 2.2%), respectively. Our
results revealed a change in cell cycle with transfection
and indicated that cell proliferation could be inhibited
by transfection.
Additionally, MTT assay was performed to test the
effects of transfection with JMJD2A siRNA on the pro-
liferation of MDA-MB-231 cells treated in three differ-
ent groups. As shown in Figure 2D, there was no
significant difference (P > 0.05) in the average actual
absorbance between blank control group (2.136 ± 0.135)
and negative control group (2.089 ± 0.115). The average
actual absorbance in siRNA group (1.711 ± 0.087) was
significantly lower than that in blank control group (P <
0.05) and negative control group (P < 0.05), respectively.
Absorbance represents cell proliferation in MTT assay.
Figure 1 Transfection was successful and levels of JMJD2A
mRNA and protein were both down-regulated. A. The green
fluorescence cells transfected with FAM-siRNA under fluorescence
microscope (Note: ×100). B. Column diagram analysis for mRNA
levels of JMJD2A. JMJD2A-specific siRNA resulted in the reduction of
JMJD2A mRNA levels in MDA-MB-231 cells. C. Western blot analysis
for JMJD2A protein. D. Column diagram analysis for optical density
by Western blotting. JMJD2A protein levels were down-regulated in
siRNA group. (*P < 0.05, compared with blank control group and
negative control group respectively)
Li et al.Journal of Experimental & Clinical Cancer Research 2011, 30:90
http://www.jeccr.com/content/30/1/90
Page 4 of 9
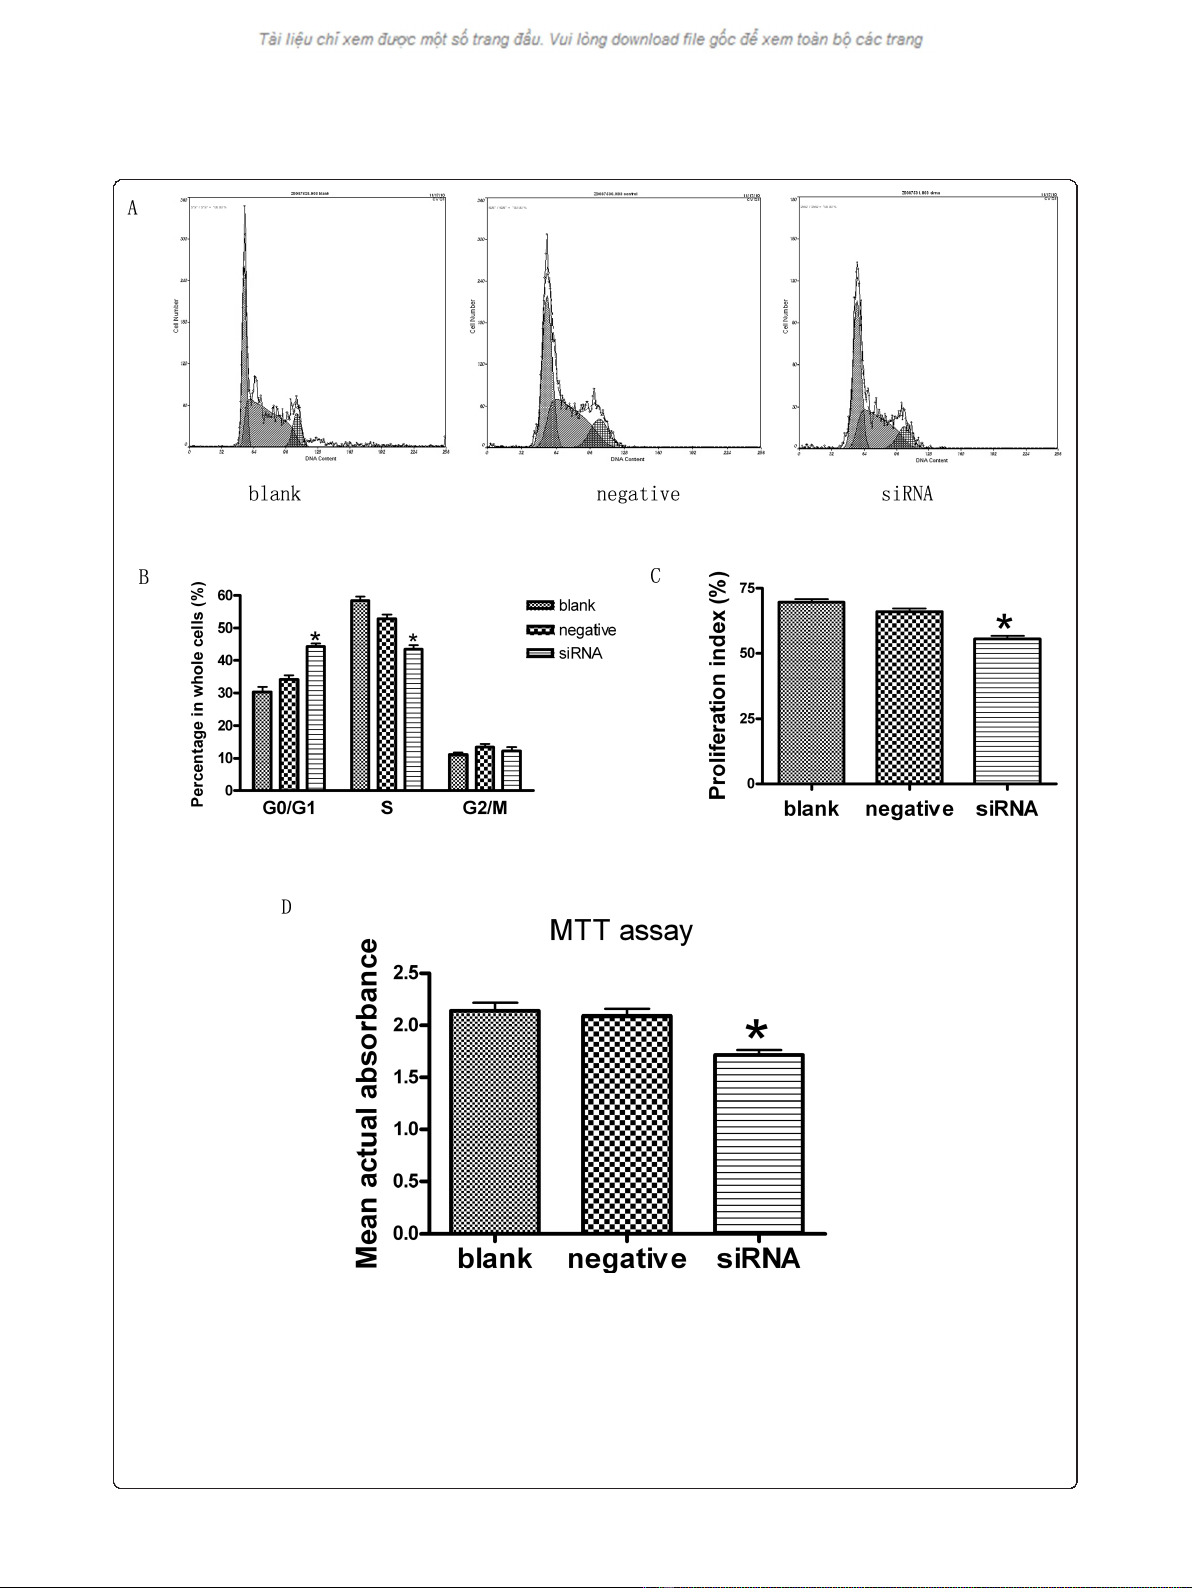
Figure 2 Knock down of JMJD2A resulted in cell cycle change and proliferation inhibition. A. DNA contents of MDA-MB-231 cells treated
in blank control group, negative control group and siRNA group by FCM. B. Column diagram analysis for the percentages of cells at each phase
in three different groups: G0/G1 phase, S phase and G2/M phase. At G0/G1 phase, there was a significant difference in the percentage of cells in
siRNA group compared with blank control group and negative control group respectively. At S phase, there was a significant difference in the
percentage of cells in siRNA group compared with blank control group and negative control group respectively, while no significant differences
in the percentages of cells at G2/M phase in the three groups. C. Column diagram analysis for the proliferation indexes (PI) calculated in three
different groups. PI in siRNA group was significantly lower than that in blank control group and negative control group respectively. D. Column
diagram analysis for the actual absorbance of three different groups, the mean actual absorbance of siRNA group was significantly lower than
that of the blank control group and the negative control group, respectively. (*P < 0.05, compared with blank control group and negative
control group respectively)
Li et al.Journal of Experimental & Clinical Cancer Research 2011, 30:90
http://www.jeccr.com/content/30/1/90
Page 5 of 9


![Vaccine và ứng dụng: Bài tiểu luận [chuẩn SEO]](https://cdn.tailieu.vn/images/document/thumbnail/2016/20160519/3008140018/135x160/652005293.jpg)


%20--%3e%3cdefs%3e%3cstyle%3e%20.st0%20{%20fill:%20%23fff;%20}%20.st1%20{%20fill:%20%237800fa;%20}%20%3c/style%3e%3c/defs%3e%3cpath%20class='st1'%20d='M117.78,12.18H43.11c2.9,3.47,4.65,7.94,4.65,12.82,0,5.6-2.3,10.66-6.01,14.29h76.02l7.22-13.56-7.22-13.56Z'/%3e%3cg%3e%3cpath%20class='st0'%20d='M53.58,26.17h-.59v-1.46h.59v-4.96h2.83c1.78,0,2.67.94,2.67,2.82v5.76c0,1.87-.89,2.81-2.67,2.81h-2.83v-4.96ZM55.36,21.37v3.34h1.1v1.46h-1.1v3.34h1.01c.61,0,.91-.37.91-1.1v-5.93c0-.74-.3-1.1-.91-1.1h-1.01Z'/%3e%3cpath%20class='st0'%20d='M65.99,31.14h-1.8l-.31-2.07h-2.19l-.31,2.07h-1.64l1.82-11.39h2.62l1.82,11.39ZM65.28,18.04c-.25.46-.51.77-.75.94-.21.15-.47.22-.79.22-.26,0-.57-.07-.92-.22l-.38-.15c-.14-.05-.26-.07-.37-.07-.3,0-.53.18-.71.54l-.91-.68c.25-.46.51-.77.75-.94.21-.14.48-.21.79-.21.26,0,.57.07.92.21l.38.15c.14.05.26.07.37.07.3,0,.53-.18.71-.54l.91.68ZM61.91,27.52h1.73l-.87-5.76-.87,5.76Z'/%3e%3cpath%20class='st0'%20d='M74.53,26.89v1.52c0,1.91-.89,2.86-2.67,2.86s-2.67-.95-2.67-2.86v-5.93c0-1.91.89-2.86,2.67-2.86s2.67.95,2.67,2.86v1.11h-1.69v-1.22c0-.75-.31-1.12-.93-1.12s-.93.37-.93,1.12v6.15c0,.74.31,1.11.93,1.11s.93-.37.93-1.11v-1.63h1.69Z'/%3e%3cpath%20class='st0'%20d='M81.4,31.14h-1.8l-.31-2.07h-2.19l-.31,2.07h-1.64l1.82-11.39h2.62l1.82,11.39ZM75.9,19.2l1.52-1.91h1.71l1.51,1.91h-1.61l-.76-.95-.75.95h-1.61ZM77.32,27.52h1.73l-.87-5.76-.87,5.76ZM83.1,15.99l-1.76,1.91h-1.26l1.17-1.91h1.86Z'/%3e%3cpath%20class='st0'%20d='M84.86,19.75c1.78,0,2.67.94,2.67,2.82v1.48c0,1.87-.89,2.81-2.67,2.81h-.85v4.28h-1.79v-11.39h2.64ZM84.01,21.37v3.86h.85c.58,0,.87-.36.87-1.08v-1.71c0-.71-.29-1.07-.87-1.07h-.85Z'/%3e%3cpath%20class='st0'%20d='M93.51,19.75c1.78,0,2.67.94,2.67,2.82v1.48c0,1.87-.89,2.81-2.67,2.81h-.85v4.28h-1.79v-11.39h2.64ZM92.66,21.37v3.86h.85c.58,0,.87-.36.87-1.08v-1.71c0-.71-.29-1.07-.87-1.07h-.85Z'/%3e%3cpath%20class='st0'%20d='M98.8,31.14h-1.79v-11.39h1.79v4.88h2.03v-4.88h1.83v11.39h-1.83v-4.88h-2.03v4.88Z'/%3e%3cpath%20class='st0'%20d='M105.36,24.55h2.46v1.62h-2.46v3.34h3.09v1.63h-4.88v-11.39h4.88v1.63h-3.09v3.18ZM108.17,17.29l-1.76,1.91h-1.26l1.17-1.91h1.86Z'/%3e%3cpath%20class='st0'%20d='M112.2,19.75c1.78,0,2.67.94,2.67,2.82v1.48c0,1.87-.89,2.81-2.67,2.81h-.85v4.28h-1.79v-11.39h2.64ZM111.35,21.37v3.86h.85c.58,0,.87-.36.87-1.08v-1.71c0-.71-.29-1.07-.87-1.07h-.85Z'/%3e%3c/g%3e%3ccircle%20class='st1'%20cx='25'%20cy='25'%20r='20'/%3e%3cpath%20class='st0'%20d='M32.78,19.27c2.92,0,4.43,2.55,5.28,5.33l.71,2.17c.14.38-.33.75-.71.75h-5.61c.19-.33.24-.71.09-1.08l-.75-2.45c-.43-1.32-.99-2.64-1.79-3.77.75-.57,1.65-.94,2.78-.94h0ZM25,18.38c3.25,0,4.9,2.78,5.89,5.89l.76,2.45c.14.42-.33.8-.8.8h-11.69c-.42,0-.94-.38-.8-.8l.75-2.45c.99-3.11,2.64-5.89,5.89-5.89h0ZM25,11.35c1.74,0,3.11,1.37,3.11,3.11s-1.37,3.11-3.11,3.11-3.11-1.41-3.11-3.11,1.41-3.11,3.11-3.11h0ZM17.27,19.27c1.08,0,1.98.38,2.73.94-.8,1.13-1.37,2.45-1.74,3.77l-.8,2.45c-.14.38-.05.75.09,1.08h-5.56c-.42,0-.9-.38-.75-.75l.71-2.17c.9-2.78,2.41-5.33,5.33-5.33h0ZM17.27,12.91c1.51,0,2.78,1.27,2.78,2.83s-1.27,2.83-2.78,2.83-2.83-1.27-2.83-2.83,1.27-2.83,2.83-2.83h0ZM32.78,12.91c1.56,0,2.78,1.27,2.78,2.83s-1.23,2.83-2.78,2.83-2.83-1.27-2.83-2.83,1.27-2.83,2.83-2.83h0ZM27.07,28.56v.09c0,.57-.24,1.08-.61,1.46h0v.05c-.38.33-.9.57-1.46.57s-1.08-.24-1.46-.61h0c-.38-.38-.61-.9-.61-1.46v-.09h1.41v.09c0,.19.05.38.19.47v.05c.09.09.28.19.47.19s.38-.09.47-.19v-.05c.14-.09.24-.28.24-.47t-.05-.09h1.41ZM30.99,28.56v.09c0,1.65-.66,3.16-1.74,4.24-1.08,1.08-2.59,1.79-4.24,1.79s-3.16-.71-4.24-1.79l-.05-.05c-1.04-1.08-1.7-2.55-1.7-4.2v-.09h1.41v.09c0,1.27.47,2.4,1.27,3.25h.05c.85.85,1.98,1.37,3.25,1.37s2.4-.52,3.25-1.37c.85-.8,1.37-1.98,1.37-3.25v-.09h1.37ZM34.99,28.56v.09c0,2.78-1.13,5.28-2.92,7.07-1.79,1.79-4.29,2.92-7.07,2.92s-5.23-1.13-7.07-2.92c-1.79-1.79-2.92-4.29-2.92-7.07v-.09h1.41v.09c0,2.4.94,4.53,2.5,6.08,1.56,1.56,3.72,2.5,6.08,2.5s4.52-.94,6.08-2.5c1.56-1.56,2.5-3.68,2.5-6.08v-.09h1.41Z'/%3e%3c/svg%3e)