HUE JOURNAL OF MEDICINE AND PHARMACY ISSN 3030-4318; eISSN: 3030-4326HUE JOURNAL OF MEDICINE AND PHARMACY ISSN 3030-4318; eISSN: 3030-4326
100 101
Hue Journal of Medicine and Pharmacy, Volume 15, No.2/2025 Hue Journal of Medicine and Pharmacy, Volume 15, No.2/2025
Clinical utility of R-OPS score in the preoperative diagnosis of ovarian
cancer: a prospective cohort study
Vo Hoang Lam1,2*, Nguyen Hoang2,3, Nguyen Xuan Anh Thu1,2, Nguyen Khoa Bao1,2,
Tran Trong Duy2, Truong Quang Vinh1,2
(1) Dept. of Obstetrics and Gynecology, Hue University of Medicine and Pharmacy, Hue University, Vietnam
(2) Dept. Obstetrics and Gynecology, Hue University of Medicine and Pharmacy Hospital, Hue University, Vietnam
(3) Dept. of Anatomy and Experimental Surgery Hue University of Medicine and Pharmacy, Hue University, Vietnam
Abstract
Objective: This study aimed to validate the diagnostic utility of the Rajavithi-Ovarian Cancer Predictive
Score (R-OPS) in preoperative ovarian cancer diagnosis and compare its efficacy with that of the Risk
of Ovarian Malignancy Algorithm (ROMA). Methods: A prospective cohort study was conducted at two
hospitals in Vietnam from January 2024 to January 2025, involving 215 patients with adnexal masses (69
malignant, 146 benign) who underwent surgery. R-OPS was calculated using menopausal status, ultrasound
findings, and serum cancer antigen 125 (CA125) and human epididymal protein 4 (HE4) levels. Results:
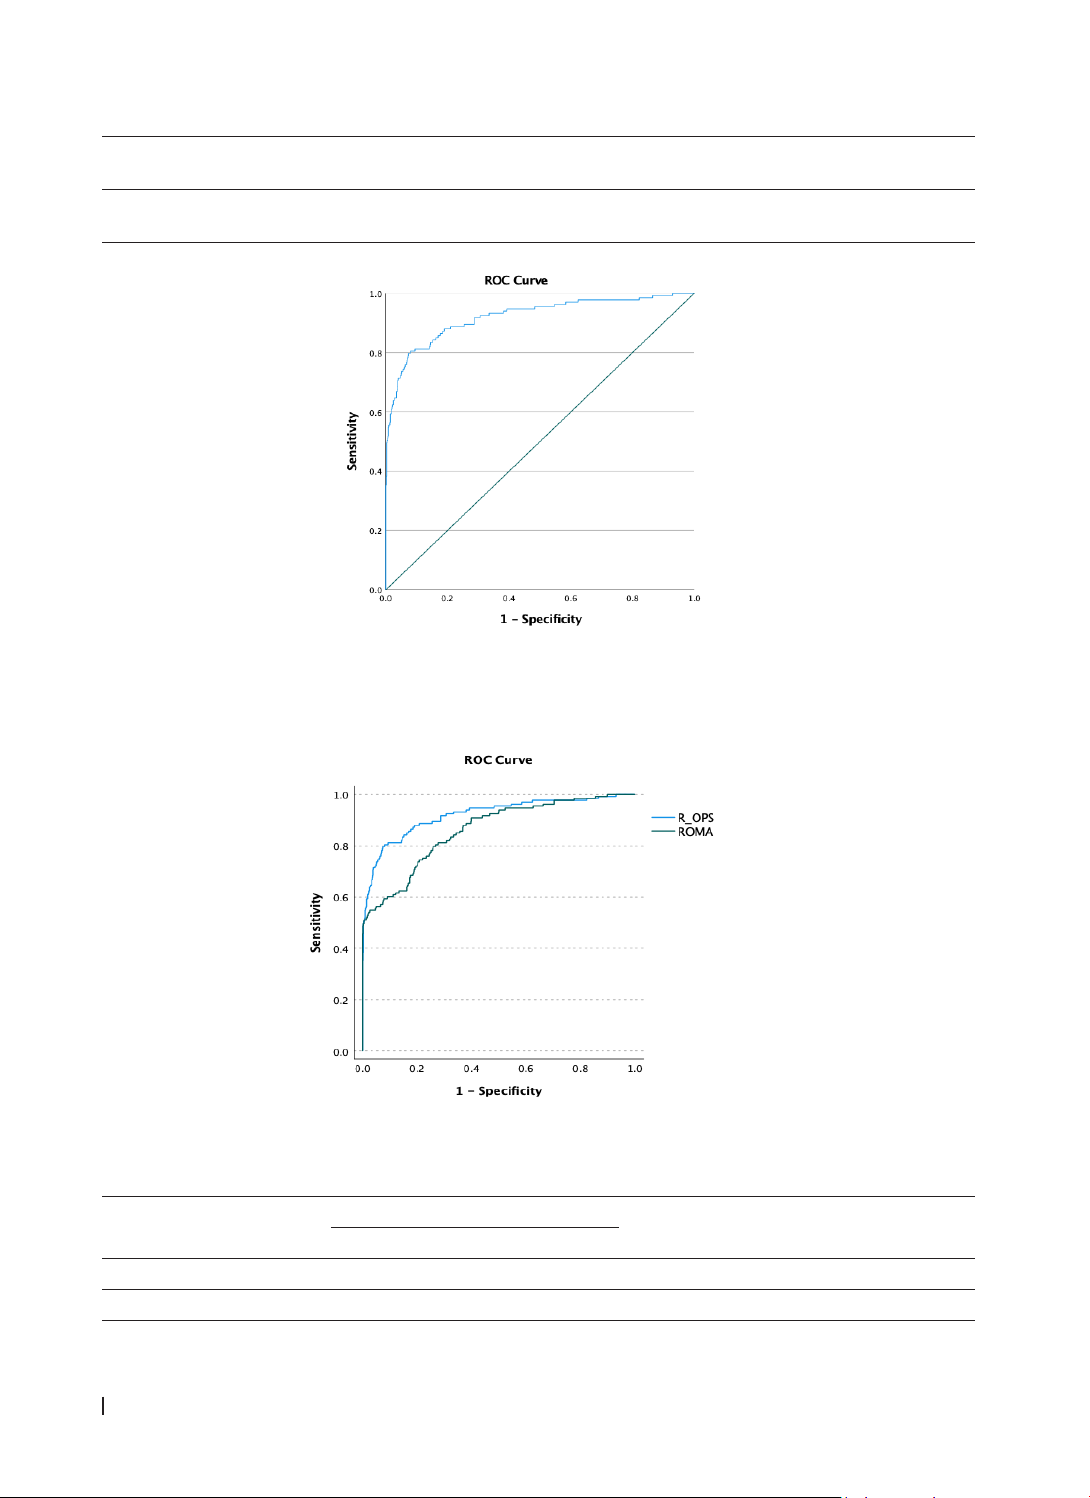
R-OPS achieved an AUC of 91.4% (95% CI: 87.0 - 95.7%). At a cut-off of > 330, it displayed a specificity of
95.2% and a sensitivity of 71.0%, with positive and negative predictive values of 86.0% and 87.3%. R-OPS
outperformed ROMA by 5.9% in AUC (P<0.001). Conclusion: R-OPS is an effective tool for preoperative
differentiation between benign and malignant ovarian masses, demonstrating superior performance
compared to ROMA.
Keywords: Ovarian cancer, R-OPS, ROMA, diagnostic accuracy, predictive score, biomarkers.
*Corresponding Author: Vo Hoang Lam. Email: vhlam@huemed-univ.edu.vn
Received: 21/1/2025; Accepted: 24/3/2025; Published: 28/4/2025
DOI: 10.34071/jmp.2025.2.15
1. INTRODUCTION
Ovarian cancer (OC) is the seventh most commonly
diagnosed cancer among women worldwide and
ranks as the eighth leading cause of cancer-related
deaths [1-3]. The five-year survival rate is generally
below 45%. While age-standardized rates are stable
or declining in high-income countries, the opposite
trend is observed in many low and middle-income
countries due to rising life expectancy and other
factors [1]. Epithelial ovarian cancer is the most
prevalent subtype, with various histotypes that differ
in origin, pathogenesis, and prognosis [2].
Ovarian cancer is often diagnosed at advanced
stages, contributing to its high mortality rate [4, 5].
Despite available screening methods such as blood
tests and transvaginal ultrasound, no approaches
have been found to demonstrate definitive mortality
benefits. The diagnostic process combines multiple
approaches, including serum biomarkers, including
serum cancer antigen 125 (CA125) and human
epididymal protein 4 (HE4), and imaging studies.
For preoperative risk stratification, clinicians utilize
the four versions of the Risk Malignancy Index and
the Risk of Ovarian Malignancy Algorithm (ROMA).
These assessment tools have demonstrated good
discriminatory performance in differentiating between
benign and malignant ovarian masses, enabling more
informed clinical decision-making [6, 7].
The Rajavithi-Ovarian Cancer Predictive Score
(R-OPS) was developed using data from women with
pelvic or adnexal masses, incorporating menopausal
status, serum CA 125, HE4, and ultrasound findings
of solid lesions as significant predictors of ovarian
cancer. The scoring system demonstrated good
calibration and discrimination, with an area under
the receiver operating characteristic curve (ROC-AUC)
of 92.8% in the development set and 94.9% in the
validation set. A cutoff value of R-OPS > 330 showed
high sensitivity (93.9%) and specificity (79.9%) [8].
In comparison with other algorithms like the Risk
of Malignancy Index (RMI) and the Risk of Ovarian
Malignancy Algorithm (ROMA), R-OPS showed
superior performance in postmenopausal women.
It was found to be more accurate when combining
ultrasound imaging with serum markers CA125 and
HE4 for predicting malignancy in ovarian masses [9].
While the R-OPS has shown promising results,
further prospective studies in different settings are
necessary to confirm its effectiveness. The need for
such studies is emphasized to ensure the reliability
and generalizability of the R-OPS across diverse
populations. Therefore, we conducted the study
with two main objectives: to evaluate the diagnostic
value of the R-OPS scoring system in preoperative
HUE JOURNAL OF MEDICINE AND PHARMACY ISSN 3030-4318; eISSN: 3030-4326HUE JOURNAL OF MEDICINE AND PHARMACY ISSN 3030-4318; eISSN: 3030-4326
100 101
Hue Journal of Medicine and Pharmacy, Volume 15, No.2/2025 Hue Journal of Medicine and Pharmacy, Volume 15, No.2/2025
ovarian cancer diagnosis and to compare the
diagnostic performance between the R-OPS score
and ROMA algorithm in preoperative ovarian cancer
diagnosis.
2. METHODOLOGY
Design and setting
This prospective cohort investigation was
conducted at two tertiary healthcare institutions in
Vietnam - Hue University of Medicine and Pharmacy
Hospital and Hue Central Hospital. Data collection
occurred from January 2024 to January 2025.
Inclusion criteria: Eligible participants were
patients presenting with ovarian tumors who
required one of the following interventions: surgical
interventions, tumor biopsy or cytological analysis of
abdominal fluid. All cases underwent postoperative
pathological examination. Preoperative assessment
included an ultrasound examination of the ovarian
masses. Informed consent was obtained from all
study participants.
Exclusion criteria: Patients were excluded from
the study if they fall under any of the following
conditions:
- Postoperative diagnosis was pseudocysts,
hydrosalpinx, para-ovarian cysts, or uterine fibroids.
- Concurrent pregnancy with ovarian tumor
- Prior history of:
+ Chemotherapy for ovarian malignancy
+ Surgical intervention for ovarian cancer
+ Any known malignant conditions
- Secondary ovarian cancer
- Presence of concurrent malignancies (e.g.,
endometrial or thyroid cancer)
- Incomplete diagnostic data (ultrasound
findings and/or biomarker results)
Sample size
The sample size for the development set was
determined using the formula proposed by Hanley
et al. to estimate the sample size required to achieve
an Area Under the Receiver Operating Characteristic
Curve (ROC-AUC) [10].
We set an expected AUC of 90%, the width of
the confidence interval of 0.15, and a confidence
level of 95%. The calculation was informed by the
ROC-AUC data from an estimated ovarian cancer
(OC) prevalence of 13% among women presenting
with a pelvic mass [6]. Consequently, a minimum
of 191 subjects was indicated, with adjustments for
an anticipated 10% dropout rate leading to a final
requirement of 215 subjects. The sample size for the
validation cohort was established to be equivalent to
that of the development cohort.
Study protocols
Transabdominal and transvaginal
ultrasonography were employed to identify an
ovarian tumor in a patient presenting with a pelvic
mass during a gynecological examination after
administrative interviews, comprehensive medical
history compilation, and physical assessment.
The morphologic features assessed included
multilocularity, presence of solid components,
bilaterality, ascites, and intra-abdominal metastases
by the consensus established by the International
Ovarian Tumor Analysis (IOTA) group [11]. Serum
samples were obtained for CA-125 and HE4 assays
prior to the surgical excision of the ovarian tumors.
A thorough histopathological evaluation was
performed based on the criteria and classification
the World Health Organization (WHO) defined in
2014 [12].
Preoperative blood samples were collected
and processed within three hours, subjected to
centrifugation, and stored as serum at -80 °C until
assay. Analyses of serum biomarkers were conducted
in strict compliance with clinical operational
protocols, utilizing a Cobas 6000 analyzer series
with Elecsys HE4 and Elecsys CA125 II reagent kits
(Roche Diagnostics, Indianapolis, IN, USA), following
the manufacturers’ instructions for determining
concentrations.
The patient was scheduled for surgery via an
appropriate approach following a departmental
consultation. During the surgical intervention, the
surgeon conducted an initial assessment of the
tumors characteristics and assigned a cancer stage
according to the FIGO classification (2014) based on
the visual assessment of the tumor [13].
The newly developed R-OPS (Rajavithi Ovarian
Cancer Predictive Score) scoring system integrates
menopausal status with specific ultrasound
characteristics and serum CA125 and HE4 levels
into a predictive scoring formula designed to assess
ovarian cancer risk:
R-OPS = M × U × (CA125 × HE4)1/2 [8]
The values for CA125 and HE4 were recorded in
U/mL and pM/L, respectively. The variable M was
assigned a code of 1 for premenopausal women
and 3 for postmenopausal women. Additionally, the
variable U was coded as 1 in the absence of a solid
lesion and 6 in the presence of a solid lesion.
The ROMA algorithm was developed utilizing
serum levels of CA125 (U/mL) and HE4 (pM/L), in
conjunction with the patient’s menopausal status.
The predictive index (PI) was computed following
the methodology outlined by Moore.et al [6]:
HUE JOURNAL OF MEDICINE AND PHARMACY ISSN 3030-4318; eISSN: 3030-4326HUE JOURNAL OF MEDICINE AND PHARMACY ISSN 3030-4318; eISSN: 3030-4326
102 103
Hue Journal of Medicine and Pharmacy, Volume 15, No.2/2025 Hue Journal of Medicine and Pharmacy, Volume 15, No.2/2025
ROMA (%) = exp(PI) / [1 + exp(PI)] * 100
PI (Predictive Index) is calculated as:
Pre-menopausal women: PI = -12.0 + 2.38 *
Ln(HE4) + 0.0626 * Ln(CA125)
Post-menopausal women: PI = -8.09 + 1.04 *
Ln(HE4) + 0.732 * Ln(CA125)
Statistical analysis
The statistical analysis was conducted utilizing
SPSS version 27.0. We represented continuous
data using mean and standard deviation (SD) or
median and interquartile range (IQR) based on their
distribution. Continuous variables were compared
using the Student’s T-test and Mann-Whitney U
test, as appropriate, based on data distribution.
Categorical variables were analyzed using the chi-
squared or Fishers exact test, depending on the
sample size and distribution characteristics. The
predictive performance was assessed by calculating
the ROC-AUC and the corresponding 95% confidence
interval (CI). Additionally, we computed key metrics,
including sensitivity (Sn), specificity (Sp), and both
positive (PPV) and negative predictive values (NPV).
The diagnostic efficacy of the R-OPS was evaluated
in comparison to the ROMA diagnostic tests through
the analysis of the areas under the receiver operating
characteristic (ROC) curves [14].
Ethical approval
The research obtained ethical approval from the
Ethical Committee for Biomedical Research at the
Hue University of Medicine and Pharmacy Hospital
(Decision No. 17BV/24). All the study subjects were
provided written informed consent.
3. RESULTS
In our research, we analyzed a cohort of 215 cases, revealing that 146 were identified with benign tumors,
while 69 cases presented ovarian cancer. Detailed demographic and clinical characteristics of the participants
are summarized in Table 1.
Table 1. Characteristics of women presenting with a pelvic or adnexal mass.
Variables
Ovarian cancer
(n=69)
Benign
(n=146) P
N%N%
Group of age
< 20 2 2.9 10 6.8
<0.001*
20 - 29 3 4.3 35 24.0
30 - 39 4 5.8 38 26.0
40 - 49 16 23.2 34 23.3
50 - 59 22 31.9 13 8.9
≥ 60 22 31.9 16 11.0
Age of patients mean (SD) 53.2 (140) 38.8 (154) <0.001**
Menopausal status Post-menopause 43 62.3 29 19.9 <0.001*
Pre-menopause 26 37.7 117 80.1
Clinical
characteristics of
ovarian tumors
Abdominal
distension 10 14.5 8 5.5 0.026*
Palpable mass 64 92.8 140 95.6 0.294*
Easily mobile 25 36.2 129 88.4 <0.001*
Well-defined
margins 36 52.2 124 84.9 <0.001*
Firm consistency 61 88.4 122 83.6 0.352*
*Pearson Chi-square ,** Independent sample T - Test
Ovarian cancer patients had a mean age of 53.2
years (SD=14.0), significantly older than the 38.8
years (SD=15.4) of benign cases (P<0.001). Most
cancer patients were in the older age brackets:
31.9% (n=22) in both the 50 - 59 and ≥60 groups.
In contrast, benign cases were more common in
younger groups, with 26.0% (n=38) in the 30 - 39
age range and 24.0% (n=35) in the 20-29 range.
Additionally, 62.3% (n=43) of cancer patients were
postmenopausal, compared to only 19.9% (n=29)
of benign cases (P<0.001). Furthermore, cancer
patients experienced more abdominal distension
HUE JOURNAL OF MEDICINE AND PHARMACY ISSN 3030-4318; eISSN: 3030-4326HUE JOURNAL OF MEDICINE AND PHARMACY ISSN 3030-4318; eISSN: 3030-4326
102 103
Hue Journal of Medicine and Pharmacy, Volume 15, No.2/2025 Hue Journal of Medicine and Pharmacy, Volume 15, No.2/2025
(14.5%) than benign cases (5.5%) with P=0.026. The
rate of tumor mobility was significantly lower in
cancer patients, with only 36.2% being easily mobile,
compared to 88.4% in benign cases (P<0.001). Well-
defined tumor margins were present in 52.2% of
malignant tumors versus 84.9% of benign ones
(P<0.001). However, no significant differences were
found regarding palpable masses (92.8% vs 95.6%,
P=0.294) or firm consistency (88.4% vs 83.6%,
P=0.352).
The data presented in Table 3 highlighted
the key differences between malignant and
benign cases of ovarian tumors. Notably, there
is a significantly higher prevalence of ascites in
ovarian cancer cases (58.0% vs. 1.4%, P<0.001).
Additionally, malignant tumors exhibit more solid
components (49.3% vs. 23.3%, P<0.001) and a more
considerable rate of intra-abdominal metastasis
(20.3% vs. 0.7%, P<0.001). Furthermore, 34.8%
of malignant cases involved large tumors (greater
than 12 cm), compared to only 7.5% among benign
cases (P<0.001). Tumor marker levels were found
to be significantly higher in ovarian cancer cases.
Specifically, the levels of CA125 in malignant cases
had a median of 158.4 U/mL (IQR: 35.0-790.3),
compared to 18.4 U/mL (IQR: 13.8-30.4) in benign
cases. HE4 levels also showed significant elevation,
with malignant cases having a median of 132.8
pmol/mL (IQR: 59.9-382.1) versus 41.0 pmol/mL
(IQR: 34.1-51.5) in benign cases. Both of these
differences were statistically significant (P<0.001).
Another particularly noteworthy finding is the
prevalence of epithelial-stromal tumors in ovarian
cancer cases, which accounted for 94.2%. In
contrast, benign cases displayed a more balanced
distribution, with 52.1% epithelial-stromal tumors
and 41.1% germ cell tumors. This difference is also
statistically significant (P<0.001).
Table 3. Sonography characteristics, biomarker serums, and histopathological distribution
in women with adnexal mass
Variables
Ovarian cancer
(n=69)
Benign
(n=146) P
N % N %
Characteristics of US
findings
Solid component 34 49.3 34 23.3 <0.001*
Multiloculation 10 14.5 28 19.2 0.400*
Bilaterality 9 13.0 17 11.6 0.769*
Ascites 40 58.0 2 1.4 <0.001**
Intraabdominal metastasis 14 20.3 1 0.7 <0.001**
Size of tumor (cm)
<7 20 29.0 72 49.3
<0.001*7 - 12 25 36.2 63 43.2
>12 24 34.8 11 7.5
CA125 (U/mL) (Q25% - Q75%) 158.4
(35.0 - 790.3)
18.4
(13.8 - 30.4) <0.001***
HE4 (pmol/mL) (Q25% - Q75%) 132.8
(59.9 - 382.1)
41.0
(34.1 - 51.5) <0.001***
Histopathology
Epithelial-stromal tumor 65 94.2 76 52.1
<0.001**Germ cell tumor 2 2.9 60 41.1
Sex cord-stromal tumor 2 2.9 10 6.8
*Pearson Chi-square ,** Fisher’s Exact test, ***Mann - Whitney U Test.
Table 3 and Figure 1 demonstrated that the R-OPS score was highly effective for predicting ovarian cancer.
The analysis of the Receiver Operating Characteristic (ROC) curve showed an Area Under the Curve (AUC)
of 91.4% (95% CI: 87.0 - 95.7%), indicating substantial diagnostic accuracy. With a cut-off value of >330, the
test exhibited a specificity of 95.2% and a sensitivity of 71.0%. The positive predictive value (PPV) was 86.0%,
while the negative predictive value (NPV) was 87.0%.
HUE JOURNAL OF MEDICINE AND PHARMACY ISSN 3030-4318; eISSN: 3030-4326HUE JOURNAL OF MEDICINE AND PHARMACY ISSN 3030-4318; eISSN: 3030-4326
104 105
Hue Journal of Medicine and Pharmacy, Volume 15, No.2/2025 Hue Journal of Medicine and Pharmacy, Volume 15, No.2/2025
Table 3. Validity of R-OPS score for prediction ovarian cancer at standard cut-off.
AUC (%)
(95% CI) Se (%) Sp (%) PPV (%) NPV (%)
>330 91.4
(87.0 - 95.7) 71.0 95.2 86.0 87.3%
Figure 1. Receiver operating characteristic curve of R-OPS for prediction of ovarian cancer
The R-OPS score outperformed the ROMA score in distinguishing ovarian cancer from non-cancer cases,
showing a 5.9% higher AUC (z=3.708, P<0.001). This difference was statistically significant, with a standard
error of 0.183.
Figure 2. Comparative validation of the discriminative ability between the R-OPS and ROMA
Table 4. Pair-Sample Area Difference Under the ROC Curves
Test Result Pair(s) Asymptotic AUC Difference
(%)
Std. Error Differ-
ence
z p
Cancer vs Non cancer
R-OPS - ROMA 3.708 <0.001 5.9 0.183