32
Research Article
Dose optimization of meropenem for critically ill patients by
pharmacokinetic/ pharmacodynamic simulation
Le Dinh Vana, Nguyen Thi Cuca, Nguyen Hoang Anh (Jr)a, Nguyen Tran Nam Tiena, Nguyen Dang Minh Vuongb,
Bui Van Cuongc, Pham The Thachc, Do Ngoc Sonc, Nguyen Hoang Anha,b,*, Vu Dinh Hoaa
aNational DI & ADR Centre, Hanoi University of Pharmacy, 15 Le Thanh Tong, Hanoi, Vietnam
bClinical Pharmacy and Drug Information Unit, Department of Pharmacy, Bach Mai Hospital, 78 Giai Phong, Hanoi, Vietnam
cDepartment of Intensive Care, Bach Mai Hospital, 78 Giai Phong, Hanoi, Vietnam
Journal of Pharmaceutical Research and Drug Information, 2023, 14 (5): 32-39
A R T I C L E I N F O
Article history
Received 26 Juin 2023
Revised 20 Oct 2023
Accepted 27 Oct 2023
Keywords
Meropenem
Pharmacokinetic/
pharmacodynamic
Dosing regimen
Critically ill patients
Monte Carlo
Simulation
A B S T R A C T
Recent pharmacokinetic/pharmacodynamic (PK/PD) studies revealed that
prolonged infusion, especially continuous infusion could improve probability
of target attainment (PTA) of meropenem. However, the implementation of
continuous meropenem infusion in the clinical environment can be limited
due to the solution’s instability, which results in a diminished effectiveness
of the drug. The two-step infusion approach has been expected as a
promising novel approach to address this issue. The aim of this study was to
assess the probability of target attainment for finding the optimal dosage
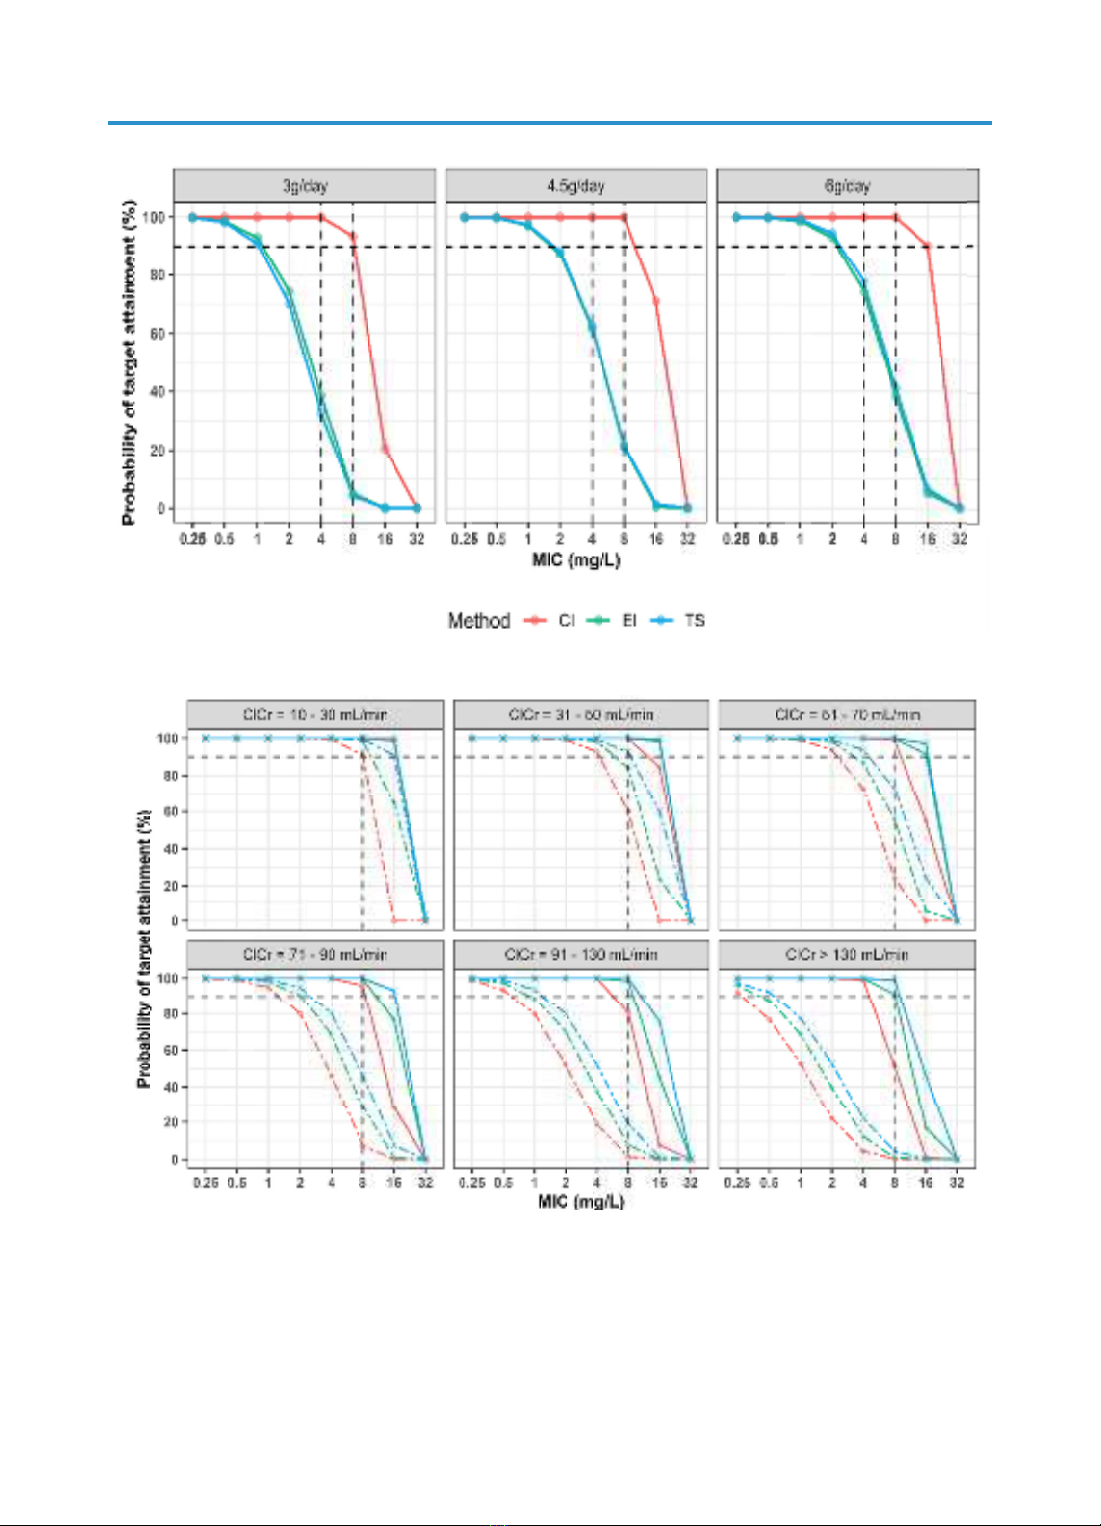
regimens of meropenem in critically ill patients. Monte Carlo simulation
using Ehmann population pharmacokinetic model was performed to evaluate
the following different intravenous infusion regimens including extended
infusion (EI), continuous infusion (CI) and two-step infusion (TS) with three
total daily doses (3 g, 4.5 g and 6 g). The PK/PD target was defined as the
probability of achieving a fractional time above the MIC of 98% on the
first day of therapy. Subsequently, dosing regimens were suggested based
on renal function which was estimated by the Cockcroft & Gault creatinine
clearance (Clcr =10-30, 31-50, 51-70, 71-90, 91-130, and over 130 mL/min).
Simulations also revealed that the 1000 mg q8h EI regimen is suitable to
reach MICs of 1 mg/L, regardless of the patient’s renal function. For higher
MICs and up to 16 mg/L, continuous infusion therapy with a loading dose
of 0.5 g and a maintenance dose of 3 g to 6 g per day should be considered
in clinical practice. The two-step infusion approach did not demonstrate
superior PTA compared to extended infusion therapy and was significantly
lower than that of continuous infusion at the same dosage level.
* Corresponding author: Nguyen Hoang Anh; email address: anhnh@hup.edu.vn
https://doi.org/10.59882/1859-364X/136
Journal homepage: jprdi.vn/JP
Journal of Pharmaceutical Research and Drug Information
An official journal of Hanoi University of Pharmacy
33
Introduction
Meropenem is a broad-spectrum
carbapenem antibiotic which is commonly
prescribed for treatment of severe infections
caused by multidrug-resistant bacteria [1]. In
critically ill patients, pathophysiological
changes, and the frequent use of invasive
interventions for therapy might substantially
influence pharmacokinetics of meropenem,
leading to an increased risk of inadequate
antibiotic exposure [2]. Moreover, the
emergence of antimicrobial resistance creates
a significant challenge for clinicians in
selecting an optimal dosing regimen to improve
clinical outcomes.
As meropenem exhibits time-dependent
bactericidal activity, the PK/PD index
describing its antimicrobial efficacy is the
percentage of the time during dosing interval
that the free plasma concentration exceeds
the minimum inhibitory concentration
(MIC) value of the pathogens (%fT >MIC)
[1]. Optimizing the dosing strategy is crucial
for rapidly achieving effective
concentrations and prolonging the period of
time above MIC from the very first day of
therapy. Previous PK/PD studies have
shown that prolonged infusion, especially
continuous infusion of meropenem could
improve %fT >MIC index [3-5]. However,
meropenem solution is stable for only
approximately 6 hours at room temperature,
meropenem may be considered an
inappropriate agent for the implementation
of continuous intravenous infusion [4].
Eguchi et al. had suggested that the
utilization of two-step infusion method
(rapid first-step infusion and slow second-
step infusion) not only ensures the drug
stability but also enhances the probability of
PK/PD target attainment of meropenem
(PTA) [6]. Therefore, this study aimed to
assess the PTA in order to identify the
optimal dosing regimens and infusion
method for meropenem in critically ill
patients.
Materials and Methods
Pharmacokinetic model
A published two compartment model with
first-order elimination from Ehmann’s
research was selected for simulation (7). This
model was developed based on a prospective
observational study in a heterogeneous
population of 48 critically ill patients with a
total of 1376 blood samples over 4 days at an
Intensive Care Units (ICU) in Germany. The
summary of the Ehmann model is presented
in Table 1.
Table 1 - Population pharmacokinetic parameters of
meropenem from Ehmann popPK model (7)
CL: total clearance; Q: intercompartmental
clearance; V1: central volume of distribution;
V2: peripheral volume of distribution; IIV:
inter-individual variability; IOV: inter-occasion
variability
Methods
Monte Carlo simulations (nsimulations = 1000)
were performed to assess the PTA value of
various dosage regimens. The patient
characteristics in the simulated population are
established according to the covariates
identified in Ehmann model including
creatinine clearance (ClCr) estimated using
the Cockcroft-Gault equation, total body
weight (WT) and serum albumin (ALB) [7].
Pharmacokinetic/pharmacodynamic target
Le Dinh Van et al. J.Pharm.Res-DI. 2023, 14(5): 32-39
Pa
C
aram
CL (L
V1
Q (L
V2
mete
(L)
L/h)
(L)
er
9.
Typ
25 (
pical
(IIV:
7.89
16.1
l val
27.1
9 (IIV
2
1 (IIV
lue (
1%,
V: 31
28.4
V: 16
(IIV,
IOV:
1.5%
6.7%
, IOV
12.
%)
%)
V)
5%)
)
34
In an effort to optimize treatment efficacy for
the first day, a target of 98% fT > MIC over 24
hours was selected to evaluate for investigated
dosage regimen [7]. A PTA threshold of 90%
was considered optimal [2].
Three infusion strategies including
extended infusion (EI), continuous infusion
(CI) and two-step infusion (TS) (rapid first-
step infusion and slow second-step infusion)
were investigated with three total daily doses
(3 g, 4.5 g, 6 g), as detailed in Table 2.
Patients receiving CI therapy were
administered an initial loading dose of 500
mg infusing over 0.5h [1].
Table 2 - Intravenous dosing regimens of
meropenem
SI: short-term infusion, EI: extended
infusion, CI: continuous infusion, TS: two-
step; EI3h: infusing over 3 hours, SI0.5h:
infusing over 0.5 hours; q8h: every 8 hours;
*: for CI treatment at day 1, the initial
loading dose of 500mg is infused over 0.5h.
Probability of target attainment analysis
First, the impact of different infusion
therapies on the PTA were investigated (Table
2). For each patient characteristic,
simulations were performed for fixing
covariate values with creatinine clearance,
total body weight, and serum albumin fixed
to 86.5 mL/min, 50 kg and 2.57 g/dL,
respectively (this information represents the
typical characteristics observed in critically
ill patients at a tertiary hospital in Vietnam
from Quan A. Truong research (27 patients,
2022)) [2].
Second, PTA analysis based on six
simulations (1000 virtual patients per
simulation) was performed for three total
daily doses by varying creatinine clearance
(ClCr) ranges, including 10-30, 31-50, 51-70,
71-90, 91-130 and over 130 mL/min
(augmented renal clearance, ARC) while
fixing the remaining ones to the covariate
values stated above.
Finally, we recommended a meropenem
dosing regimen for each patient group at
various MIC values based on the following
criteria, in order of preference: [1] PTA
90%; [2] lower total daily dose; [3] the
complexity of the intravenous infusion
therapy, in order of EI, TS, CI.
Data analysis and processing
The RsSimulx package (R version 4.2.2)
was employed for Monte Carlo simulation.
Additionally, the ggplot2 R-package (R
version 4.2.2) was used for data visualization
purposes.
Results and Discussions
Results
PK/PD analysis and treatment outcomes
Figure 1 illustrates the PTAs of 98% fT
>MIC for different meropenem regimens
(Table 2) in a typical patient with creatinine
clearance, total body weight, and serum
albumin fixed to 86.5 mL/min, 50 kg and
2.57 g/dL, respectively [2]. In the same level
of total daily dose, the PTAs of two-step
infusion therapy (TS) was not apparently
different to that of extended infusion therapy
Le Dinh Van et al. J.Pharm.Res-DI. 2023, 14(5): 32-39
Dail
300
450
600
ly do
00 m
00 m
00 m
ose
mg
mg
mg
E
E
E
Ext
infu
EI1:
EI3
EI2:
EI3
EI3:
EI3
end
fusio
1000
3h q8
1500
3h q8
2000
3h q8
ded
on
0mg
8h
0mg
8h
0mg
8h
g
g
g
Co
in
CI1
CI2
CI3
ontin
nfus
1:
30
q2
2:
45
q2
3:
60
q2
nuo
sion
000m
24h
500m
24h
000m
24h
us
n*
mg
mg
mg
T
TS
5
TS
10
TS
15
Two
infu
S1:
(
SI0
00m
q
S2:
(
SI0
000m
q
S3:
(
SI0
500m
q
o
-
ste
usio
(500
.5h +
mg EI
q8h
(500
.5h +
mg E
q8h
(500
.5h +
mg E
q8h
ep
on
0 mg
+
I3h)
0 mg
+
EI3h)
0 mg
+
EI3h)
g
g
)
g
)
35
(EI) for all MIC values, and significantly
lower than that of continuous infusion
therapy (CI) for MICs of 4 mg/L.
Consequently, TS dosing regimens were
excluded from further simulation analysis.
The PTA values regarding creatinine
Le Dinh Van et al. J.Pharm.Res-DI. 2023, 14(5): 32-39
Figure 1. PTA of 98% fT >MIC for meropenem regimens in the typical patient with Clcr = 86.5 mL/min,
WT = 50 kg, ALB = 2.57 g/dL.
Figure 2. PTA of 98% fT >MIC for meropenem regimens in six renal function groups (EI1: 1000mg EI3h q8h,
EI2: 1500mg EI3h q8h, EI3: 2000 mg EI3h q8h, CI1: 3000mg q24h, CI2: 4500mg q24h, CI3: 6000mg q24h)
36
clearance of CI dosing regimens and EI
dosing regimens were depicted in Figure 2.
Overall, PTA was dependent on the level of
creatinine clearance, or more precisely,
decreasing with increasing Clcr. For the
isolates belonging to the R category
(resistant, i.e., MIC = 32 mg/L), none of
dosing regimens resulted in effective
exposure (PTA 90%). However, for isolated
pathogens belonging to the I category
(intermediate, MIC 8 mg/L) and the S
category (susceptible, MIC 4 mg/L), a dose
of 3 g/day CI achieved PTA 90% in non-
ARC groups and ARC group, respectively.
Meanwhile, 6g/day EI would only cover
isolates with MICs of 8 mg/L in patients
with renal insufficiency (Clcr ≤ 50 mL/min).
Neither the dose of 3 g/day EI nor the dose of
4.5 g/day EI is effective in almost less
susceptible bacteria with MICs of ≥ 4 mg/L.
Recommended dosing regimens
A tabular dosing overview was generated
considering Clcr of the patients and MIC
value of pathogens, as shown in Table 3.
None of the investigated dosing regimens
could meet the predefined criteria in patient
subgroups with ClCr > 90 mL/min for treating
pathogen isolates with MICs of 16 mg/L.
Notably, the dose of 3 g/day EI was
recommended for isolates with MICs of 1
mg/L in most of renal function groups. For
higher MIC values (MIC = 4, 8 mg/L) and high
renal function, continuous infusion therapy
should be considered to attain PTA ≥ 90%.
Discussions
Due to more challenges in treating serious
life-threatening infections, the judicious
selection of meropenem dosing regimen is
vastly important to optimize the probability
of achieving the PK/PD target [1]. Previously
published studies have investigated the
bacteriostatic and bactericidal activity of
meropenem linked to fT > MIC of 20% and
40%, respectively [8]. To significantly
increase clinical cure and bacteriological
eradication in critically ill patients with
serious bacterial infections, a target of 100%
fT > MIC should be required [7]. Additional,
in vitro and in vivo studies have even
suggested a more intensive target of 100% fT
> 4xMIC to improve antimicrobial efficacy
in ICU settings with high rates of resistant
Le Dinh Van et al. J.Pharm.Res-DI. 2023, 14(5): 32-39
Table 3. The recommended dosing regimen in critically ill patients based on PTA analysis
(m
9
ClC
mL/m
10
-
31
-
51
-
71
-
91
-
> 1
Cr
/min)
-
30
-
50
-
70
-
90
130
130
)
0.25
EI1
EI1
EI1
EI1
EI1
EI1
5
0.5
EI1
EI1
EI1
EI1
EI1
CI1
(EI3
5
1
1
1
1
1
1
3)
(
1
EI1
EI1
EI1
EI1
CI1
(EI3)
CI1
)
2
EI
EI
EI
CI
(EI
CI
CI
2
I1
I1
I1
I1
I2)
I1
I1
M
MIC
(m
4
EI1
EI1
CI1
(EI3
CI1
CI1
CI1
mg/L
1
3)
1
1
1
/L)
E
C
(E
8
EI1
CI1
EI3)
CI1
CI1
CI2
CI2
(
16
CI1
EI3)
CI2
CI2
CI3
-
-
)
3
32
-
-
-
-
-
-