
49
Journal of Health and Development Studies (Vol.08, No.01-2024)
Tran Van Son et al.
DOI: https://doi.org/10.38148/JHDS.0801SKPT24-011
ABSTRACT
Objective: This study aims at describing the mortality situation in Bac Ninh province from 2017-2020
Methods: A cross-sectional study design was applied. Data regarding individual mortality during 2017-
2020 in Bac Ninh province was collected from mortality registration system (namely A6/YTCS). In
particular, information about each mortality was collected, including: age, gender, address, date of mortality
and cause of mortality. Descriptive statistics was used to show the mortality rate between age groups and
gender. A log-scale was used to show the pattern across age groups in each male and female mortality.
Results: The results show that the mortality rate (per 1,000 people) of children under 5 years old was
lowest among age groups in 2019 compared to other years (0.73 mortality per 1,000 people). However,
when comparing the under-5-mortality rate across four years, the mentioned figure was higher than 2017,
2018 and 2020. During the entire period 2017-2020, the age group over 80 years old had the highest
mortality rate (per 1,000 people) from 40.82 (in 2017) to 69.90 (in 2020). For gender comparison, male
had higher mortality rates than female in all age groups
Conclusions: Among children under 5 years old, the mortality rate were highest in 2019 when comparing
with the other years, including 2017, 2018 and 2019. Conversely, the lowest mortality trend was observed
in 2017 across most age groups, except for the 20-24 and 35-39 age groups. Throughout the period, the
mortality rate consistently rose in the over 80 age group.
Keywords: Current situation, mortality, mortality rate.
Corresponding author: Nguyen Van Thang
Email: Nguyenvanthang187@gmail.com
1Bac Ninh Centers for Disease Control and
prevention
2
Hanoi University of Public Health
3
The Training and Research Institute on Child
Health – Vietnam National Children’s Hospital
4
Vietnam National Children’s Hospital
Current mortality situation in Bac Ninh province in the period 2017-2020
Tran Van Son1, Ngo Thi Xuan1, Cao Thi Nhung2, Minh Nguyen2, Vu Tri Duc2,3, Nguyen Van
Thang4, Nguyen Thi Trang Nhung2,3
ORIGINAL ARTICLES
Submited: 14 January, 2024
Revised version received: 20 February, 2024
Published: 29 February, 2024
DOI: https://doi.org/10.38148/JHDS.0801SKPT24-011
INTRODUCTION
Mortality rate is one of the crucial indicators
to measure public health. The mortality rate
is used to evaluate the level of mortality of
a specific population, a region, a country,
or worldwide (1). In addition, the mortality
rate also evaluates mortality attributed to a
diseases or risk factors (2,3). This index can
also reflect the actual prevalence of a disease
and may be used to assess the effectiveness of
medical care in each nation (2). For example,
the United States of America (USA) used
the reduction in cancer mortality rate as
an implication of the improvement in the
access to health care (4)the American Cancer
Society estimates the numbers of new cancer
cases and deaths that will occur in the United
States in the current year and compiles
the most recent data on cancer incidence,

50
Journal of Health and Development Studies (Vol.08, No.01-2024)
mortality, and survival. Incidence data were
collected by the Surveillance, Epidemiology,
and End Results Program; the National
Program of Cancer Registries; and the North
American Association of Central Cancer
Registries. Mortality data were collected by
the National Center for Health Statistics.
In 2017, 1,688,780 new cancer cases and
600,920 cancer deaths are projected to occur
in the United States. For all sites combined,
the cancer incidence rate is 20% higher in
men than in women, while the cancer death
rate is 40% higher. However, sex disparities
vary by cancer type. For example, thyroid
cancer incidence rates are 3-fold higher in
women than in men (21 vs 7 per 100,000
population. The author shown that due to this
enhancement, the mortality rate of cancer had
dropped from its peak of 215.1 (per 100,000
population) in 1991 to 161.2 in 2014 (per
100,000 population), equivalent to 25% (4)
the American Cancer Society estimates the
numbers of new cancer cases and deaths
that will occur in the United States in the
current year and compiles the most recent
data on cancer incidence, mortality, and
survival. Incidence data were collected by
the Surveillance, Epidemiology, and End
Results Program; the National Program of
Cancer Registries; and the North American
Association of Central Cancer Registries.
Mortality data were collected by the National
Center for Health Statistics. In 2017, 1,688,780
new cancer cases and 600,920 cancer deaths
are projected to occur in the United States.
For all sites combined, the cancer incidence
rate is 20% higher in men than in women,
while the cancer death rate is 40% higher.
However, sex disparities vary by cancer type.
For example, thyroid cancer incidence rates
are 3-fold higher in women than in men (21
vs 7 per 100,000 population. Recent study in
the USA also claimed that a 2.4% reduction
in cancer mortality rate during 2017-2018
as an indicator for the effectiveness of early
detection and improved cancer treatment (5).
In Vietnam, the mortality rate due to non-
communicable diseases accounted for 77%
of the total number of mortality in 2016.
Among these cases, 44% were individuals
over 70 years old (6). Based on data from the
Health Statistics Yearbook, the mortality rate
of infants under the age of one was between
13.9 and 14.4 mortality per 1,000 live births
during the period from 2017 to 2019 (7–9).
Mortality indices are essential for quantifying
population health status and measuring the
health development of a country (2). Mortality
rates also measure the burden and compare the
impact of disease (10). Variations in mortality
rates over time reflect evolving patterns in the
causes of mortality over time (2). Therefore,
mortality data has always been an important
research field in demography and many other
scientific disciplines, including epidemiology,
public health and statistics, etc. The purpose
of common research is to gain the scientific
knowledge necessary to improve lives
through the implementation of appropriate
programs and policies (2). In demographic
research, mortality plays an important role,
because the level of mortality and the level
of birth is an important factor determining the
growth rate of the population (11–13).
Bac Ninh is located in northern Vietnam,
situated in the Red River Delta region,
within the key economic triangle of Ha Noi
- Hai Phong - Quang Ninh, and serves as the
northeastern gateway to the capital city of Ha
Noi (14). Investigating mortality rates in Bac
Ninh province can support evidence-based
disease, accident prevention and treatment
programs through suitable programs and
policies (15). Besides, investigating mortality
rates is an important step that is helpful in
properly allocating resources. This helps
improve health effectively, reduce health
care costs and improve quality of life (10).
Therefore, we conducted this topic to describe
Tran Van Son et al.
DOI: https://doi.org/10.38148/JHDS.0801SKPT24-011

51
Journal of Health and Development Studies (Vol.08, No.01-2024)
the current mortality situation in Bac Ninh
province in the period 2017-2020. This study
might create a basis for future assessments
and intervention programs in this locality.
METHODS
Research design: The cross-sectional study.
Research subjects: The study was conducted
on all human mortality in Bac Ninh province.
Study site and time: Bac Ninh, a province in
the Hong River Delta region of Vietnam, spans
an area of 822.7 Km² and has a population
density of approximately 1,725 people/Km²
(14). It comprises eight districts, including
Bac Ninh City, Tu Son City, Que Vo Town,
Thuan Thanh Town, Yen Phong District, Tien
Du District, Gia Binh District, and Luong
Tai District. The province experiences four
distinct seasons - Spring, Summer, Fall, and
Winter - due to its humid subtropical climate
(16). Summers are hot and humid, while
winters are dry and cold, with an average
annual temperature of around 23.3 degrees
Celsius. Our research spanned the years
2017-2020 (16).
Data source
Mortality data: Mortality data for each
individual during the period 01/01/2017-
12/31/2020 was collected from mortality
registration system (namely A6/YTCS). A6/
YTCS notebooks are designed to collect
information about mortality, including the
number of mortality and the main causes of
mortality as specified in Circular 27/2014/
TT-BYT (17). In particular, information about
each mortality is collected including age,
gender, date of mortality recorded and cause
of mortality. Healthcare professionals such
as doctors, nurses, or medical researchers are
responsible for recording and collecting data.
Population data: Population data is the total
population in the area (as of December 31
every year) in the period 2017-2020. This
data is collected from the Department of
Population and Family Planning of Bac Ninh
province. The total population is divided by
gender and 5-year-old groups (0-4 years old,
5-9 years old, 10-14 years old, ..., 75-79 years
old, ≥ 80 years old).
Data analysis: Mortality data of each record
were cleaned on Microsoft Excel software. The
causes of mortality of each record are coded
by local healthcare professionals according to
the International Classification of Diseases,
Causes of Mortality Coding (International
Classification of Diseases version 10 –
ICD10). Then, the number of mortality for
each year from 2017-2020 was calculated for
each age group (5-year age groups are similar
to population data) and sex groups. Mortality
rate (per 1,000 population) is calculated for
age groups and sex according to the formula:
Mi,j =
Di,j
*1000
Ni,j
In which, Mi,j , Di,j and Ni,j are the mortality rate
(per 1000 population), number of mortality
and population of age group i and sex group j,
respectively. Descriptive statistics were used to
describe the number of mortality and mortality
rates by groups over the years 2017-2020.
To compare the trend in mortality rate
between male and female across age groups,
we present the logarithmic graph of this
indicators. This method is usually used to
show vital statistical indicators (such as
mortality rate) to reveal the underlying trend
(18). The graph included the age group in
horizontal axis, and the logarithmic scale of
mortality rates in the vertical axis according
to the formula as followed: y = log(Mi,j).
Ethics approval: This research is funded
by the National Foundation for Science and
Tran Van Son et al.
DOI: https://doi.org/10.38148/JHDS.0801SKPT24-011

52
Journal of Health and Development Studies (Vol.08, No.01-2024)
Technology Development (NAFOSTED)
under project code 105.08-2019.331. This
study was approved by the Ethics Committee
of the University of Public Health under
Decision No. 020-265/DD-YTCC.
RESULTS
In Bac Ninh, there were approximately 19011
records were retrieved from the A6/YTCS
in this study (Table 1). The mortality rate
(per 1,000 people) of children under 5 years
old in 2019 was the highest (0.73 cases per
1,000 people. This trend is similar in age
groups from 45 to 79 years old. However, the
mortality rate among people over 80 years
old was highest in 2020 with about 69.9
cases per 1,000 people. The mortality rate per
1,000 people was lowest in 2017 in most age
groups except the 20-24 years old group and
the 35-39 years old group. In particular, the
mortality rate in the 20-24 years old group in
2017 was the highest in the 2017-2020 period
(0.44 cases per 1,000 people).
Tran Van Son et al.
DOI: https://doi.org/10.38148/JHDS.0801SKPT24-011
Table 1. Number of mortality and mortality rate (per 1,000 people) by age group in Bac
Ninh in 2017-2020
Age 2017 2018 2019 2020
Number
of
records
Mortality
rate
Number
of
records
Mortality
rate
Number
of
records
Mortality
rate
Number
of
records
Mortality
rate
0-4 19 0.24 31 0.38 60 0.73 54 0.65
5-9 10 0.09 15 0.13 24 0.19 21 0.17
10-14 11 0.13 17 0.18 13 0.13 16 0.16
15-19 16 0.22 23 0.29 29 0.36 36 0.43
20-24 35 0.44 34 0.41 35 0.42 26 0.32
25-29 33 0.31 52 0.46 56 0.52 55 0.53
30-34 43 0.45 53 0.50 58 0.51 60 0.51
35-39 46 0.56 52 0.54 85 0.83 78 0.72
40-44 85 1.16 100 1.26 109 1.35 112 1.42
45-49 115 1.80 155 2.14 175 2.31 151 1.93
50-54 153 2.54 211 3.36 261 4.08 227 3.42
55-59 205 3.34 304 4.43 355 5.31 321 4.65
60-64 185 3.82 280 5.14 390 6.40 398 6.37
65-69 185 6.57 264 7.77 354 9.26 332 7.85
70-74 190 9.40 267 11.27 383 14.60 343 12.87
75-79 292 17.70 434 25.10 471 28.64 411 24.44
80+ 1001 40.82 1503 54.62 2062 66.88 2189 69.90
Total 2624 3795 4920 4830
53
Journal of Health and Development Studies (Vol.08, No.01-2024)
Tran Van Son et al.
DOI: https://doi.org/10.38148/JHDS.0801SKPT24-011
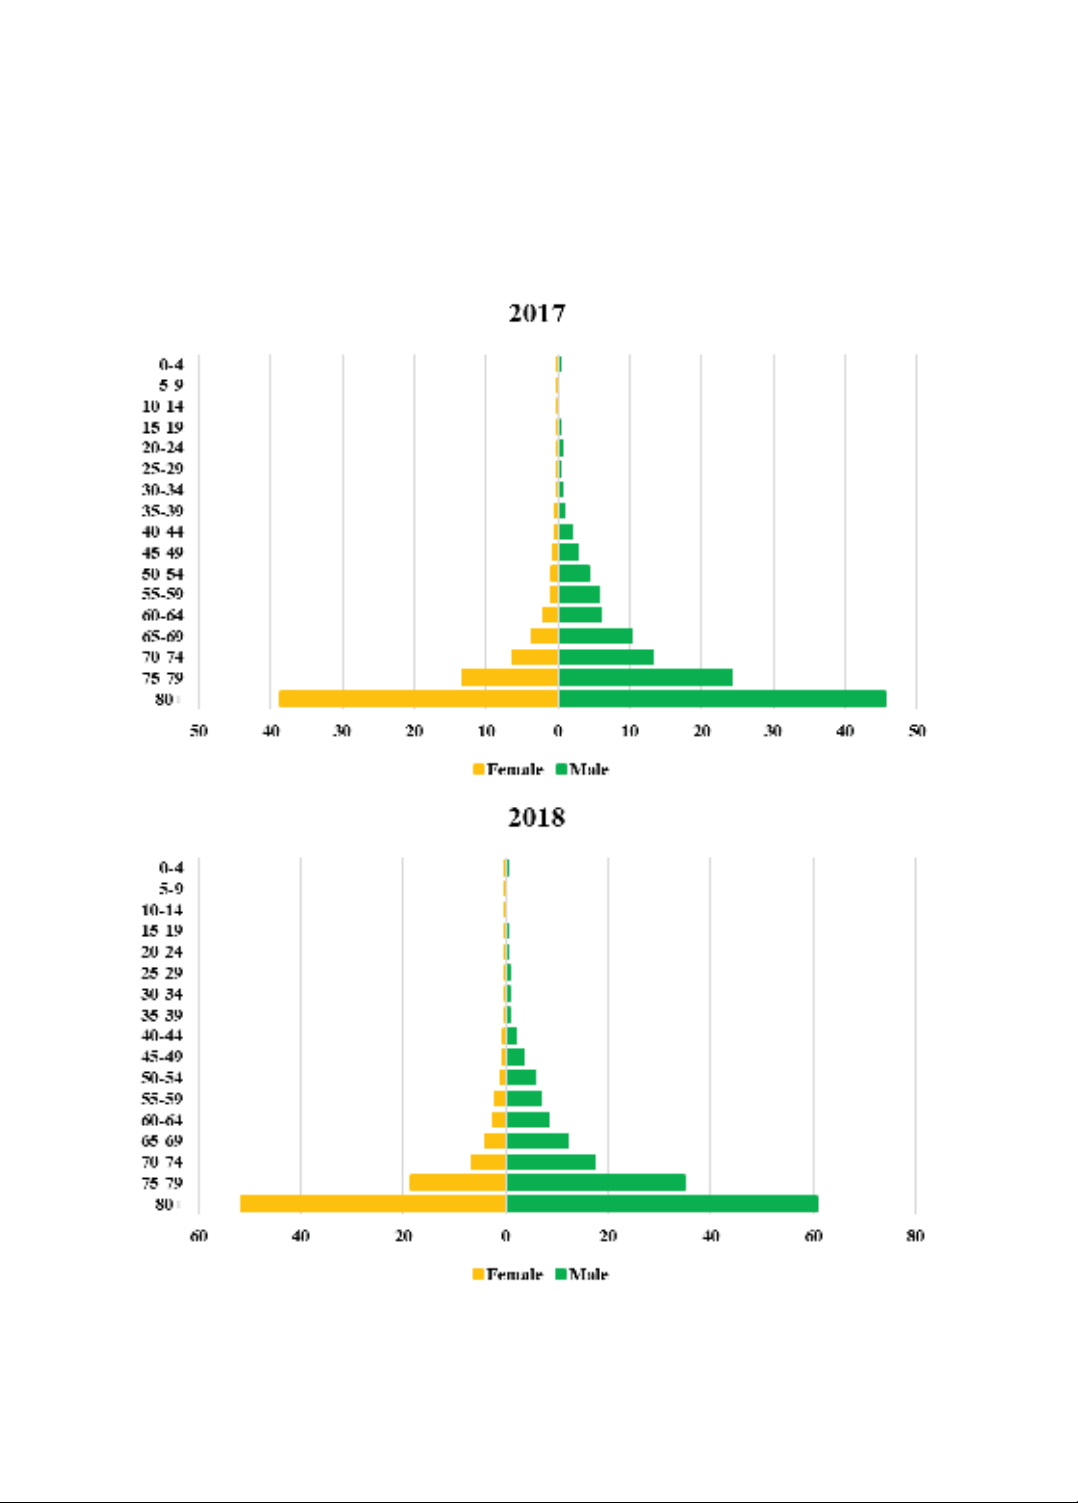
Figure 1 shows that there is uniformity in
the distribution of mortality rate per 100,000
population for each sex across age groups
in the years 2017-2020. Among them, the
mortality rates of people aged 80 and over
is the largest over the years. From 2017-
2020, the female’s mortality rate per 100,000
population were higher than that of male
across age groups.


![Tài liệu Triệu chứng học nội khoa [mới nhất]](https://cdn.tailieu.vn/images/document/thumbnail/2025/20251204/oanhlahet@gmail.com/135x160/5231764900514.jpg)


![Bài giảng Vi sinh vật: Đại cương về miễn dịch và ứng dụng [chuẩn nhất]](https://cdn.tailieu.vn/images/document/thumbnail/2025/20251124/royalnguyen223@gmail.com/135x160/49791764038504.jpg)