
* Corresponding author.
E-mail address: obayinclox@gmail.com (O. Olabanji)
© 2020 by the authors; licensee Growing Science, Canada.
doi: 10.5267/j.dsl.2019.9.001
Decision Science Letters 9 (2020) 21–36
Contents lists available at GrowingScience
Decision Science Letters
ho
mepage: www.GrowingScience.com/d
sl
Pugh matrix and aggregated by extent analysis using trapezoidal fuzzy number for assessing
conceptual designs
Olayinka Olabanjia* and Khumbulani Mpofua
aTshwane University of Technology Pretoria West South Africa, South Africa
C H R O N I C L E A B S T R A C T
Article history:
Received May 7, 2019
Received in revised format:
August 25, 2019
Accepted August 25, 2019
Available online
August
25
,
201
9
Deciding conceptual stage of engineering design to identify an optimal design concept from a
set of alternatives is a task of great interest for manufacturers because it has an impact on
profitability of the manufacturing firms in terms of extending product demand life cycle and
gaining more market share. To achieve this task, design concepts encompassing all required
attributes are developed and the decision is made on the optimal design concept. This article
proposes the modeling of decision making in the conceptual design stage of a product as a multi-
criteria decision making analysis. The proposition is based on the fact that the design concepts
can be decided based on considering the available design features and various sub-features under
each design feature. Pairwise comparison matrix of fuzzy analytic hierarchy process is applied
to determine the weights for all design features and their sub-features depending on the
importance to the design features to the optimal design and contributions of the sub-features to
the performance of the main design features. Fuzzified Pugh matrices are developed for assessing
the availability of the sub-features in the design concept. The cumulative from the Pugh matrices
produced a pairwise comparison matrix for the design features from which the design concepts
are ranked using a minimum degree of possibility. The result obtained show that the decision
process did not arbitrarily apportion weights to the design concepts because of the moderate
differences in the final weights.
.
by the authors; licensee Growing Science, Canada 2020©
Keywords:
Conceptual design
Multicriteria Decision-making
Fuzzified Pugh Matrix
Synthetic Extent Evaluation
Trapezoidal fuzzy number
1. Introduction
Decision making in engineering design towards selection of optimal design of a product or equipment
still remains a major concern for manufacturers because they are usually interested in versatile designs
that can be easily fabricated and gain market acceptance with a prolonged design life cycle before
phasing out (Renzi et al., 2017; Olabanji, 2018). However, these designs cannot be totally achieved
from the desk of conceptual designer alone but rather from collaboration with design experts’ and
decision-making team on conceptual design. An excellent strategy to achieve optimal conceptual
design is usually to identify the design requirements from the users or market demand and also from
the manufacturing point of view (Sa'Ed & Al-Harris, 2014). The identified requirements are matched
with design features, and various sub-features that can be used to characterize the design as described
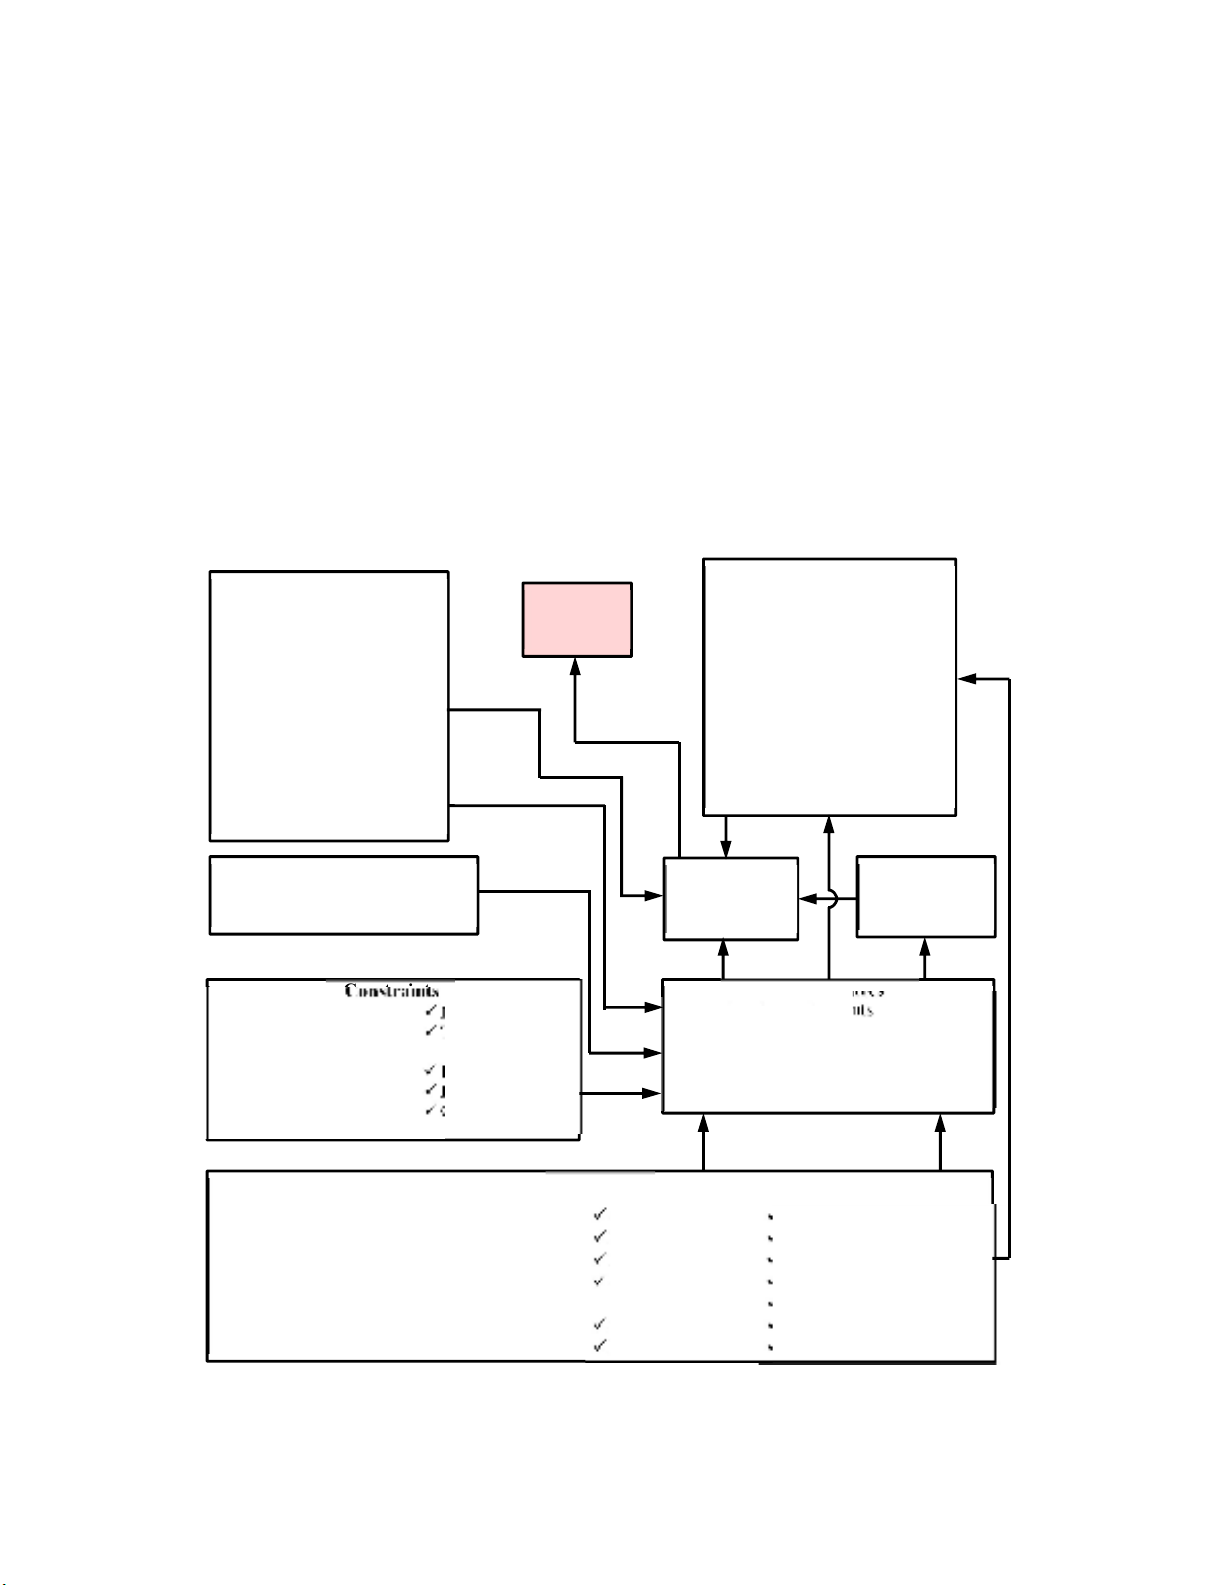
by the decision-making process in engineering design (Fig. 1). In actual fact, having an all-
encompassing design that satisfies all design requirements or features is a goal that seems not
achievable because of the dynamic nature of the market that is swamped with diverse design due to
customers’ requirements (Olabanji & Mpofu, 2014; Renzi et al., 2015; Toh & Miller, 2015). Given
22
this, the design process usually involves the development of different design concepts based on
functional requirements and design features. Hereafter, the decision-making team will collect the
design concepts in order to select the optimal design concept (Okudan & Shirwaiker, 2006; Akay et al.,
2011; Aikhuele, 2017). Decision making in the conceptual phase of engineering design usually involves
an evaluation of the design alternatives based on the identified and grouped design features and sub-
features respectively (Green & Mamtani, 2004; Renzi et al., 2015). Two tasks that are usually done by
design experts and decision-makers are assigning weights to the relative importance of the design
features in the optimal design and assigning weights to the sub-features in order to ascertain and
quantify their contributions to the performance of the design features (Girod et al., 2003; Arjun Raj &
Vinodh, 2016; Chakraborty et al., 2017). Design expert decision for establishing weight of design
features in optimal design has been a long-term source of information for creating comparison among
design features and sub-features when trying to select an optimal design from a set of alternative design
concepts (Derelöv, 2009; Hambali et al., 2009; Hambali et al., 2011). However, there is a need to
establish an objective process for determining these weights in order to reduce further or eliminate the
risk of subjective or bias judgment in the decision process. Further, there is a need to introduce a
systematic approach to the computational process in determining the optimal design concept from the
alternatives.
Fig. 1. Decision Making Process in Engineering Design
Design life span
Part’s Material
Part’s Intricacy
Assembly and Disassembly
Interchangeability of Parts
Stability
Capability
Sub
features
Ease of use
Weight
Safety and Health
Usage Limits
Diagnosability
Maintenance Frequency
Scalability
Customization
Flexibility
Modularity
Commercial off
the shelf parts
Output performance
Rated performance
Cost
Reusability
Geometry
Cleanliness
Testability
Material suitability
Size
Functional Requirements
Maintenance features
Flexibility
Life cycle
Operation
Design Features
Manufacturing
Convertibility
Functionality
Modularity
Identifying Design Requirements
from Multifarious feature from
customers
Manufacturing Cost
Technological
Design Standards
Profit Margin
Development Cost
Company standards
Constraints
Manufacturing
Capability
Safety Regulations
Manufacturing Time
Technological Advancement and
Global competitiveness
Development of
alternative
design concepts
Selection of
Optimal Design
Concept
MODM Models
Weighted Decision Matrix
Analytic Hierarchy Process
Weighted Average
TOPSIS
VICKOR
COPRAS
ELECTRE
ARAS
PROMETHEE
CODAS etc.
MADM Models
Optimization
Uncertainty Modelling
Economic model
Fuzzy AHP
Fuzzy WDM
Fuzzy TOPSIS
Fuzzy VIKOR
FWA
Fuzzy ARAS/Fuzzy COPRAS
Fuzzy CODAS etc.
OPTIMAL
DESIGN
CONCEPT

O. Olabanji and K. Mpofu / Decision Science Letters 9 (2020)
23
Multicriteria Decision Making Analysis (MDMA) has been applied in different field of science,
engineering and management to address the problems of decision making in order to select an optimal
alternative that will suit the decision-makers (Saridakis & Dentsoras, 2008; Baležentis & Baležentis,
2014). MDMA can be classified into two aspects, namely; Multi-Objective Decision Making (MODM)
and Multi-Attribute Decision Making (MADM). The MODM models are employed to make a decision
when there are fewer criteria to be considered for evaluation. In situations like this, the decision matrix
is developed for the alternatives with minimal consideration on the weights and dimensions of the
criteria. The MADM models are employed to solve the problem of decision making in situations where
the effects of the criteria on the optimal alternative is of importance, and there are sub-criteria allotted
to the criteria of evaluation (Okudan & Tauhid, 2008). In order to avoid bias in apportioning values to
criteria of different dimensions, the fuzzy set theory is used to assign values to the linguistic terms used
in ranking and rating the alternatives and criteria, respectively. In recent times, hybridizing MADM
models to solve the problem of decision making has emerged as it provides an optimized decision-
making process. Hybridized MADM models have been applied in different fields depending on the
goal of the decision-makers and the importance attached to the decision-making process (Alarcin et al.,
2014; Balin et al., 2016). However, the application of hybridized MADM to decision making at the
conceptual stage of engineering design still requires attention. Although the Hybridized models provide
an efficient and systematic procedure for selecting optimal alternative because they harness the
computational advantage of two MADM models, but they pose a challenge of computational
complexity. The complexity can be solved by converting the computational process into algorithms
which can be developed into a program as a decision support tool.
This article proposes that, in order to have optimal decision-making at the conceptual stage of
engineering design, it can be modelled as a multicriteria decision-making model. The design
requirements are matched into design features and the design features are further divided into various
sub-features. The optimal design concept is determined from Fuzzified Pugh Matrices (FPM) using all
the design alternatives as a basis. The cumulative performance of the design alternatives is estimated
using the weights of design features and sub-features that are obtained from fuzzified pairwise
comparison matrices of Fuzzy Analytic Hierarchy Process (FAHP). Due to multifarious dimensions
and units of the design features and sub-features and the aim of appropriately quantifying the imprecise
information about the design alternatives, Trapezoidal Fuzzy Numbers (TrFN) are used to represent the
linguistic terms for rating and ranking the design features and alternatives respectively. The cumulative
TrFN of the design alternatives from the Pugh matrices are used to develop a pairwise comparison
matrix from which the actual performance of the design alternatives is obtained using Fuzzy Synthetic
Evaluation (FSE). In order to defuzzify and rank the TrFN of the FSE, it was reduced to a Triangular
Fuzzy Number (TFN) then the degree of possibility that a design concept is better than the other is
obtained from the orthocenter of three centroids of the plane figure under each TrFN.
2. Methodology
In order to simplify the analysis, consider a framework for the developed MADM model as presented
in Fig 2. Pairwise comparison matrices are needed for the sub-features and design features. The Fuzzy
Synthetic Extent (FSE) of these comparison matrices are computed and used as weights of the design
features, and sub-features in order to determine the cumulative TrFN for each design alternative from
the Pugh matrices. The linguistic terms of the TrFN for the pairwise comparison matrices and Pugh
matrices are different, and as such, they are described in Table 1. The cumulative TrFN from the Pugh
matrices are also harnessed to create a pairwise comparison matrix for the design alternatives. FSEs are
obtained for the design alternatives from the pairwise comparison matrices in the form of TrFN, which
are further reduced to centroids of orthocenter in the form of Triangular Fuzzy Numbers (TFNs). The
degree of possibility of is obtained from these orthocenters which provide weights for each of the
alternative design concepts.
24
Table 1
TrFNs and Linguistic terms for the Pairwise Comparison Matrices and Pugh Matrices
Pairwise Comparison Matrices Pugh Matrices
Linguistic Terms for Raking of
Relative Significance of design
features and sub-
features in the
Optimal Design
Trapezoidal Fuzzy Scale
Membership Function
Crisp Value
of Ranking
Linguistic Terms for
rating Design
concepts considering
the sub
-
features
Trapezoidal Fuzzy Scale
Membership Function
Crisp
Value of
Rating
Equally Important 1 1 1 1 1 Much Better 13/4 15/4 17/4 19/4 S++
Weakly Important 1 3/2 2 5/2 2 Better 5/2 3 7/2 4 S+
Essentially Important
7/4 9/4 11/4 13/4
3
Same
1 1 1 1
S
Highly Important
5/2 3 7/2 4
4
Worse
7/4 9/4 11/4 13/4
S
-
Very highly Important
13/4 15/4 17/4 19/4
5
Much Worse
1 3/2 2 5/2
S
--
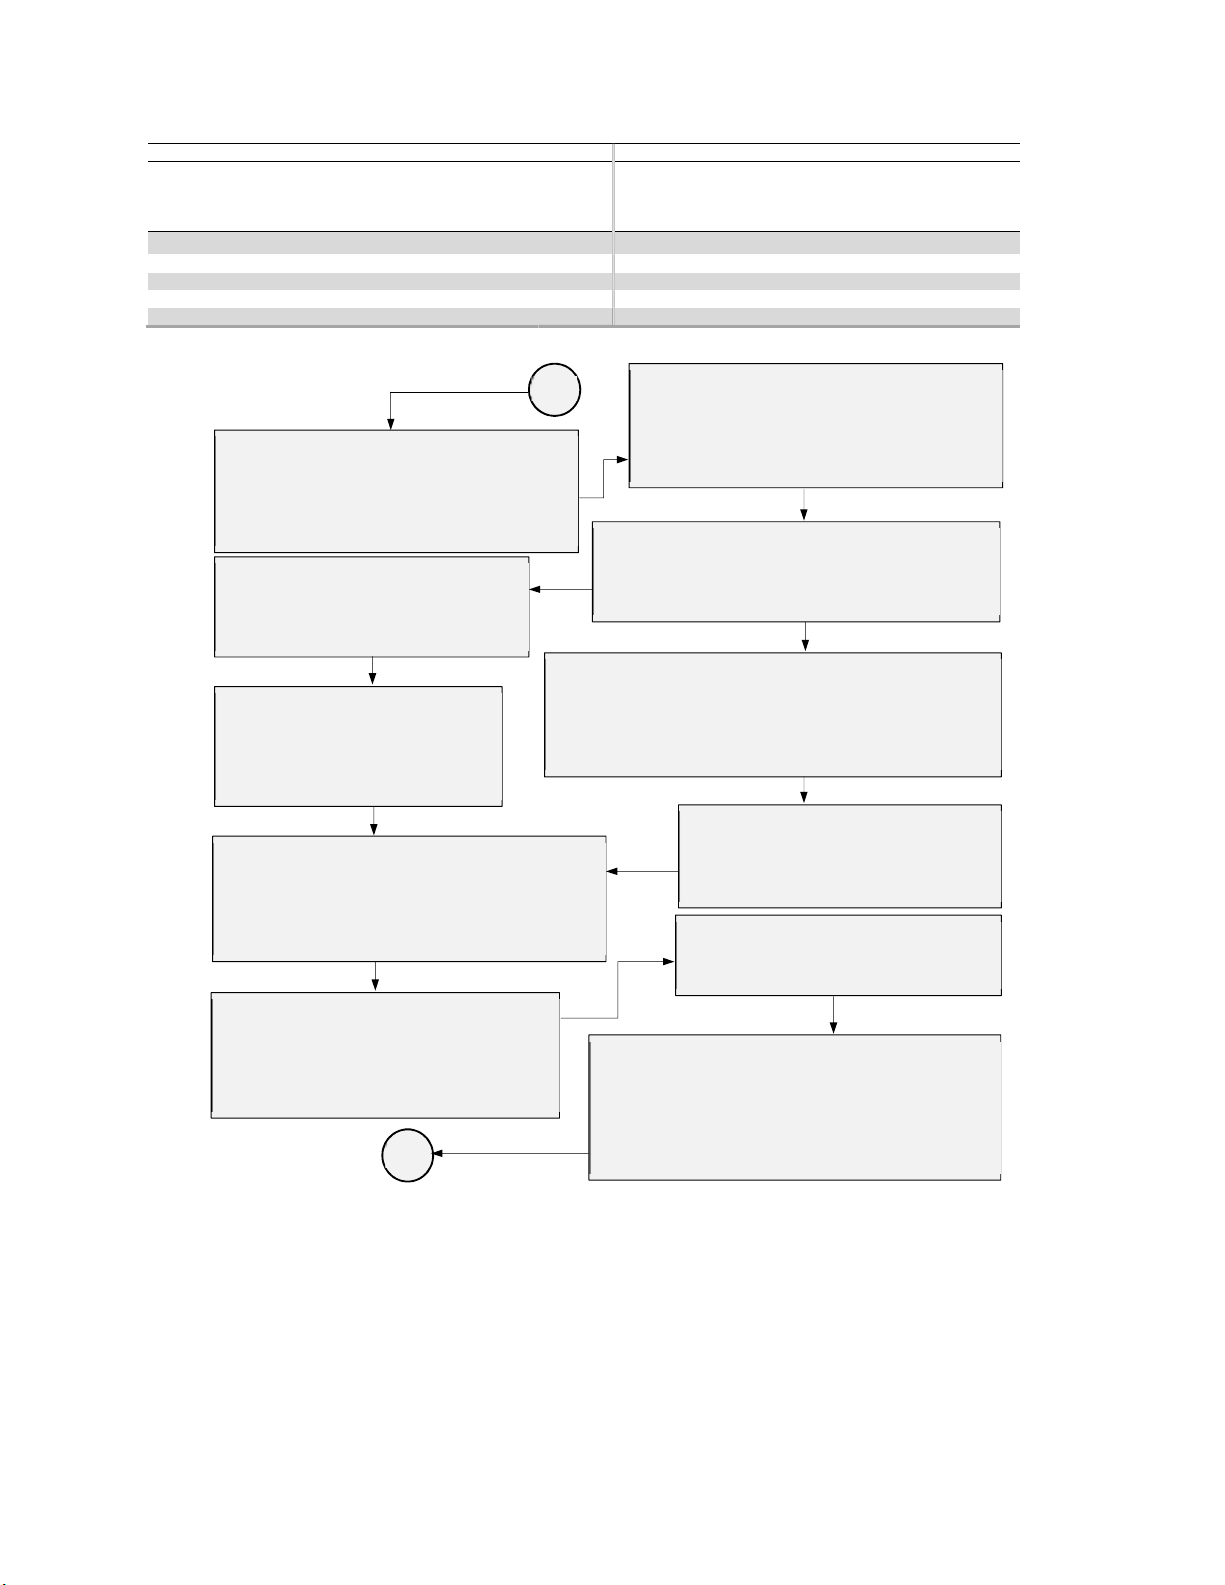
Fig. 2. Framework for the Fuzzified Pugh Matrix Model
In order to develop pairwise comparison matrices for the sub-features and design features, it is
necessary to assign TrFN
( )
x
M
to the elements of the matrices using linguistic terms. Consider m
number of design alternatives
Am
D
from which an optimal design will be chosen using k number of
design features
Fk
D
that are characterized by n number of sub-features
Fn
S
. The membership
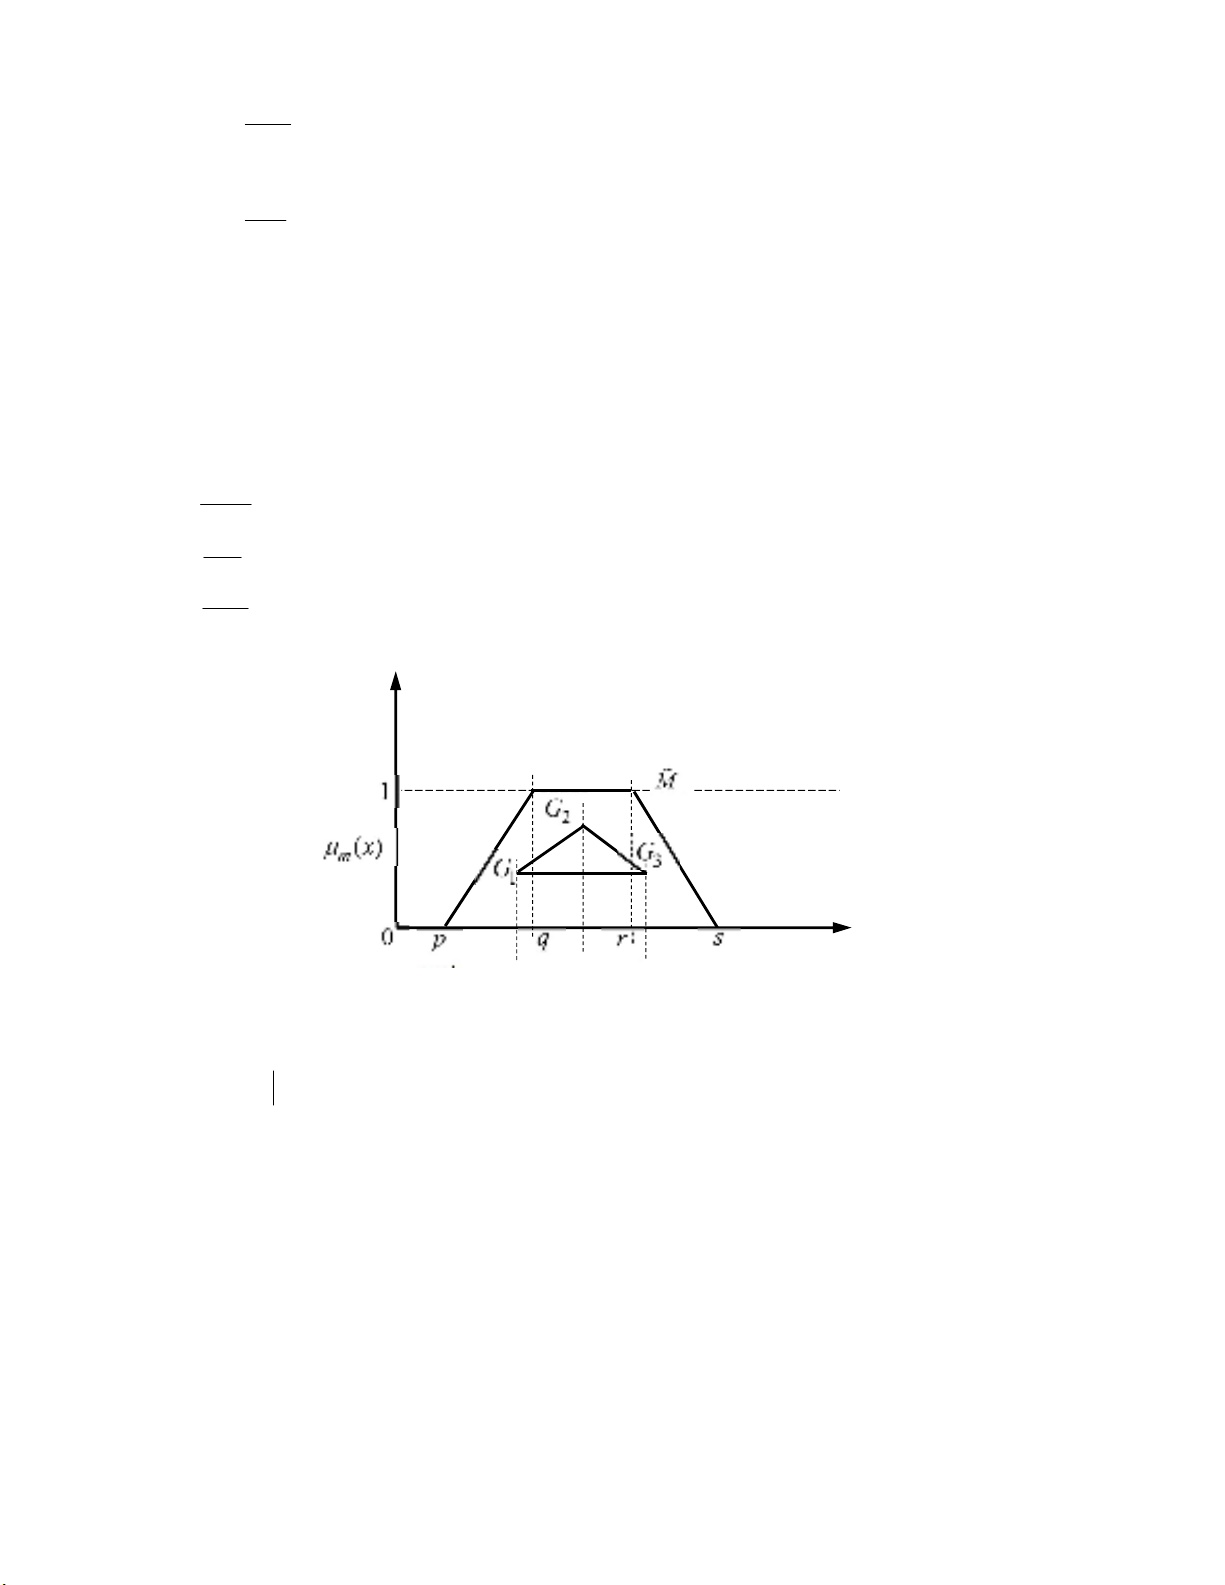
function
' ( )'
m
μ x
of the trapezoidal fuzzy number
, , , M p q r s
can be expressed by Eq. (1), as
presented in Fig. 3; (Singh, 2015; Velu et al., 2017),
Identify all requirements and design features
that is expected to be available in the optimal
design. Also identify all sub features associated
with each design features considering their
relative importance in the optimal design.
Establish relationships between the design
features as required in the optimal design. Also
establish interrelationships between the sub
features of individual design feature as needed in
the optimal design.
Establish scale of linguistic terms and the respective
trapezoidal fuzzy number. The linguistic t
erms
allotted to different or same fuzzy numbers for various
comparison process must be specified for clarity.
Develop fuzzified pairwise comparison
matrix for the design features considering
their relative importance and contribution
to performance of t
he optimal design.
Develop fuzzified pairwise comparison matrix for the design
sub features considering their contributions to the relative
importance of the design feature in the optimal design. Also,
consider the interrelationships between the sub features as
they affect the overall performance of the optimal design.
Determine the fuzzy synthetic extent
evaluation numbers for each design
feature from the fuzzified pairwise
comparison matrix for the design
features.
Determine the fuzzy synthetic ex
tent
evaluation numbers for each sub design
feature from the fuzzified pairwise
comparison matrix for the sub features.
Develop Pugh matrices using the sub features and
considering all design concept alternatives as basis
for comparison in each case. The weights of the
Pugh matrices will be the fuzzy synthetic extent
values of the design features and sub features.
Obtain the aggregate by considering the
weights of the sub features and over all weight
of the design feature in each case, the
aggr
egate of the concept used as the basis is
neglected from the aggregation.
Develop a fuzzified pairwise comparison
matrix for the design concepts using the
aggregates of the Pugh Matrices.
Determine the fuzzy synthetic extent of the new
pairwise comparison matrix. Determine the
orthocentres of the centroids. Evaluate the degree of
possibilities from the orthocentres in order to obtain
weight vectors for the design alternatives. Normalize
the weight vector and rank the design concepts.
Start
Stop
O. Olabanji and K. Mpofu
/ Decision Science Letters 9 (2020)
25
,
1 ,
( )
,
0 Otherwise
m
x p x p q
q p
x q r
x
s x x r s
s r
(1)
where
p q r s
with orthocentres of three centroids (
1 2 3
, , G G G
) obtained from equations 2, 3 and 4
respectively as presented in Fig. 3. Judgement matrices of the form
j
gi
Q q
can be developed for
pairwise comparison matrices of the design features and sub-features. Where j and i represent columns
and rows, respectively. In essence, the judgement matrix for the sub-features can be expressed in
equation 5. Also, the comparison matrix for the design features can be described as presented in
equation 6 (Somsuk & Simcharoen, 2011; Thorani et al., 2012; Zamani et al., 2014).
1
2
3
p q
G a
(2)
2
2
q r
G b
(3)
3
2
3
r s
G c
(4)
Fig. 3. Representation of the TrFN with three centroids orthocentres
1 2
1 1 1
1 2
2 2 2
1 1
..........
..........
...........
ni
j
f f f
j
f f f
F
j
fi fi fi
s s s
s
s s
S
s s s
(5)
1 2
1 1 1
1 2
2 2 2
1 1
..........
..........
...........
k
j
f f f
j
f f f
F
j
fi fi fi
d d d
d
d d
D
d d d
(6)
The FSEs for sub features’ and design features pairwise comparison matrices can be obtained from Eq.
(7) and Eq. (8), respectively. These FSEs represents the weights of the sub-features and design features
a
b
c


![Đề cương đề tài nghiên cứu khoa học [chuẩn nhất/mới nhất]](https://cdn.tailieu.vn/images/document/thumbnail/2025/20251117/duong297/135x160/26111763433948.jpg)