RESEARCH ON THE EFFECT OF DEPTH OF CUT ON SURFACE
ROUGHNESS AND POWER WHEN MILLING PLANE SURFACES
ON MAKINO KJ MILLING MACHINE
Nguyen Van Sang
1*
, Tran Duy Nam
1
1
Dong Nai Technology University
*Corresponding author: Nguyen Van Sang, sangnv@dntu.edu.vn
GENERAL INFORMATION ABSTRACT
Received date: 27/03/2024 Milling machines are often used in companies, vocational
training centers and universities in Vietnam, especially Makino
KJ milling machines. Through experimental research, the
regression model of roughness has been built as a trigonometric
function of cutting parameters, which is also the reason why this
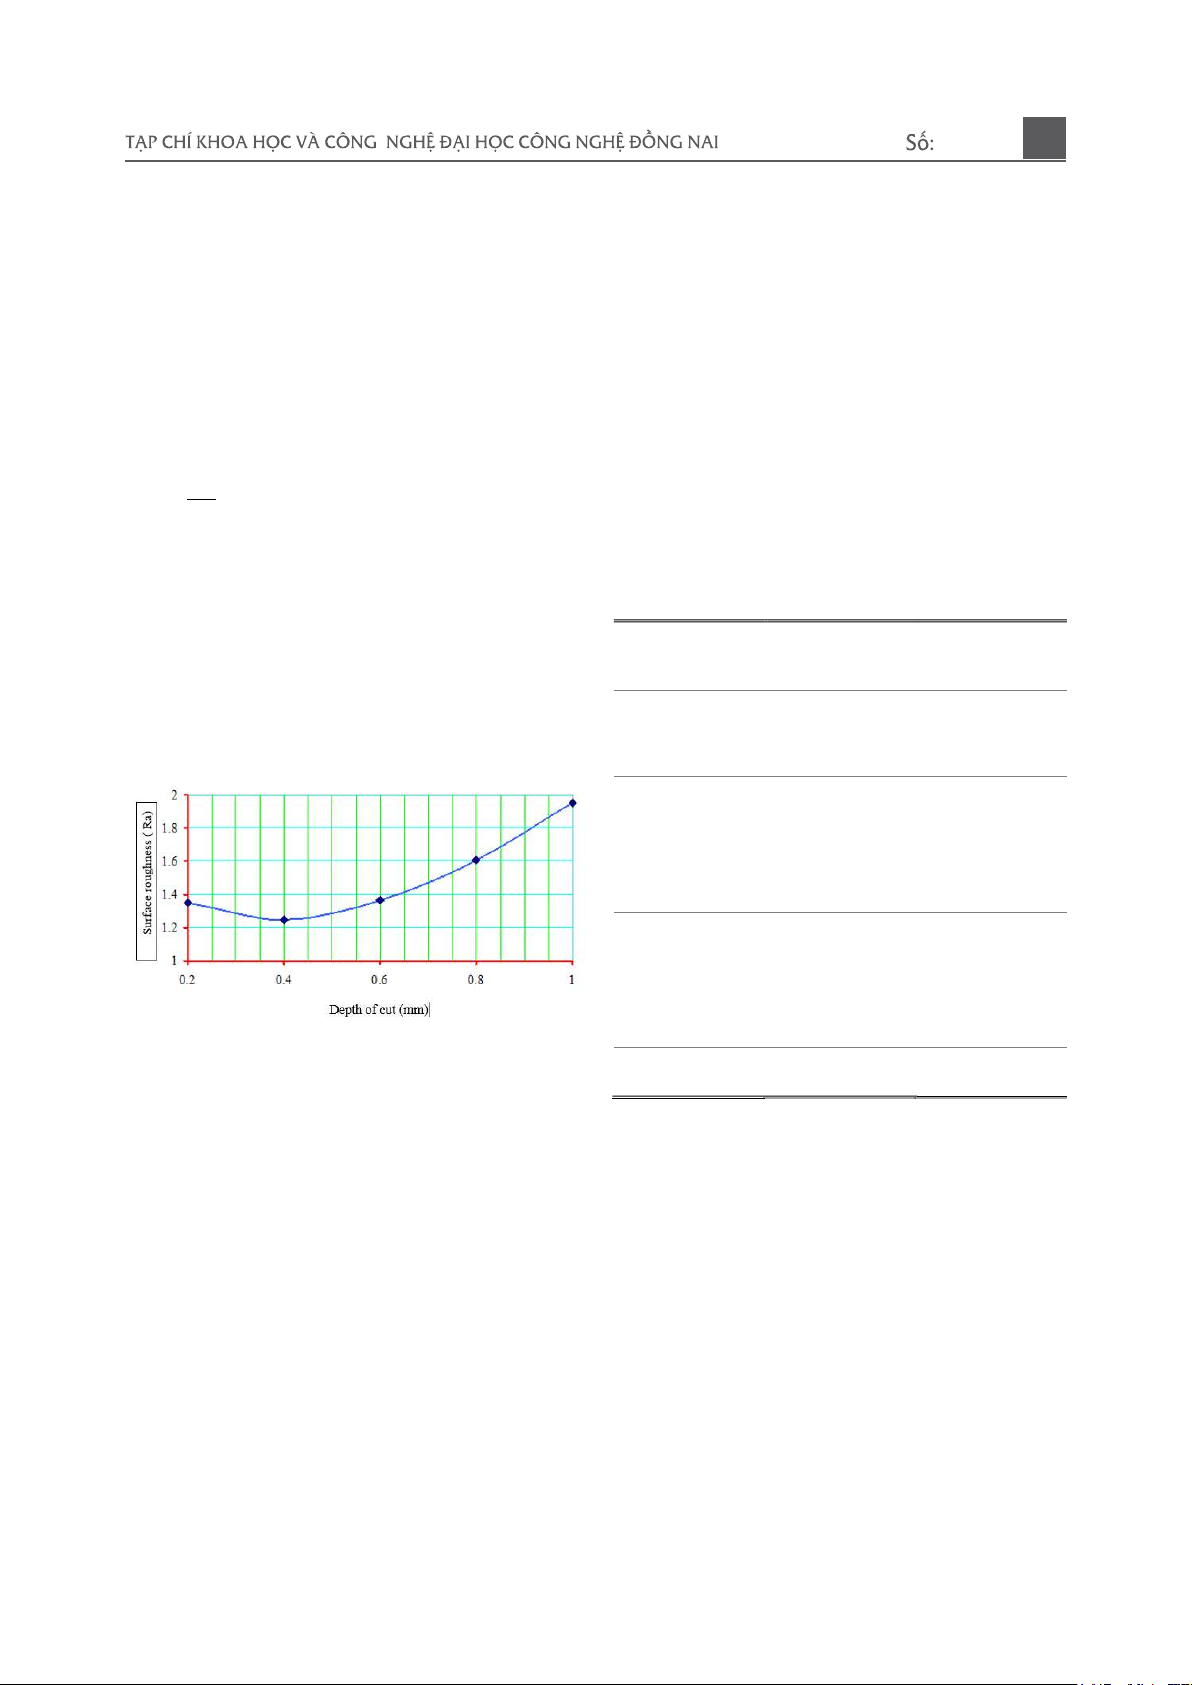
article needs to be studied. Therefore, the core point of this article
will be to study and choose the most reasonable cutting depth to
reduce power consumption during the machining of the end face
and meet the requirements for roughness when machining flat
milling products on Makino KJ milling machines.
Revised date: 29/05/2024
Accepted date: 23/07/2024
KEYWORD
Cutting depth;
Roughness;
Power;
Makino KJ milling machine.
1. INTRODUCTION
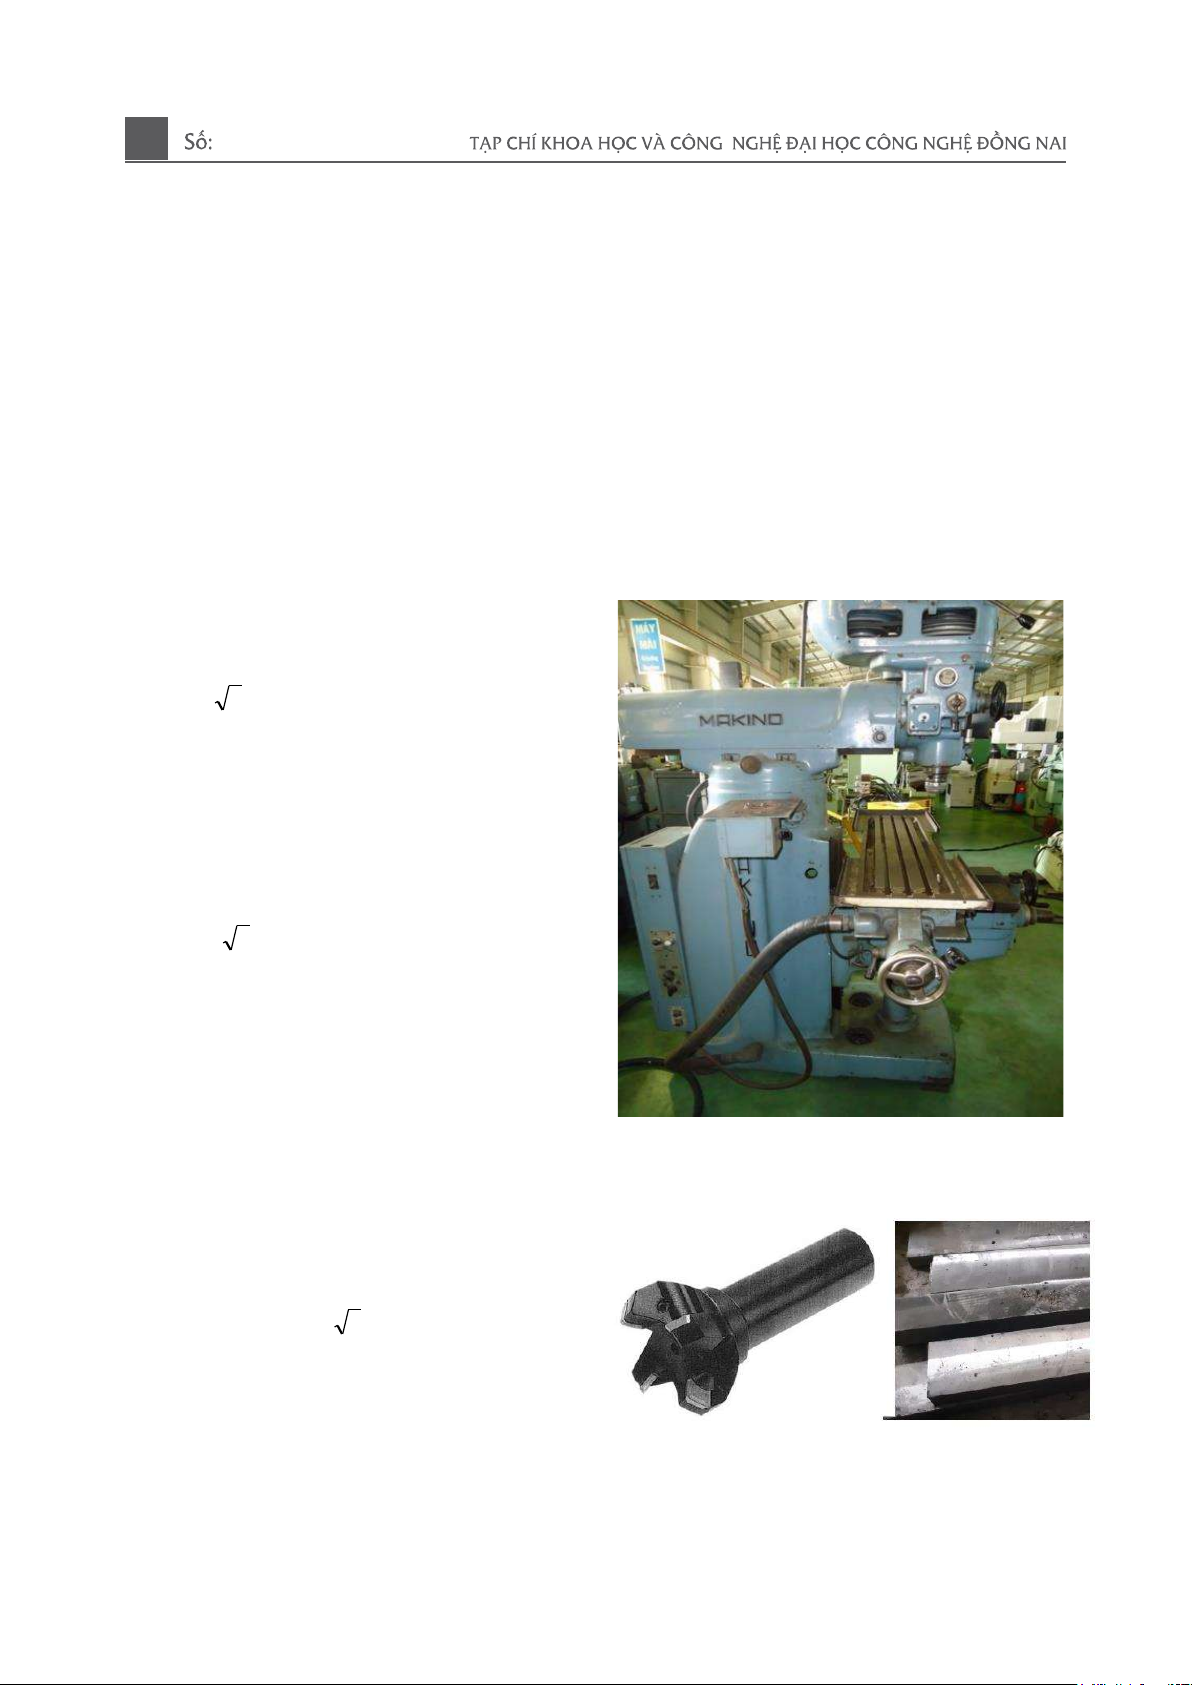
The article uses the object, scope and
research equipment of Makino KJ milling
machine, the milling cutter is a face milling
cutter, the turning material is the steel used to
manufacture the machine after the C45 casting
process, using the plane milling method, the
main parameters to study are the cutting depth
(t) affecting the roughness and power
consumption. The research method is based on
the theory of cutting machining on machine
tools. The experimental research method in
machine manufacturing to determine the
objective function, on that basis, the correlation
between the objective function and the
influencing parameters is established. Using the
optimization problem solving method to find
the reasonable usage mode of Makino KJ
milling machine.and conduct studies on the
changes of parameters during the cutting
process when machining flat surfaces in many
different experiments, from which we use the
single-factor evaluation method to be able to
give the optimal mode when choosing the
parameters of the cutting depth affecting the
power and quality of the product surface
roughness when machining flat surfaces on the
Makino KJ milling machine. (Lan et al., 2021).
2. METHODOLOGY
2.1. Selection of parameters affecting the
objective function
Factors related to the workpiece: Use C45
steel.
01-2025
35
Factors related to the machining mode:
Selection of cutting depth (t).
2.2. Method of determining specific
electricity
To determine the specific cost of electricity
during the experiment, we determine the
consumption level during the cutting process.
Therefore, it is necessary to measure the current
intensity. Because it is necessary to determine
the change in power before and during the
cutting process of the blade, from which we can
know the power difference to convert to non-
electrical quantities.(Giang et al., 2023).
Power before cutting
N
0
= .I
0.
U
0
.Cos (1)
N
0
No load wattage (W).
I
0
. - No load current (A)
U
0
.- Low voltage network voltage (V).
Cos . Power factor no load.
Power while cutting.
N
1
= .I
1
.U
1
. Cos .(2)
N
1
- Total power consumption
I
1
- The current when cut has the maximum
value.
U
1
- Low voltage network voltaeg (V).
Cos . Power factor has load.
In the experiment, we only conduct the
experiment when the voltage is stable. From
(1), (2) we see:
The power consumed during cutting is
N = N
1
- N
0
= U. .(I
1
- I
0
).Cos (3)
2.3. Determination method of machining
surface roughness
Using the TR200 roughness meter to
directly measure the roughness of the product
surface, the roughness value is displayed on the
LCD screen, from which we can determine the
roughness of the product after processing.
(Tuan et al., 2021; Loi et al., 2021).
3. EXPERIMENTS AND RESULTS
3.1. Experimental equipment
Makino KJ universal milling machine
Milling cutter and steel billet C45
Main shaft rotation levels, 7 levels from 60
- 2500 rpm
14 levels of cross-feed from 0.036 0.938
mm / revolution
Figure 1. Machine milling Makino KJ
Figure 2. Milling cutter and steel billet C45
3.2. Measure current connected by
computer
3
0
0
3
1
1
3
01-2025
36
2
1
1
1)yy(n
n
n
i
i
=
Current measuring devices are shown in
Figure 3.
Figure 3. Fluke connected to computer
The apparatus used to determine roughness
is shown in figure 4.
Figure 4: Surface roughness tester TR 200
3.3. Measurement results
Table 1. Effect of cutting depth on power and product surface roughness, Spindle speed n = 960
rpm, = 6
O
, S= 0.4 mm / round
Numeria
l order
Cuttin
g
depth
Measure
d times U
1
I
0
I
1
cos
t
N
t
T(s) F(m
2
) N
(Wh/m
2
) Ra
1 0.2
1 230.15 5.66 8.24 0.43 442.24 11 0.001965 687.68 1.33
2 230.27 5.66 8.45 0.42 467.36 11 0.001965 726.74 1.36
3 231.29 5.66 8.57 0.41 477.96 11 0.001965 743.23 1.37
2 0.4
1 231.30 5.63 8.05 0.42 407.19 11 0.001965 633.18 1.22
2 232.37 5.63 8.11 0.43 429.20 11 0.001965 667.40 1.25
3 232.20 5.63 8.08 0.44 433.55 11 0.001965 674.17 1.28
3 0.6
1 231.50 5.88 8.46 0.44 454.66 11 0.001965 707.00 1.47
2 230.26 5.88 8.47 0.44 454.50 11 0.001965 706.74 1.48
3 232.62 5.88 8.59 0.43 469.51 11 0.001965 730.08 1.50
4 0.8
1 229.80 6.01 8.71 0.44 472.85 11 0.001965 735.25 1.61
2 230.15 6.01 8.73 0.43 466.24 11 0.001965 725.00 1.67
3 230.02 6.01 8.76 0.45 493.03 11 0.001965 766.65 1.92
5 1
1 232.50 6.07 8.99 0.45 529.15 11 0.001965 822.82 1.92
2 231.70 6.07 8.97 0.47 546.99 11 0.001965 850.57 1.94
3 232.10 6.07 8.98 0.46 538.13 11 0.001965 836.79 1.98
3.4. Processing of experimental data
3.4.1. Experimental data and minimum
number of repetitions
To get the standard data, I use the Person
indicator (2). We divide the output quantity
(Y1) into L groups so that each group has 5
output quantities (Y1) and is calculated
according to the formula below (Loc et al.,
2021).
L = 1+3,2.Lg n (4)
n- experimental probe ( n= 15 )
The mean value of the group with each
other: = (y
1-L
+Y
i
) /L , (i = 1…k)
Experimental error standard:
S
2
= (5)
l
Y
01-2025
37
The standard value
2tt
is calculated as the
formula below.
2tt
= (6)
P
i
=
p
i
- Theoretical random quantity
probability
y
n
- Minimum value ; y
l
- Maximum value;
=
The minimum number of times performed
for each experiment is determined by the
formula
m = (7)
S - The level of variance when doing
experiments; m - Results repeat when
experimenting; - Student standards look up
table - Absolute error value.
3.4.2. Use methods to process results when
doing experiments
We use experimental planning software to
determine the results, from which we process
and conclude the homogeneity of variance
when doing experiments, regression models
and determine the compatibility of regression
models (Loc et al., 2021).
3.5. Results of single factor experiments
Conduct an exploratory experiment and
then substitute the parameters into (6), from
which we determine the standard
2tt
= 5,35 is
smaller than the standard in the table (
2b
=
9,47), the experimental data follow the normal
distribution law, substitute the data into (7),
determine the number of repetitions for each
experiment m = 2.65 and get the result m = 3
(Loc et al., 2021).
3.5.1. Depth of cut (t) affects power
We change the cutting depth value of the
knife according to the parameters of each cut as
follows: t
1
= 0.2mm; t
2
= 0.4mm; t
3
= 0.6mm; t
4
=
0.8mm; t
5
= 1mm, with n = 950 rpm unchanged
during the machining process, the main tilt
angle of the alloy piece is fixed 6
0
, the feed rate
S = 0.3mm/rev is fixed. The result parameters
and data processing are as in Table 2. I use the
software and experimental planning program to
process and get the following results (Loc et al.,
2021, Duc et al., 2020)
Regression model:
Nr =779,4 - 445,28.t + 503,57.t
2
(8)
Apply according to Kokhren
G
tt
= S
2m
/
=
N
1
S
2u
, G
tt
= 0,293
Calculation by Fisher criterion
2
2
e
tt
S
S
F=
, F
tt
= 3,64.
Homogeneity of variance when we test
Gtt = 0.293 < Gb = 0.615.
We check that the model F
tt
< F
b
and
determine that the model is considered
homogeneous (Duc et al., 2020).Observe the
results obtained when drawing a graph to
determine the relationship between electricity
and cutting depth of the product as shown in
Figure 5.
Figure 5. Relationship of cutting depth to
power
3.5.2. Correlation of cutting depth with
surface roughness of the product
The experimental method is the same as
above, the experimental parameters and data
y
/
1
2
22
s.
( )
n.p
n.pn
i
n
iii
2
1
=
ln y.y.
ee
01-2025
38
processing method are based on the
experimental planning software, we see the
roughness as the equation below:
Ra = 1,43 - 0,769.t + 1,305.t
2
(9)
Kokhren processing parameters according
to G
tt
= S
2m
/
=
N
1
u
S
2u
, G
tt
= 0,218,
Fisher processing parameters according to
2
2
e
tt
S
S
F=
thì F
tt
= 3,85.
When we check the homogeneity of
variance, we get the following results: G
tt
=
0,218 < G
b
= 0,616. We can conclude that the
variance during the experiment is homogenous.
Check the regression model F
tt
< F
b
and we can
conclude that the model is compatible (Duc et
al., 2020).
Figure 6. Relationship between cutting depth
and product surface roughness
With the above results, we can show on the
graph the relationship between cutting depth
and roughness of the machined product in
figure 6.
Considering the cutting depth of the
product. Observing the graphs in Figure 6 and
Figure 5 combined with the regression equation
represented in Equation (9), (8), we see that for
the cutting depth t = 0.4 mm, the power and
roughness give the smallest parameters.
3.5.3. Experiment on Makino KJ milling
machine in optimal mode
When I found the optimal usage mode of
Makino KJ milling machine, I re-performed the
experiment on the mode on Makino KJ milling
machine and optimized the calculated results as
above, and the experimental results were
processed and statistically calculated as in table
2.
Table 2 Experimental results of optimal
cutting depth when flat on Makino KJ milling
machine
Numerical
order 1 2
The goal
function
Electrictiy
Nr
min
(Wh/m
2
)
Surface
roughness
Ra
min
(m)
The optimal
value is
calculated
according to
the theory
682.85 1.225
Experimental
value
according to
the optimal
mode
711.78 1.245
Error 4.42% 2.28%
According to the parameter results in table
2, I have some conclusions and comments.
The error value of the experimental power
function on the Makino KJ milling machine
when in optimal mode compared to the
theoretical parameters has been calculated to be
4.42%, so the optimal value is reliable.
The experimental error value of the
roughness of the machined part surface
compared to the theoretical value is 2.28%, we
can say that the calculated optimal value above
is reliable.
01-2025
39