Journal of Medicine and Pharmacy - No.5 25
STUDY OF SERUM S100 AND NSE CONCENTRATION IN
PATIENTS WITH ACUTE CEREBRAL INFARCTION
AT INTENSIVE CARE UNIT OF HUE CENTRAL HOSPITAL
Hoang Trong Hanh1, Nguyen Cuu Loi1, Hoang Khanh2, Nguyen Dinh Toan2
(1) Hue Central Hospital, Vietnam
(2) Hue University of Medicine and Pharmacy, Vietnam
Abstract
Objective: Survey serum S100 and NSE concentration in patients with cerebral infarction during
the acute phase. To understand the relationship between serum S100 and NSE concentrations
with some other risk factors such as age, sex, Glasgow Coma Scale, cerebral lesion volume on
computerized tomography. Subjects and Methods: Study of 90 hospitalized patients with cerebral
infarction at ICU of Hue Central Hospital and 100 controls. Data was collected through medical
records of patients with acute cerebral infarction and control. The study method was acrossectional
and descriptive. Data was analysed by medical statistics and processed by the SPSS 19.0 software.
Results: The average age in study group was 68.3 ± 13.1 (Min 32, Max 90) and control group was
64.8 ± 12.9 (Min 33, Max 88) did not differ statistics significantly. The majority of patients with
age group from 61 to 80 years old (48.9%) is retired elderly patients but it doesn’t differ statistics
significantly with p> 0.05. The average concentration of S100 and NSE in study group was higher in
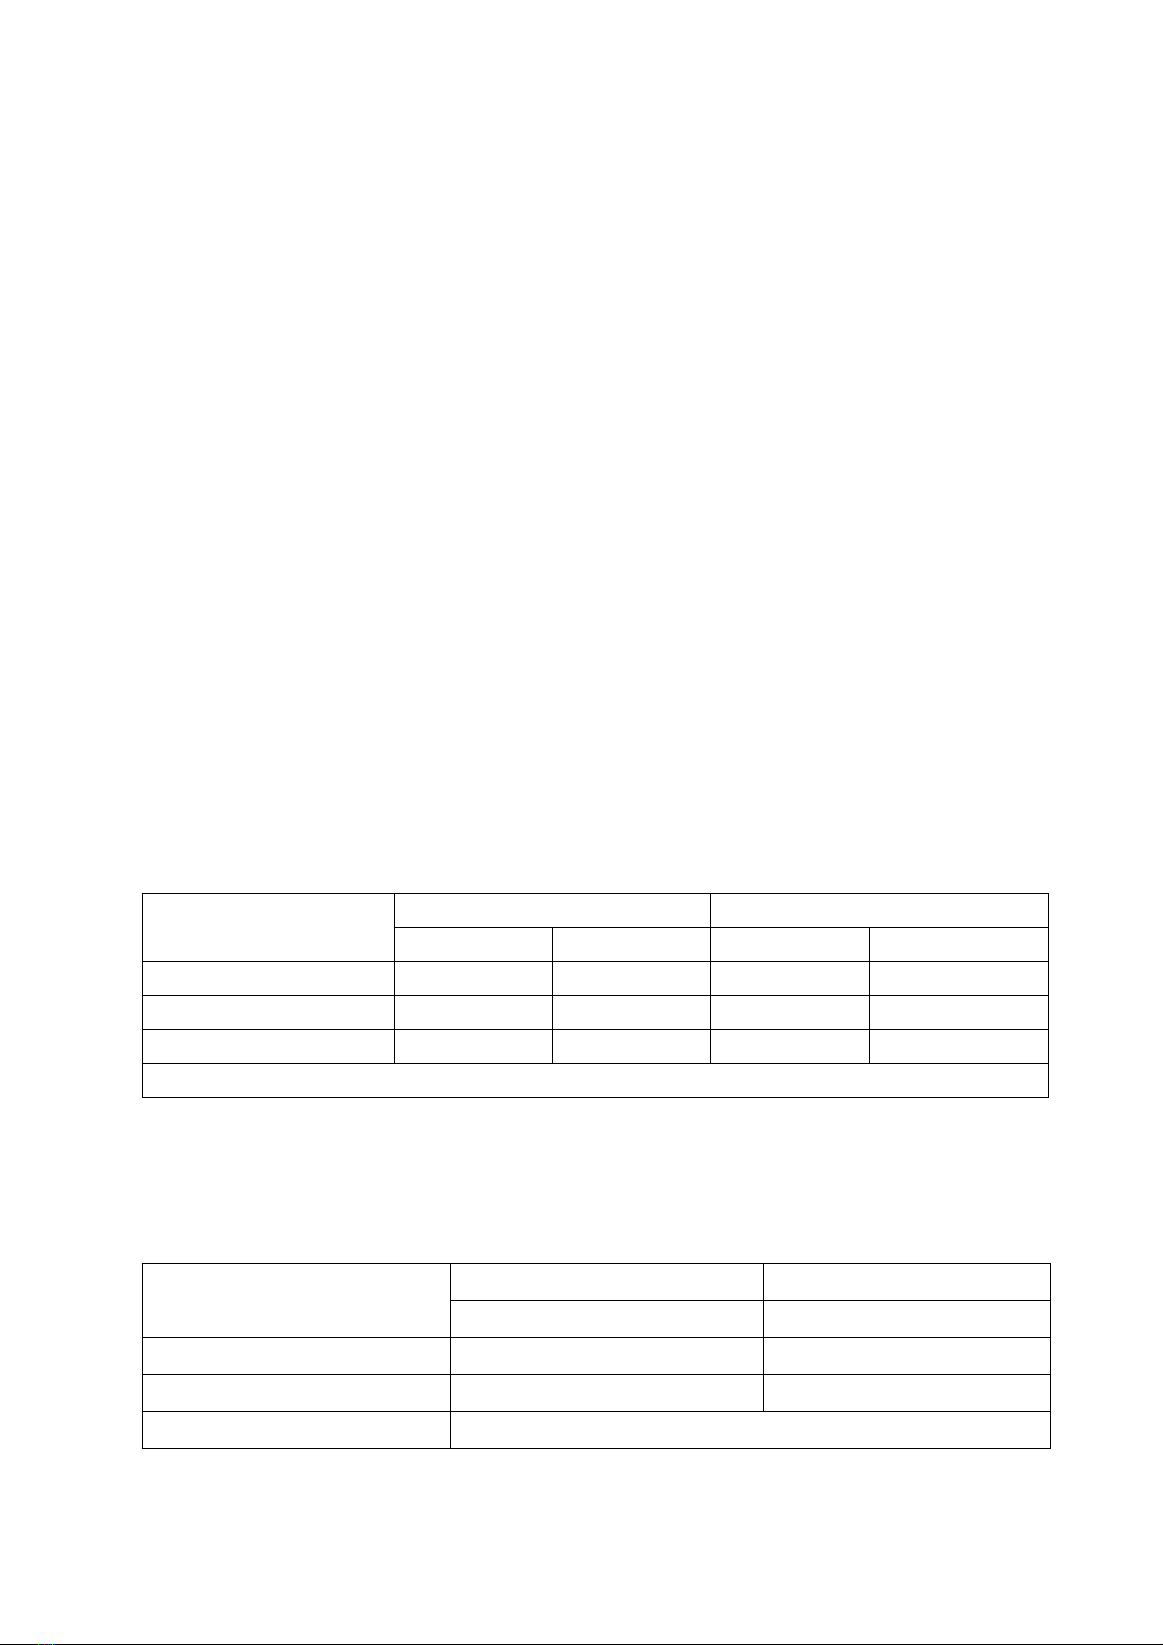
control group, the difference was statistics significantly(p<0.001). The concentration of S100 and
NSE in mortality was higher in living groups, in which S100 was different statistics significantly
(p <0.05). Cut-off value predicts the survival of S100 and NSE in this study is respectively 0.21 mcg/l
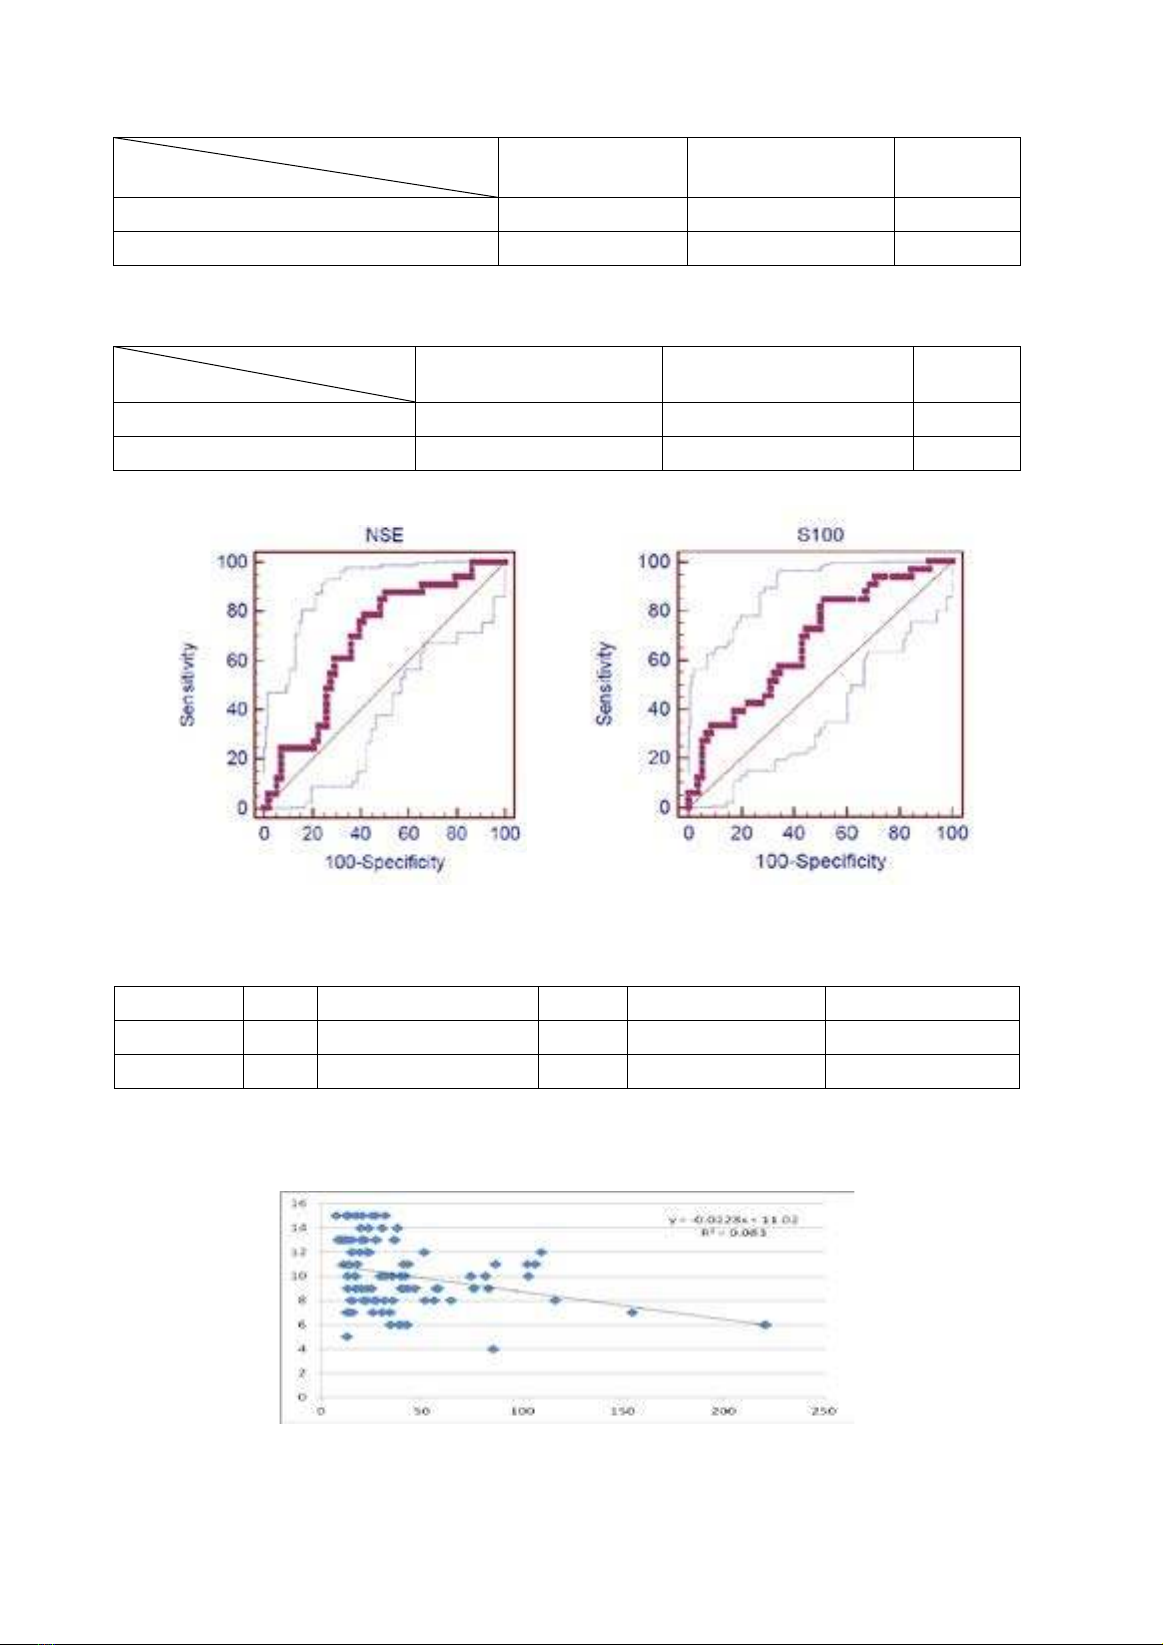
and 20.45ng/ml. There is a inversely correlation between the S100 and NSE with Glasgow coma
scale. The more comatose patients are, the more NSE and S100 increases. The correlation equation
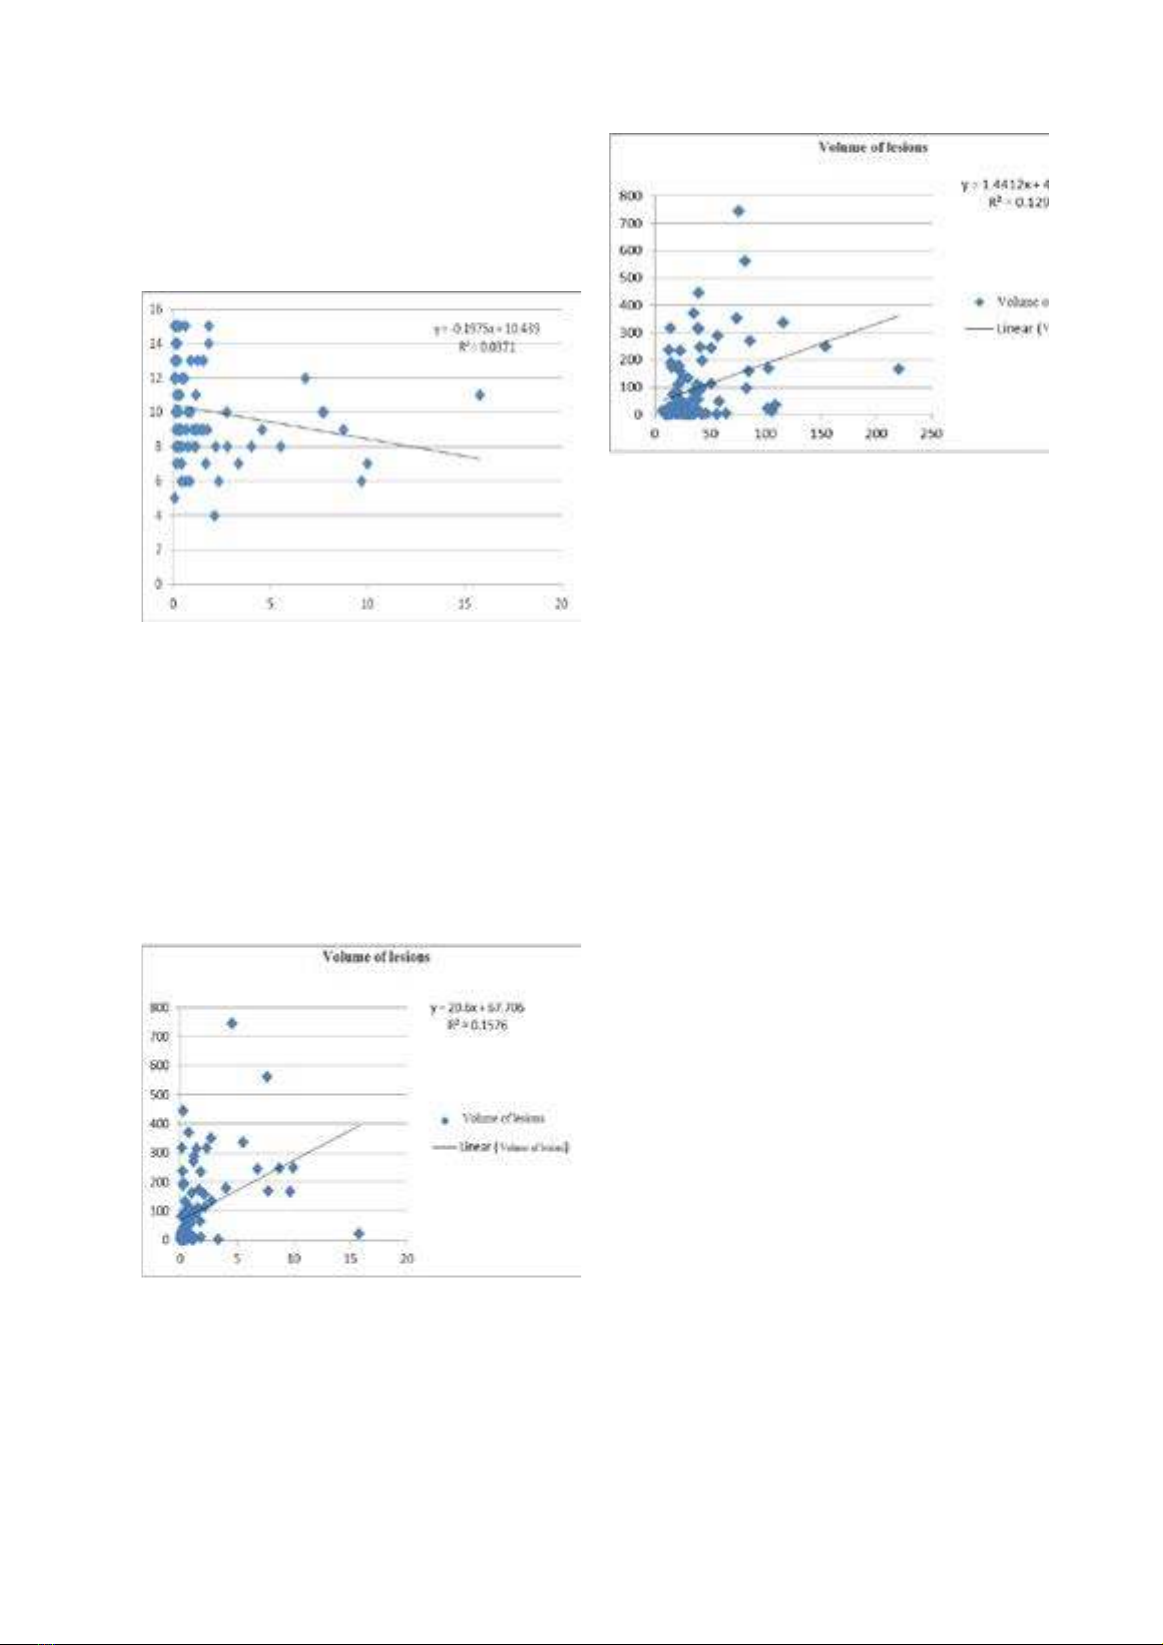
respectively: y = -0.1975x10.439 + (n = 90, r= - 0.19, p> 0.05). Y = -0.0228x + 11.02 (n = 90, r = - 0.29,
p <0.01). The greater volume of lesions is, the higher the concentration of S100 and NSE is. There
is a agreement correlation between the S100 and NSE with lesion volume, the correlation equations
respectively: y = 20.6x + 67.71 (n = 90, r = 0.397, p <0.001). Y = 1.441x + 43.104 (n = 90, r = 0.359,
p <0.05). Conclusion: The cut-off value to predict the survival of S100 and NSE in this study
respectively 0.21 mcg/l and 20.45ng/ml.There is a inversely correlation between S100 and NSE
with Glasgow coma scale. There is positive correlation between S100 and NSE with lesion
volume. S100 and NSE can be used to predict and monitor disease progression and the volume
of cerebral lesions.
Key words: Stroke, acute cerebral infarction, Glasgow coma scale, S100, NSE
1. BACKGROUND
Stroke or cerebral vascular accidents have
become important issues in medical care. The rate
of hypertension and stroke are increasing, and
the rate of stroke increases with age. Prevalence,
mortality and disability rates are still high, of
which 20% of survivors needed hospital care
after 3 months, 15-30% permanent disability [1],
[2]. Despite advances in diagnosis and treatment,
stroke not only the cause of death is the third after
cancer and heart disease in developed countries,
but also to the sequelae of severe neurological and
require long-term care. Therefore, prevention of
risk factors is a key strategy for each community
and each individual, to minimize complications
occur [2], [3]. More new diagnostic method,
modern, new drugs are highly effective early
diagnosis, timely treatment and prevention are
more effective, improve prognosis [1], [2], [3].
In recent years, there are many research
techniques to monitor cerebral vascular accident
and predict treatment outcomes. Clinical
neurological examination is useful for nerve
function has not been extensive damage but little
value in the assessment of infarct volume or
- Corresponding author: Hoang Khanh, email: hoangkhanhqb@gmail.com
- Received: 27/5/2014 * Revised: 22/6/2014 * Accepted: 25/6/2014 DOI: 10.34071/jmp.2014.1e.4
Journal of Medicine and Pharmacy - No.5
26
comatose patients after cerebral infarction. The
diagnostic techniques of modern neuroscience
such as CT, MRI, and ultrasound to help
clinicians determine the location, the volume
of cerebral infarction and treatment planning.
However, diagnostic imaging repeated daily is
not practical. Several monitoring techniques
have been developed based on measurements of
various blood proteins, including NSE (Neuron-
specific enolase), myelin basic protein, and S100
protein... In that protein markers of brain damage
can allow regular testing with relatively low risk
and therefore they are very effective in monitoring
changes in disease.
We use the S100 protein and NSE in blood to
monitor, prognosis and help us diagnose cerebral
infarction [9], [10], [11]. In Vietnam we have
not seen the research on this issue. Therefore, to
understand more about this issue, we studied S100
and NSE levels in blood during the acute cerebral
infarction with two objectives:
- To survey serum S100 protein and NSE
concentrations in patients with acute cerebral
infarction.
- To find out the relationship between levels
of S100B, NSE for age, sex, Glasgow Coma
Scale, cerebral damage volume on computerized
tomography, survival prognosis in patients with
acute cerebral infarction.
2. MATERIALS AND METHOD
2.1. Materials: Studying of 90 hospitalized
patients with acute cerebral infarction at ICU of
Hue Central Hospital and 100 controls from April
2011 to March 2014.
2.2. Method
Data was collected through medical records
of patients with acute cerebral infarction and
control. The study method was acrossectional
and descriptive. Data was analysed by medical
statistics and processed by the SPSS 19.0
software. Using t tests to compare mean values
of two data sets.
- Quantification of serum S100 and NSE by
immunofluorescence techniques polarization
(FPIA = fluorescence Polarization Immunoassay)
on biochemical autoimmune Cobas 6000 at Hue
Central Hospital.
- Normal range in the blood.
S100 concentration: 0.046 to 0.105microgram/
L [9]
NSE concentrations :15.7 to 17.0ng/mL [9].
3. RESULTS
3.1. The common characteristics
Table 1. The common characteristics
Gender Study group control group
Frequency (n) Percentage (%) Frequency (n) Percentage (%)
Male 53 58.9 59 59.0
Female 37 41.1 41 41.0
Total 90 100 100 100
p > 0.05
The majority men in study and control group is male, which did not differ statistics significantly
The average age in study group was 68.3 ±
13.1 (Min 32, Max 90) and control group was 64.8
± 12.9 (Min 33, Max 88) did not differ statistics
significantly. The majority of patients were 61 to 80
years old (48.9%) who were retired and elderly but
it doest differ statistics significantly with p> 0.05.
3.2. Survey serum S100 and NSE level
Table 2. The average concentration of S100 and NSE in study group and control group
Markers
Study group Control group
Mean±SD (n=90) Mean±SD (n=100)
S100 1.489± 2.663 0,062±0.029
NSE 38.36±34.46 14.79±3.49
p p <0.001
The average concentration of S100 and NSE in study group was higher in control group, the difference
was statistically significant (p<0.001).
Journal of Medicine and Pharmacy - No.5 27
Table 3. The relationship between S100, NSE with gender
Gender
Average concetration Male (n=53) Female (n=37) P
S100 1.243±2.510 1.843±2.867 <0.05
NSE 36.27±29.04 41.35±41.25 <0.05
The relationship between S100 and NSE with gender was higher for females than for males, the
difference between the two gender was statistically significant (p < 0.05).
Table 4. The relationship between S100, NSE with survival and dead group
Survive/Death
Level Survive (n=57) Death (n=33) P
S100 0.991 ±1.893 2.350±3.501 < 0.05
NSE 33.44 ± 34.07 46.86± 33.96 > 0.05
The concentration of S100 and NSE in mortality was higher in living groups, in which S100 was
different statistics significantly (p <0.05)
Figure 1. Graphical display of the ROC curve of NSE and S100 according to survival
Table 5. Sensitivity and specificity of S100 and NSE in survival and dead group
Values AUC Confidence interval 95% Cut off Sensitivity(%) Specificity(%)
NSE (ng/ml) 0.684 0.578-0.777 20.45 87.88 50.00
S100 (mcg/l) 0.678 0.572-0.772 0.21 84.85 48.28
The area under the curve (AUC) of S100 is 67.8% similar 68.4% of the NSE, the cut-off value to
predict the survival of S100 and NSE in this study respectively 0.21 mcg/l and 20.45ng/ml.
The correlation between NSE and Glasgow coma scale
Glasgow coma scale
NSE
Figure 2. Regression line performance correlated between NSE concentrations and Glasgow coma
scale (n=90, r= - 0.29, p<0.01)
Journal of Medicine and Pharmacy - No.5
28
There is an inversely correlation between
the NSE with Glasgow coma scale score. The
correlation equation: y = -0.0228x + 11.02 (n =
90, r = - 0.29, p <0.01).
The correlation between S100 and Glasgow
coma scale
Glasgow coma scale
S100
Figure 3. Regression line performance correlated
between S100 concentrations and Glasgow coma
scale (n=90, r=- 0.19, p>0.05)
There is an inversely correlation between
the NSE with Glasgow coma scale score. The
correlation equation:y= -0.1975x+ 10.439 (n=90,
r=- 0.19, p>0.05)
The correlation between the S100 and NSE
concentration with volume of lesions
volume of lesions (ml)
S100 concentrations (mcg/L)
Figure 4. Regression line performance correlated
between S100 concentrations and volume of lesions
The greater volume of lesions is, the higher the
concentration of S100 is. There is an agreement
correlation between the S100 with lesion volume.
The correlation equation: y = 20.6x + 67.71 (n=90,
r=0.397, p< 0.01)
volume of lesions (ml)
NSE concentrations(ng/ml)
Figure 4. Regression line performance correlated
between NSE concentrations
and volume of lesions
There is an agreement correlation between the
NSE with lesion volume. The greater volume of
lesions is, the higher the concentration of S100
is. The correlation equation: y = 1.441x + 43.104
(n=90, r=0.359, p< 0.05)
4. DISSCUSION
4.1. The common characteristics
In our study, the two markers had a higher
percentage in men than in women in both study
group and control group, did not differ statistics
significantly.
The average age in study group was 68.3 ± 13.1
(Min 32, Max 90) and control group was 64.8 ±
12.9 (Min 33, Max 88) did not differ statistics
significantly.
The average age was 68.3 ± 13.1 equivalent
study 44 patients of cerebral infarction of Missler
et al (mean age 65.1. Min: 32; Max: 87) [7].
The majority of patients were 61 to 80 years
old (48.9%), who were retired and elderly but it
doesn’t differ statistics significantly with p> 0.05.
4.2. The survey S100 and NSE concentration
The average concentration of S100 and NSE
in study group was higher in control group, the
difference was statistically significant (p < 0.001).
The relationship between S100 and NSE with
gender was higher for females than for males,
the difference between the two gender was not
statistically significant (p>0.05). The concentration
of S100 and NSE in mortality was higher in living
groups, in which S100 was different statistics
significantly (p <0.05).
The area under the curve (AUC) of S100 is
67.8% similar to 68.4% of the NSE, the cut-off
Journal of Medicine and Pharmacy - No.5 29
value to predict the survival of S100 and NSE in
this study respectively 0.21 mcg/l and 20.45ng/ml.
There is an inversely correlation between
the S100 and NSE with Glasgow coma scale
score, The more comatose patients are, the more
S100 and NSE increases due to greater brain
damage. The correlation equation respectively:
y = -0.1975x +10.439 (n = 90, r= - 0.19, p> 0.05).
y = -0.0228x + 11.02 (n = 90, r = - 0.29, p <0.01).
There is an inversely correlation with the survival
rates.
The greater volume of lesions is, the higher the
concentration of NSE is. There is an agreement
correlation between the NSE with lesion volume,
the correlation equations: y = 20.6x + 67.71 (n = 90,
r = 0.397, p <0.001) which is similar to the results
of international authors [5], [9], as Cunningham et
al studied 83 patients with cerebral infarction and
showed that NSE concentrations correlated with
lesion volume (r = 0.36, p = 0.001) [4], Missler
et al studied 44 patients with cerebral infarction
and showed that NSE concentrations correlated
with cerebral lesion volume (r = 0.37, p <0.05) [7],
Wu et al studied 38 patients with cerebral infarction,
which showed concentrations NSE correlated with
lesion volume (r = 0.81, p <0.01) [11]. For S100,
similarly the larger lesion volume is, the higher
the concentration of S100 is. There is positive
correlation between S100 with lesion volume,
the correlation equation: y = 20.6x + 67.71
(n=90, r=0.397, p <0.001) similar to the results
of international authors [5],[9], as Missler et al
studied 44 patients with cerebral infarction showed
S100 concentrations correlated with lesion volume
(r = 0.75. p <0.001) [7]. Edward C.Jauch et al
studied 359 patients and showed S100 concentration
correlated with the volume of cerebral lesions on
CT scan (r = 0.239, p <0.0001) [6].
5. CONCLUSION
The cut-off value to predict the survival of S100
and NSE in this study respectively 0.21 mcg/l
and 20.45ng/ml. There is an inversely correlation
between S100 and NSE with Glasgow coma scale.
There is positive correlation between S100 and
NSE with lesion volume. S100 and NSE can be
used to predict and monitor disease progression
and the volume of brain lesions. In the future,
research with larger numbers is need to get more
accurate results.
REFERENCES
1. Dang Nguyen Van (2003), Practice neurological
diseases and common syndromes, Medical
Publishing House, Ha Noi, p. 569-636.
2. Khanh Hoang (2010). Cerebral vascular accident,
Lecture Postgraduate Neurology, University
Publishing Hue.
3. Luong Ho Huu (1998). Cerebral vascular accident,
Medical Publishing House, Ha Noi.
4. Cunningham RT et al (1991). Serum neurone
specific enolase (NSE) levels as an indicator
of neuronal damage in patients with cerebral
infarction. Eur J Clin Invest. 21:497-500.
5. Daniel T.Laskowitz et al (2009). Clinical
usefulness of a biomarker-based diagnostic test
for acute stroke. “The biomarker rapid assessment
in ischemic injury (brain) study. Stroke. vol.40,
pp 77-85. American heart Association, Inc.
6. Edward C.Jauch et al (2006), Association of serial
biochemical markers with acute ischemic stroke.
Stroke, vol.37, pp 2508-2513. American heart
Association, Inc.
7. Martens P et al (1998). Serum S-100 and Neuron-
Specific Enolase for prediction of Regaining
Consciousness after Global Cerebral Ischemia.
Stroke. 29(11): 2363-2366.
8. Missler Ulrich et al (1997). S100 protein and
neuron-specific enolase concentration in blood as
indicatiors of infarction volume and prognosis in
acute ischemic stroke. Stroke a Jounal of cerebral
circulation. Volume 28. No10. pp 1956-1960.
9. Nishant Anand, Latha G. Stead (2005). Neuron-
Specific Enolase as a Marker for Acute Ischemic
Stroke: Cerebrovasc Dis; Vol. 20, No. 4 pp 213-
219
10. Roche Diagnostics (2009). S100, NSE pp1-4
11. Schaarschmidt H, Prange HW, Reiber H (1994).
Neurone specific enolase concentrations in blood
as a prognostic parameter in cerebrovascular
diseases. Stroke. 25:558-565.
12. YC Wu, YB Zhao, (2004), Correlation between
serum level of neuron-specific enolase and long-
term funtional outcome after acute cerebral
infarction: prospective study, Hong Kong Med J ,
volume 10, No 4, pp 251- 254.