
Measures of Dispersion
Measures of dispersion, or the spread of a number set, can be in many different forms. The two forms covered
on the GRE test are range and standard deviation.
RANGE
The range of a data set is the greatest measurement minus the least measurement. For example, given the fol-
lowing values: 5, 9, 14, 16, and 11, the range would be 16 – 5 = 11.
STANDARD DEVIATION
As you can see, the range is affected by only the two most extreme values in the data set. Standard deviation
is a measure of dispersion that is affected by every measurement. To find the standard deviation of nmeas-
urements, follow these steps:
1. First, find the mean of the measurements.
2. Subtract the mean from each measurement.
3. Square each of the differences.
4. Sum the square values.
5. Divide the sum by n.
6. Choose the nonnegative square root of the quotient.
Example:
When you find the standard deviation of a data set, you are finding the average distance from the mean
for the nmeasurements. It cannot be negative, and when two sets of measurements are compared, the larger
the standard deviation, the larger the dispersion.
x
6
7
7
9
15
16
x 10
4
3
3
1
5
6
(x 10)2
16
9
9
1
25
36
96
STANDARD DEVIATION =
¯¯¯
96
6= 4
In the first column, the mean is 10.
–THE GRE QUANTITATIVE SECTION–
205
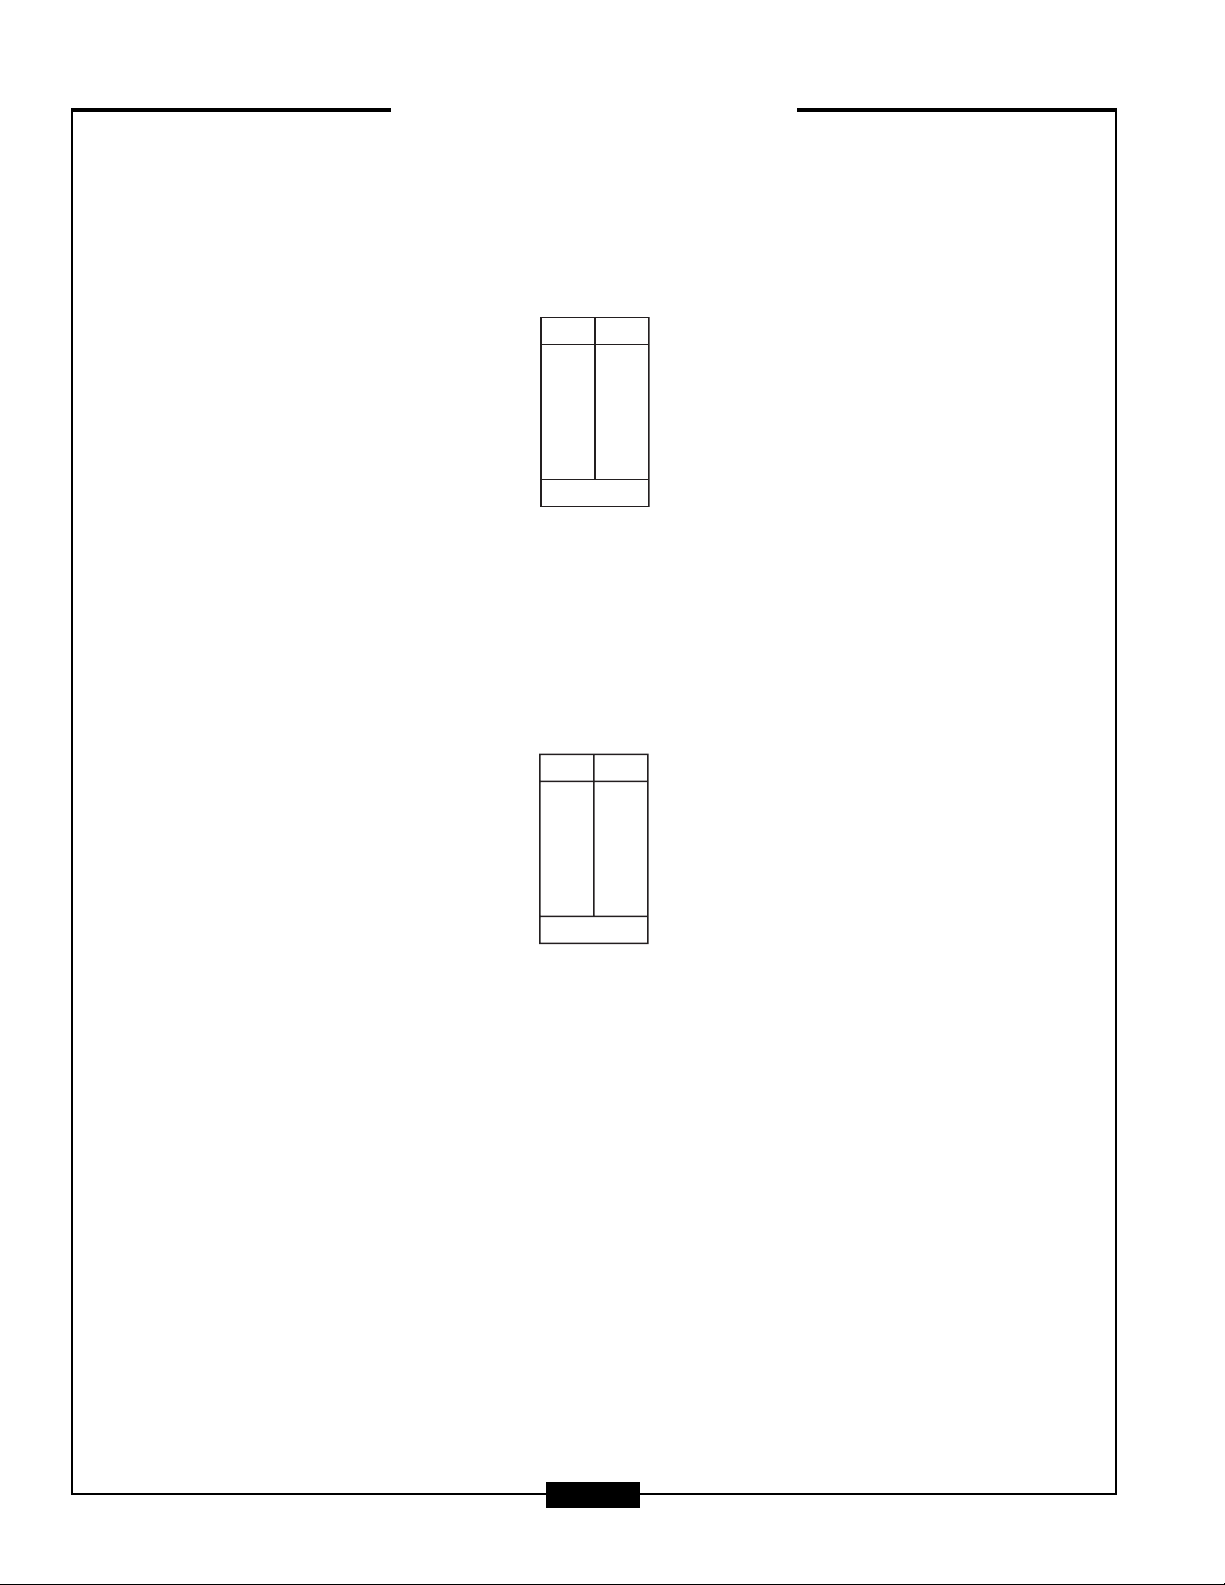
FREQUENCY DISTRIBUTION
The frequency distribution is essentially the number of times, or how frequently, a measurement appears in
a data set. It is represented by a chart like the one below. The xrepresents a measurement, and the frepre-
sents the number of times that measurement occurs.
To use the chart, simply list each measurement only once in the xcolumn and then write how many
times it occurs in the fcolumn.
For example, show the frequency distribution of the following data set that represents the number of
students enrolled in 15 classes at Middleton Technical Institute:
12, 10, 15, 10, 7, 13, 15, 12, 7, 13, 10, 10, 12, 7, 12
Be sure that the total number of measurements taken is equal to the total at the bottom of the frequency
distribution chart.
DATA REPRESENTATION AND INTERPRETATION
The GRE will test your ability to analyze graphs and tables. It is important to read each graph or table very
carefully before reading the question. This will help you process the information that is presented. It is
extremely important to read all the information presented, paying special attention to headings and units of
measure. On the next page is an overview of the types of graphs you will encounter.
Circle Graphs or Pie Charts
This type of graph is representative of a whole and is usually divided into percentages. Each section of the
chart represents a portion of the whole, and all of these sections added together will equal 100% of the whole.
xf
total:
7
10
12
13
15
3
4
4
2
2
15
xf
total:
–THE GRE QUANTITATIVE SECTION–
206
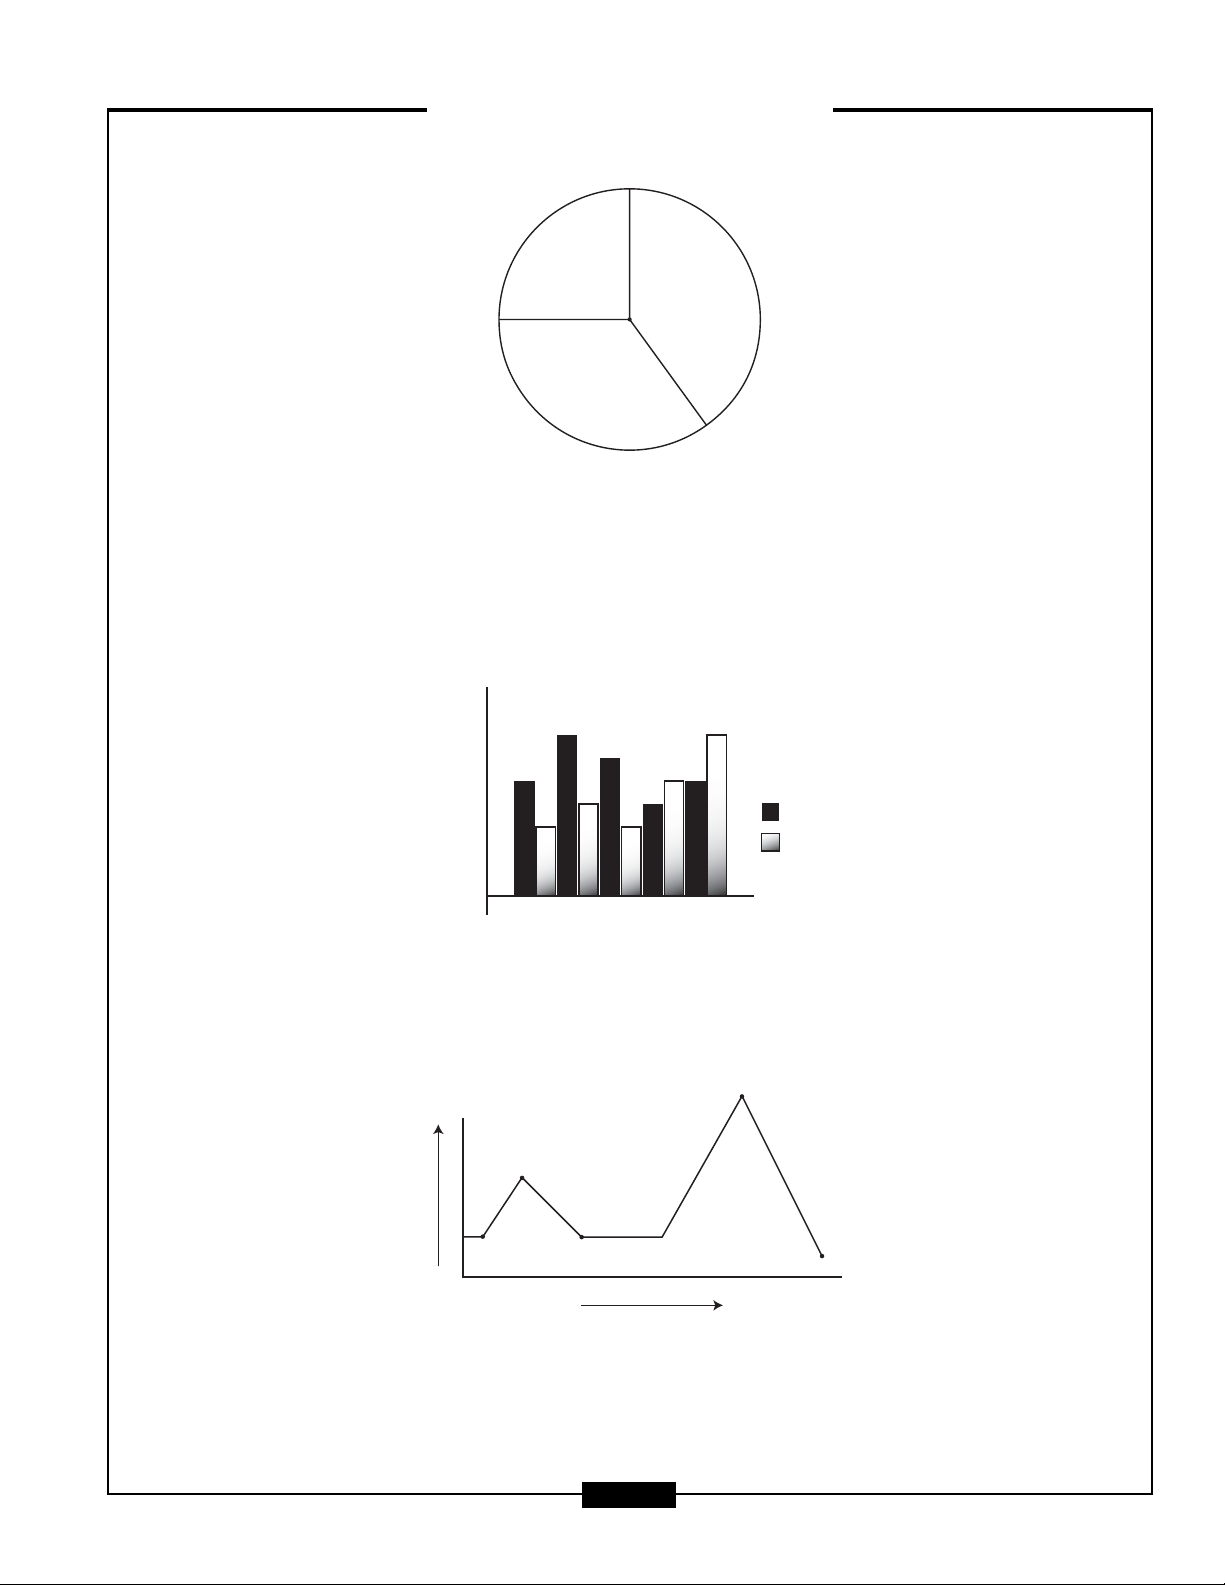
Bar Graphs
Bar graphs compare similar things by using different length bars to represent different values. On the GRE,
these graphs frequently contain differently shaded bars used to represent different elements. Therefore, it is
important to pay attention to both the size and shading of the graph.
Broken-Line Graphs
Broken-line graphs illustrate a measurable change over time. If a line is slanted up, it represents an
increase, whereas a line sloping down represents a decrease. A flat line indicates no change as time elapses.
Increase
Decrease
No Change
Increase
Decrease
Change in Time
Unit of Measure
Comparison of Road Work Funds
of New York and California
1990–1995
New York
California
KEY
0
10
20
30
40
50
60
70
80
90
1991 1992 1993 1994 1995
Money Spent on New Road Work
in Millions of Dollars
Year
25%
40%
35%
–THE GRE QUANTITATIVE SECTION–
207

Percentage and Probability
Part of data analysis is being able to calculate and apply percentages and probability. Further review and exam-
ples of these two concepts are covered further in the following sections.
PERCENTAGE PROBLEMS
There is one formula that is useful for solving the three types of percentage problems:
When reading a percentage problem, substitute the necessary information into the previous formula
based on the following:
■100 is always written in the denominator of the percentage-sign column.
■If given a percentage, write it in the numerator position of the number column. If you are not given a
percentage, then the variable should be placed there.
■The denominator of the number column represents the number that is equal to the whole, or 100%.
This number always follows the word of in a word problem. For example: “ ...13 of20 apples...”
■The numerator of the number column represents the number that is the percent.
■In the formula, the equal sign can be interchanged with the word is.
Example:
Finding a percentage of a given number:
What number is equal to 40% of 50?
Solve by cross multiplying.
100(x) = (40)(50)
100x= 2,000
1
1
0
0
0
0
x
=
2
1
,0
0
0
0
0
x= 20
Therefore, 20 is 40% of 50.
Example:
Finding a number when a percentage is given:
# %
__ = ___
50 100
40
x
# %
100
=
–THE GRE QUANTITATIVE SECTION–
208

40% of what number is 24?
Cross multiply:
(24)(100) = 40x
2,400 = 40x
2,
4
4
0
00
=
4
4
0
0
x
60 = x
Therefore, 40% of 60 is 24.
Example:
Finding what percentage one number is of another:
What percentage of 75 is 15?
Cross multiply:
15(100) (75)(x)
1,500 75x
1,
7
5
5
00
7
7
5
5
x
20 x
Therefore, 20% of 75 is 15.
Probability
Probability is expressed as a fraction; it measures the likelihood that a specific event will occur. To find the
probability of a specific outcome, use this formula:
Probability of an event =
Example:
If a bag contains 5 blue marbles, 3 red marbles, and 6 green marbles, find the probability of
selecting a red marble:
Probability of an event = =
5+
3
3+6
Therefore, the probability of selecting a red marble is
1
3
4
.
Number or specific outcomes
Total number of possible outcomes
Number of specific outcomes
Total number of possible outcomes
# %
__ = ___
75 100
x15
# %
__ = ___
x 100
40
24
–THE GRE QUANTITATIVE SECTION–
209

![Bộ tài liệu học vỡ lòng Tiếng Anh [mới nhất]](https://cdn.tailieu.vn/images/document/thumbnail/2020/20200504/lanxichen/135x160/1651588587086.jpg)
![Đề cương Tiếng Anh phổ thông [năm học]: Tổng hợp đầy đủ nhất](https://cdn.tailieu.vn/images/document/thumbnail/2019/20190717/thukhuyen1257/135x160/7691563342337.jpg)
![10 modals là gì? [Năm hiện tại]](https://cdn.tailieu.vn/images/document/thumbnail/2018/20181029/hongduc7981/135x160/3551540823056.jpg)


![509 mẫu câu tiếng Anh giao tiếp thông dụng nhất: Kho mẫu câu [năm hiện tại]](https://cdn.tailieu.vn/images/document/thumbnail/2026/20260515/baobinh_011/135x160/121778822152.jpg)


%20--%3e%3cdefs%3e%3cstyle%3e%20.st0%20{%20fill:%20%23fff;%20}%20.st1%20{%20fill:%20%237800fa;%20}%20%3c/style%3e%3c/defs%3e%3cpath%20class='st1'%20d='M117.78,12.18H43.11c2.9,3.47,4.65,7.94,4.65,12.82,0,5.6-2.3,10.66-6.01,14.29h76.02l7.22-13.56-7.22-13.56Z'/%3e%3cg%3e%3cpath%20class='st0'%20d='M53.58,26.17h-.59v-1.46h.59v-4.96h2.83c1.78,0,2.67.94,2.67,2.82v5.76c0,1.87-.89,2.81-2.67,2.81h-2.83v-4.96ZM55.36,21.37v3.34h1.1v1.46h-1.1v3.34h1.01c.61,0,.91-.37.91-1.1v-5.93c0-.74-.3-1.1-.91-1.1h-1.01Z'/%3e%3cpath%20class='st0'%20d='M65.99,31.14h-1.8l-.31-2.07h-2.19l-.31,2.07h-1.64l1.82-11.39h2.62l1.82,11.39ZM65.28,18.04c-.25.46-.51.77-.75.94-.21.15-.47.22-.79.22-.26,0-.57-.07-.92-.22l-.38-.15c-.14-.05-.26-.07-.37-.07-.3,0-.53.18-.71.54l-.91-.68c.25-.46.51-.77.75-.94.21-.14.48-.21.79-.21.26,0,.57.07.92.21l.38.15c.14.05.26.07.37.07.3,0,.53-.18.71-.54l.91.68ZM61.91,27.52h1.73l-.87-5.76-.87,5.76Z'/%3e%3cpath%20class='st0'%20d='M74.53,26.89v1.52c0,1.91-.89,2.86-2.67,2.86s-2.67-.95-2.67-2.86v-5.93c0-1.91.89-2.86,2.67-2.86s2.67.95,2.67,2.86v1.11h-1.69v-1.22c0-.75-.31-1.12-.93-1.12s-.93.37-.93,1.12v6.15c0,.74.31,1.11.93,1.11s.93-.37.93-1.11v-1.63h1.69Z'/%3e%3cpath%20class='st0'%20d='M81.4,31.14h-1.8l-.31-2.07h-2.19l-.31,2.07h-1.64l1.82-11.39h2.62l1.82,11.39ZM75.9,19.2l1.52-1.91h1.71l1.51,1.91h-1.61l-.76-.95-.75.95h-1.61ZM77.32,27.52h1.73l-.87-5.76-.87,5.76ZM83.1,15.99l-1.76,1.91h-1.26l1.17-1.91h1.86Z'/%3e%3cpath%20class='st0'%20d='M84.86,19.75c1.78,0,2.67.94,2.67,2.82v1.48c0,1.87-.89,2.81-2.67,2.81h-.85v4.28h-1.79v-11.39h2.64ZM84.01,21.37v3.86h.85c.58,0,.87-.36.87-1.08v-1.71c0-.71-.29-1.07-.87-1.07h-.85Z'/%3e%3cpath%20class='st0'%20d='M93.51,19.75c1.78,0,2.67.94,2.67,2.82v1.48c0,1.87-.89,2.81-2.67,2.81h-.85v4.28h-1.79v-11.39h2.64ZM92.66,21.37v3.86h.85c.58,0,.87-.36.87-1.08v-1.71c0-.71-.29-1.07-.87-1.07h-.85Z'/%3e%3cpath%20class='st0'%20d='M98.8,31.14h-1.79v-11.39h1.79v4.88h2.03v-4.88h1.83v11.39h-1.83v-4.88h-2.03v4.88Z'/%3e%3cpath%20class='st0'%20d='M105.36,24.55h2.46v1.62h-2.46v3.34h3.09v1.63h-4.88v-11.39h4.88v1.63h-3.09v3.18ZM108.17,17.29l-1.76,1.91h-1.26l1.17-1.91h1.86Z'/%3e%3cpath%20class='st0'%20d='M112.2,19.75c1.78,0,2.67.94,2.67,2.82v1.48c0,1.87-.89,2.81-2.67,2.81h-.85v4.28h-1.79v-11.39h2.64ZM111.35,21.37v3.86h.85c.58,0,.87-.36.87-1.08v-1.71c0-.71-.29-1.07-.87-1.07h-.85Z'/%3e%3c/g%3e%3ccircle%20class='st1'%20cx='25'%20cy='25'%20r='20'/%3e%3cpath%20class='st0'%20d='M32.78,19.27c2.92,0,4.43,2.55,5.28,5.33l.71,2.17c.14.38-.33.75-.71.75h-5.61c.19-.33.24-.71.09-1.08l-.75-2.45c-.43-1.32-.99-2.64-1.79-3.77.75-.57,1.65-.94,2.78-.94h0ZM25,18.38c3.25,0,4.9,2.78,5.89,5.89l.76,2.45c.14.42-.33.8-.8.8h-11.69c-.42,0-.94-.38-.8-.8l.75-2.45c.99-3.11,2.64-5.89,5.89-5.89h0ZM25,11.35c1.74,0,3.11,1.37,3.11,3.11s-1.37,3.11-3.11,3.11-3.11-1.41-3.11-3.11,1.41-3.11,3.11-3.11h0ZM17.27,19.27c1.08,0,1.98.38,2.73.94-.8,1.13-1.37,2.45-1.74,3.77l-.8,2.45c-.14.38-.05.75.09,1.08h-5.56c-.42,0-.9-.38-.75-.75l.71-2.17c.9-2.78,2.41-5.33,5.33-5.33h0ZM17.27,12.91c1.51,0,2.78,1.27,2.78,2.83s-1.27,2.83-2.78,2.83-2.83-1.27-2.83-2.83,1.27-2.83,2.83-2.83h0ZM32.78,12.91c1.56,0,2.78,1.27,2.78,2.83s-1.23,2.83-2.78,2.83-2.83-1.27-2.83-2.83,1.27-2.83,2.83-2.83h0ZM27.07,28.56v.09c0,.57-.24,1.08-.61,1.46h0v.05c-.38.33-.9.57-1.46.57s-1.08-.24-1.46-.61h0c-.38-.38-.61-.9-.61-1.46v-.09h1.41v.09c0,.19.05.38.19.47v.05c.09.09.28.19.47.19s.38-.09.47-.19v-.05c.14-.09.24-.28.24-.47t-.05-.09h1.41ZM30.99,28.56v.09c0,1.65-.66,3.16-1.74,4.24-1.08,1.08-2.59,1.79-4.24,1.79s-3.16-.71-4.24-1.79l-.05-.05c-1.04-1.08-1.7-2.55-1.7-4.2v-.09h1.41v.09c0,1.27.47,2.4,1.27,3.25h.05c.85.85,1.98,1.37,3.25,1.37s2.4-.52,3.25-1.37c.85-.8,1.37-1.98,1.37-3.25v-.09h1.37ZM34.99,28.56v.09c0,2.78-1.13,5.28-2.92,7.07-1.79,1.79-4.29,2.92-7.07,2.92s-5.23-1.13-7.07-2.92c-1.79-1.79-2.92-4.29-2.92-7.07v-.09h1.41v.09c0,2.4.94,4.53,2.5,6.08,1.56,1.56,3.72,2.5,6.08,2.5s4.52-.94,6.08-2.5c1.56-1.56,2.5-3.68,2.5-6.08v-.09h1.41Z'/%3e%3c/svg%3e)