
RESEARC H Open Access
High expression of transcriptional coactivator
p300 correlates with aggressive features and
poor prognosis of hepatocellular carcinoma
Mei Li
1,2†
, Rong-Zhen Luo
1,2†
, Jie-Wei Chen
1,2
, Yun Cao
1,2
, Jia-Bin Lu
1,2
, Jie-Hua He
1,2
, Qiu-Liang Wu
1,2
,
Mu-Yan Cai
1,2*
Abstract
Background: It has been suggested that p300 participates in the regulation of a wide range of cell biological
processes and mutation of p300 has been identified in certain types of human cancers. However, the expression
dynamics of p300 in hepatocellular carcinoma (HCC) and its clinical/prognostic significance are unclear.
Methods: In this study, the methods of reverse transcription-polymerase chain reaction (RT-PCR), Western blotting
and immunohistochemistry (IHC) were utilized to investigate protein/mRNA expression of p300 in HCCs. Receiver
operating characteristic (ROC) curve analysis, spearman’s rank correlation, Kaplan-Meier plots and Cox proportional
hazards regression model were used to analyze the data.
Results: Up-regulated expression of p300 mRNA and protein was observed in the majority of HCCs by RT-PCR and
Western blotting, when compared with their adjacent non-malignant liver tissues. According to the ROC curves,
the cutoff score for p300 high expression was defined when more than 60% of the tumor cells were positively
stained. High expression of p300 was examined in 60/123 (48.8%) of HCCs and in 8/123 (6.5%) of adjacent non-
malignant liver tissues. High expression of p300 was correlated with higher AFP level, larger tumor size, multiplicity,
poorer differentiation and later stage (P< 0.05). In univariate survival analysis, a significant association between
overexpression of p300 and shortened patients’survival was found (P= 0.001). In different subsets of HCC patients,
p300 expression was also a prognostic indicator in patients with stage II (P= 0.007) and stage III (P= 0.011).
Importantly, p300 expression was evaluated as an independent prognostic factor in multivariate analysis (P=
0.021). Consequently, a new clinicopathologic prognostic model with three poor prognostic factors (p300
expression, AFP level and vascular invasion) was constructed. The model could significantly stratify risk (low,
intermediate and high) for overall survival (P< 0.0001).
Conclusions: Our findings provide a basis for the concept that high expression of p300 in HCC may be important
in the acquisition of an aggressive phenotype, suggesting that p300 overexpression, as examined by IHC, is an
independent biomarker for poor prognosis of patients with HCC. The combined clinicopathologic prognostic
model may become a useful tool for identifying HCC patients with different clinical outcomes.
Background
Hepatocellular carcinoma (HCC) is the fifth most com-
mon cancer in the world and the third leading cause of
cancer mortality [1]. It is among the top three causes of
cancer death in the Asian Pacific region due to the high
prevalence of chronic hepatitis B virus and hepatitis C
virus infections, and recently its incidence in the United
States and in Western Europe has been increasing [2,3].
Despite new therapies and attempts for early detection
of primary HCC, the long-term survival of HCC patient
remains poor. Surgery is considered as one of the stan-
dard curative treatments for HCC if the tumor is resect-
able [4]. However, the prognosis of HCC patients with
the same clinical stage often differs substantially in spite
* Correspondence: caimuyan@hotmail.com
†Contributed equally
1
State Key Laboratory of Oncology in South China, Sun Yat-Sen University
Cancer Center, Guangzhou, PR China
Full list of author information is available at the end of the article
Li et al.Journal of Translational Medicine 2011, 9:5
http://www.translational-medicine.com/content/9/1/5
© 2011 Li et al; licensee BioMed Central Ltd. This is an Open Access article distributed under the terms of the Creative Commons
Attribution License (http://creativecommons.org/licenses/by/2.0), which permits unrestricted use, distribution, and reproduction in
any medium, provided the original work is properly cited.

of curative surgical resection and such large variation is
mostly unexplained. Thus, a large amount of investiga-
tionsonHCChavefocusedonthediscoveryofspecific
molecular markers that could serve as reliable prognos-
tic factors. To date, however, the search for specific
molecules in HCC cells that have clinical/prognostic
value remains substantially limited.
Recently, it has been reported that p300, a member of
the histone acetyltransferase family of transcriptional
coactivator, is found to play a variety of roles in the
transcription process and catalyzes histone acetylation
through its histone acetyltransferase activity [5,6]. Tran-
scriptional coactivator p300 has been shown to partici-
pate in the regulation of various cellular processes such
as proliferation, differentiation, apoptosis, cell-cycle reg-
ulation and DNA damage response [7]. A tumor sup-
pressor role of p300 has been identified in certain types
of human cancers, including breast, colorectal and gas-
tric carcinoma [8,9]. However, several studies suggest
that transcriptional coactivator p300 is a positive regula-
tor of cancer progression and related to tumorigenesis
of various human cancers [10,11]. The translational co-
activator p300 was found to be involved in the integrin
beta-1-mediated histone acetylation and p21 transcrip-
tional activation in HCC [12]. In addition, Wang et al
[13] suggested that a direct role of phosphor-CREB in
p300 and Brg I recruitment to the Hulc promoter led to
the activation of epigenetic markers and chromatin
remodeling at the same location in hepatic cancer cells.
It has also been reported that p300 expression correlates
with nuclear alterations of tumor cells and contributes
to the growth of prostate carcinoma and is a predictor
of aggressive features of this cancer [14,15].
Up to date, the clinicopathologic/prognostic implica-
tion of p300 in HCC has not been explored. In this
study, reverse transcription-polymerase chain reaction
(RT-PCR), Western blotting, immunohistochemistry
(IHC) and tissue microarray were utilized to examine
the distribution and frequency of p300 expression in our
HCC cohort and adjacent non-malignant liver tissues. In
order to avoid predetermined cutpoint, receiver operat-
ing characteristic (ROC) curve analysis was employed to
define the cutoff score for high expression of p300. In
addition, the correlation between p300 expression and
cell proliferation levels in our HCCs was analyzed using
the Ki-67 assessment marker.
Methods
Patients and tissue specimens
In this study, the paraffin-embedded pathologic speci-
mens from 123 patients with HCC were obtained from
the archives of Department of Pathology, Sun Yat-Sen
University Cancer Center, Guangzhou, China, between
July 2005 and May 2008. The cases selected were based
on distinctive pathologic diagnosis of HCC, undergoing
primary and curative resection for tumor without preo-
perative anticancer treatment, availability of resection
tissue and follow-up data. These HCC cases included
107 (87.0%) men and 16 (13.0%) women, with mean age
of 47.7 years. Average follow-up time was 26.79 months
(median, 28.0 months; range, 1.0 to 61 months).
Patients whose cause of death remained unknown
were excluded from our study. Clinicopathologic charac-
teristics for these patients including age, sex, hepatitis
history, alpha-fetoprotein (AFP), liver cirrhosis, tumor
number, size, differentiation,stage,vascularinvasion
and relapse were detailed in Table 1. Tumor differentia-
tion was based on the criteria proposed by Edmonson
and Steiner [16]. Tumor stage was defined according to
American Joint Committee on Cancer/International
Union Against Cancer tumor-node-metastasis (TNM)
classification system [17]. Institute Research Medical
Ethics Committee of Sun Yat-Sen University Cancer
Center granted approval for this study.
RT-PCR
Total RNA was isolated from 8 pairs of HCC tissues
and adjacent non-malignant liver tissues using TRIZOL
reagent (Invitrogen, Carlsbad, CA). RNA was reverse-
transcribed using SuperScript First Strand cDNA System
(Invitrogen, Carlsbad, CA) according to the manufac-
ture’s instructions. PCR was performed as described pre-
viously using specific primers for p300 [18]. The
expression of GAPDH was monitored as a control.
Western blotting analysis
Equal amounts of whole cell and tissue lysates were
resolved by SDS-polyacrylamide gel electrophoresis
(PAGE) and electrotransferred on a polyvinylidene
difluoride (PVDF) membrane (Pall Corp., Port Washing-
ton, NY). The tissues were then incubated with primary
mouse monoclonal antibodies against human anti-p300
(Abcam, Cambridge, MA) at a concentration of 0.5 μg/
ml. The immunoreactive signals were detected with
enhanced chemiluminescence kit (Amersham Bios-
ciences, Uppsala, Sweden). The procedures followed
were conducted in accordance with the manufacturer’s
instructions.
Tissue microarray (TMA) construction
Tissue microarray was constructed as the method
described previously [19]. In brief, formalin-fixed, paraf-
fin-embedded tissue blocks and the corresponding
H&E-stained slides were overlaid for TMA sampling.
The slides were reviewed by a senior pathologist (M-Y.
C.) to determine and mark out representative tumor
areas. Triplicates of 0.6 mm diameter cylinders were
punched from representative tumor areas and from
Li et al.Journal of Translational Medicine 2011, 9:5
http://www.translational-medicine.com/content/9/1/5
Page 2 of 11

adjacent non-malignant liver tissue of individual donor
tissue block and re-embedded into a recipient paraffin
block at defined position, using a tissue arraying
instrument (Beecher Instruments, Silver Spring, MD).
The TMA block contained 126 HCCs and adjacent non-
malignant liver tissues.
Immunohistochemistry (IHC)
The TMA slides were dried overnight at 37°C,deparaffi-
nized in xylene, rehydrated through graded alcohol,
immersed in 3% hydrogen peroxide for 20 minutes to
block endogenous peroxidase activity, and antigen-
retrieved by pressure cooking for 3 minutes in ethylene-
diamine tetraacetic acid (EDTA) buffer (pH = 8.0). Then
the slides were preincubated with 10% normal goat
serum at room temperature for 30 minutes to reduce
nonspecific reaction. Subsequently, the slides were incu-
bated with mouse monoclonal anti-p300 (Abcam, Cam-
bridge, MA) at a concentration of 3 ng/ml and mouse
monoclonal anti-Ki-67 (Zymed Laboratories Inc., South
San Francisco, CA, 1:100 dilution) for 2 hours at room
temperature. The slides were sequentially incubated
with a secondary antibody (Envision; Dako, Glostrup,
Denmark) for 1 hour at room temperature, and stained
with DAB (3,3-diaminobenzidine). Finally, the sections
were counterstained with Mayer’s hematoxylin, dehy-
drated, and mounted. A negative control was obtained
by replacing the primary antibody with a normal murine
IgG. Known immunostaining positive slides were used
as positive controls.
IHC evaluation
Nuclear immunoreactivity for p300 protein was reported
in semi-quantitative method by evaluating the number
of positive tumor cells over the total number of tumor
cells. Scores were assigned by using 5% increments (0%,
5%, 10%-100%). Expression for p300 was scored by 3
independent pathologists (M. L., R-Z. L. and M-Y. C.)
blinded to clinicopathologic data. Their conclusions
were in complete agreement in 82.1% of the cases,
which identified this scoring method as highly
reproducible.
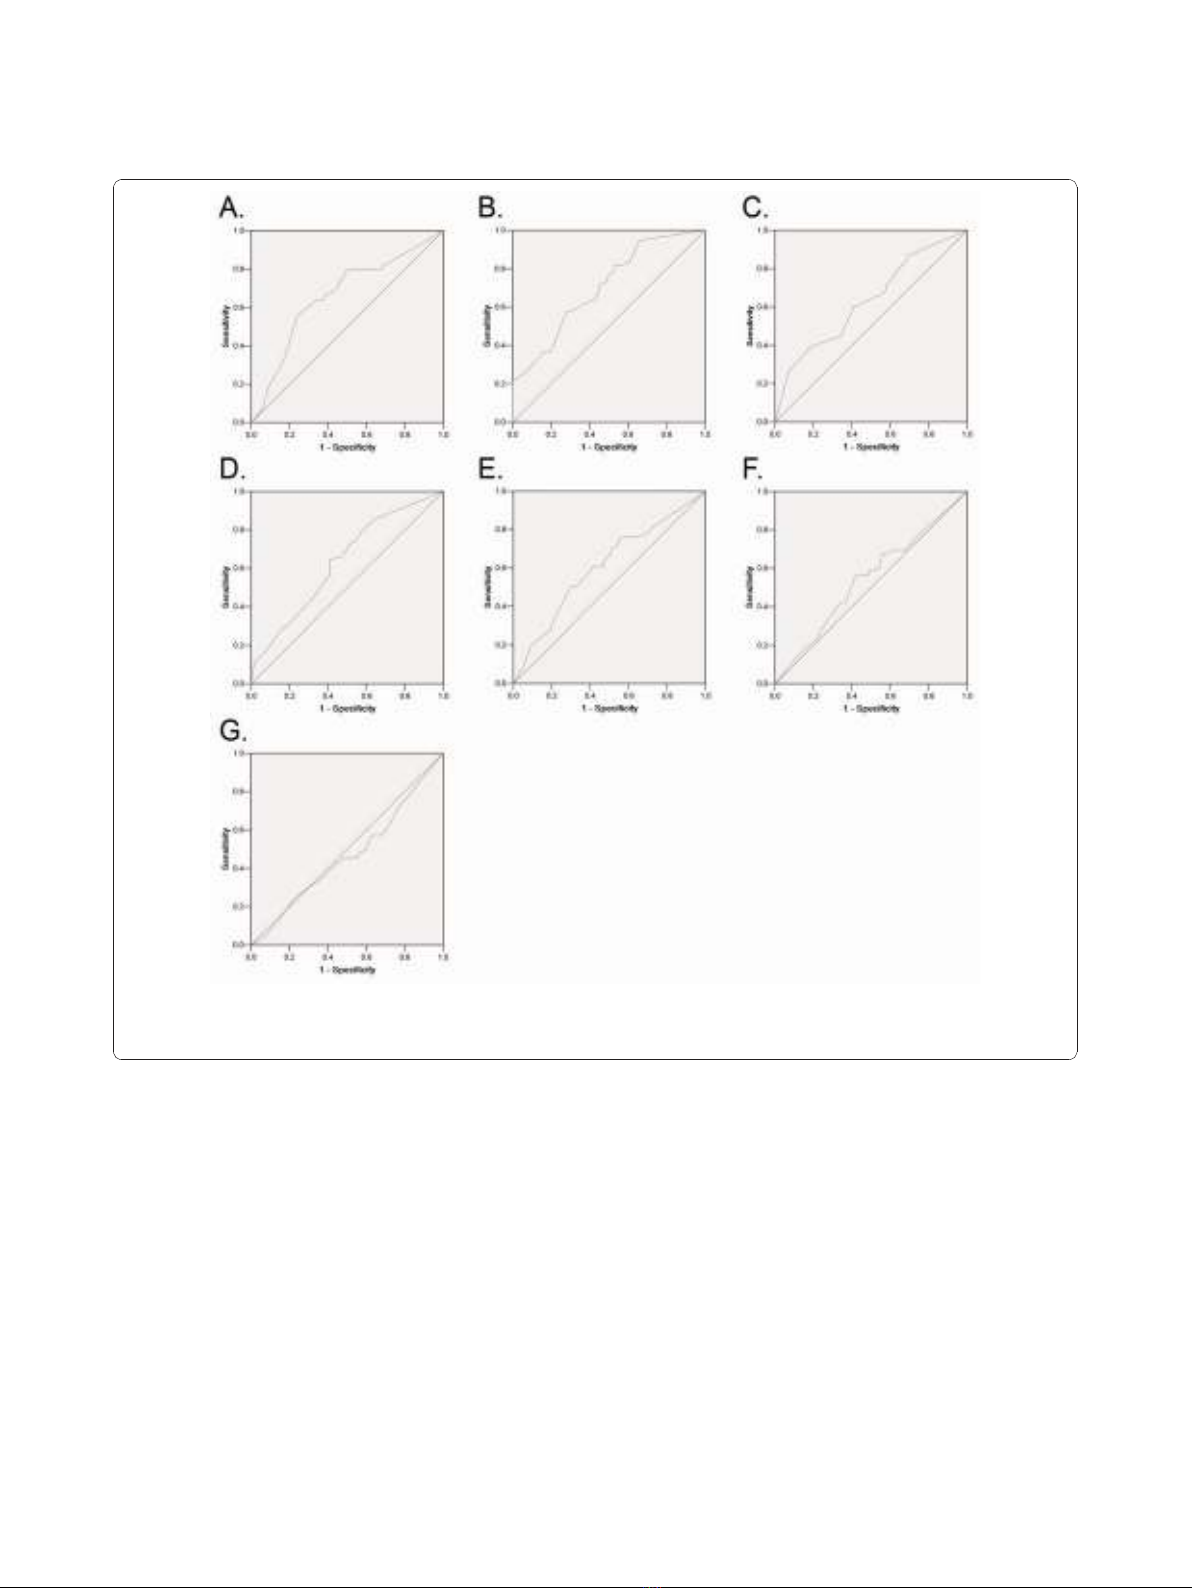
Selection of Cutoff Score
ROC curve analysis was employed to determine cutoff
score for tumor “high expression”by using the 0,1-
criterion [20]. At the p300 score, the sensitivity and spe-
cificity for each outcome under study was plotted, thus
generating various ROC curves (Figure 1). The score
was selected as the cutoff value, which was closest to
the point with both maximum sensitivity and specificity.
Tumors designated as “low expression”for p300 were
those with scores below or equal to the cutoff value,
while “high expression”tumors were those with scores
above the value. In order to use ROC curve analysis, the
clinicopathologic features were dichotomized: AFP level
(≤20 ng/ml or >20 ng/ml), tumor size (≤5cmor>5
cm), tumor multiplicity (single or multiple), tumor
Table 1 Correlation of p300 expression with patients’
clinicopathologic features in primary hepatocellular
carcinomas
p300 protein
Variable All
cases
Low
expression
High
expression
P
value
a
Age (years) 0.267
≤47.7
b
59 28 (47.5%) 31 (52.5%)
>47.7 64 35 (54.7%) 29 (45.3%)
Sex 0.564
Male 107 55 (51.4%) 52 (48.6%)
Female 16 8 (50.0%) 8 (50.0%)
Etiology 0.295
HBV 97 48 (49.5%) 49 (50.5%)
HCV 8 3 (37.5%) 5 (62.5%)
None 18 12 (66.7%) 6 (33.3%)
AFP (ng/ml) 0.000
≤20 68 46 (67.6%) 22 (32.4%)
>20 55 17 (30.9%) 38 (69.1%)
Liver cirrhosis 0.334
Yes 87 47 (54.0%) 40 (46.0%)
No 36 16 (44.4%) 20 (55.6%)
Tumor size (cm) 0.000
≤5 76 50 (65.8%) 26 (34.2%)
>5 47 13 (27.7%) 34 (72.3%)
Tumor multiplicity 0.012
Single 85 50 (58.8%) 35 (41.2%)
Multiple 38 13 (34.2%) 25 (65.8%)
Differentiation 0.036
Well 15 12 (80.0%) 3 (20.0%)
Moderate 70 36 (51.4%) 34 (48.6%)
Poor 32 14 (43.8%) 18 (56.3%)
Undifferentiated 6 1 (16.7%) 5 (83.3%)
Stage 0.015
I 12 10 (83.3%) 2 (16.7%)
II 49 27 (55.1%) 22 (44.9%)
III 48 23 (47.9%) 25 (52.1%)
IV 14 3 (21.4%) 11 (78.6%)
Vascular invasion 0.130
Yes 55 24 (43.6%) 31 (56.4%)
No 68 39 (57.4%) 29 (42.6%)
Relapse 0.182
Yes 42 18 (42.9%) 24 (57.1%)
No 81 45 (55.6%) 36 (44.4%)
Ki67 expression 0.002
Low 68 44 (64.7%) 24 (35.3%)
High 50 18 (36.0%) 32 (64.0%)
a
Chi-square test;
b
Mean age; HBV, hepatitis B virus; HCV, hepatitis B virus; AFP,
alpha-fetoprotein.
Li et al.Journal of Translational Medicine 2011, 9:5
http://www.translational-medicine.com/content/9/1/5
Page 3 of 11
grade (well-moderately or poorly-undifferentiated), stage
(I + II or III + IV), vascular invasion (absence or pre-
sence), relapse (absence or presence) and survival status
(death due to HCC or censored).
Statistical analysis
Statistical analysis was performed by using the SPSS sta-
tistical software package (standard version 13.0; SPSS,
Chicago, IL). ROC curve analysis was applied to deter-
mine the cutoff score for high expression of p300 and
Ki67. The correlation between p300 expression and clin-
icopathologic features of HCC patients was evaluated by
c
2
-test. Univariate and multivariate survival analyses
were performed using the Cox proportional hazards
regression model. Survival curves were obtained with
the Kaplan-Meier method. Predictive accuracy was
quantified using the Harrell concordance index. Differ-
ences were considered significant if the P-value from a
two-tailed test was <0.05.
Results
p300 mRNA expression examined by RT-PCR and p300
protein expression by Western blotting in liver tissues
In this study, the status of expression of p300 mRNA
and p300 protein was further examined by RT-PCR and
Western blotting, respectively, in 8 pairs of fresh HCC
and adjacent non-tumorous liver specimens. The results
showed that a total of 5/8 (62.5%) HCCs was examined
as having up-regulated p300 mRNA expression, when
compared with their adjacent non-malignant liver
Figure 1 ROC curve analysis was created to determine the cutoff score for high expression of p300 protein. The sensitivity and
specificity for each outcome were plotted: AFP level (A.), tumor size (B.), tumor multiplicity (C.), tumor differentiation (D.), clinical stage (E.),
vascular invasion (F.), tumor relapse(G.).
Li et al.Journal of Translational Medicine 2011, 9:5
http://www.translational-medicine.com/content/9/1/5
Page 4 of 11
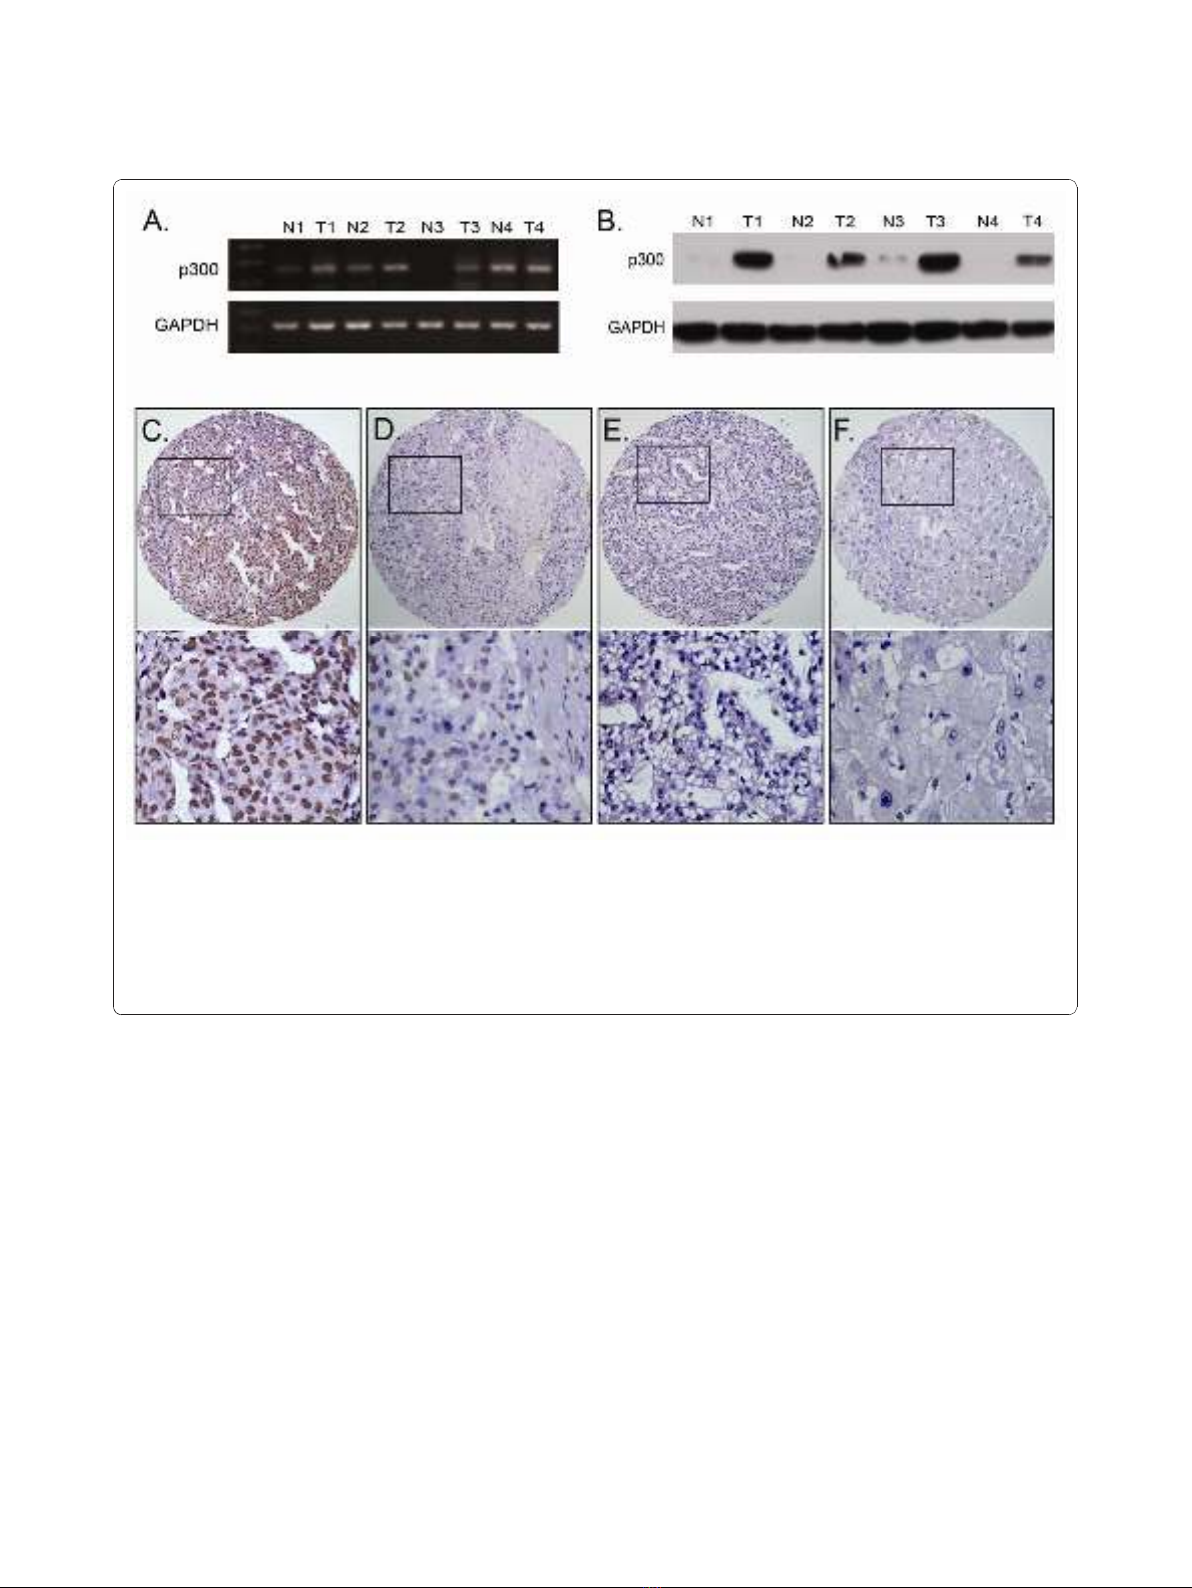
tissues (Figure 2A). Up-regulated expression of p300
protein was observed in 6/8 (75.0%) HCCs, and in each
of the four cases with up-regulated p300 protein, up-
regulated p300 mRNA was observed (Figure 2B).
The expression of p300 in HCC and adjacent non-
malignant liver tissues by IHC
For p300 IHC staining in HCCs and adjacent non-
malignant liver tissues, immunoreactivity was primarily
observed in the nuclei within tumor cells (Figure 2C).
p300 expression could be evaluated informatively in 123
HCCs by the TMA constructed previously. The non-
informative 3 TMA samples included samples with too
few tumor cells (<300 cells per case) and lost samples.
Immunoreactivity of p300 in HCC ranged from 0% to
100% (Figure 2C-2F). According to ROC curve analysis,
expression percentage for p300 above the cutoff value
60% was defined as high expression, while below or
equal to the cutoff value was considered as low expres-
sion. In this study, 16 of the 123 (13.0%) HCC samples
showed completely negative staining of p300. High
expression of p300 could be detected in 60/123 (48.8%)
of HCCs, in 6/87 (6.9%) of adjacent liver tissues with
cirrhosis and in 2/36 (5.6%) of adjacent normal liver tis-
sues without cirrhosis, respectively (P< 0.0001, Fisher’s
exact test).
Selection of cutoff scores for p300 expression
The ROC curves for each clinicopathological parameter
(Figure 1) clearly show the point on the curve closest to
(0.0, 1.0) which maximizes both sensitivity and specifi-
city for the outcome as described in our previous study
[19]. Tumors with scores above the obtained cutoff
value were considered as high p300 expression leading
Figure 2 The mRNA and protein expression of p300 in HCC and adjacent non-malignant liver tissues. A. Up-regulated expression of p300
mRNA was examined by RT-PCR in 3/4 HCC cases, when compared with adjacent non-malignant liver tissues. B. Up-regulated expression of p300
protein was detected by Western blotting in 4/4 HCC cases, when compared with adjacent non-malignant liver tissues. C. High expression of
p300 was observed in a HCC (case 26), in which more than 90% tumor cells revealed positive immunostaining of p300 in nuclei (upper panel,×
100). D. A HCC case (case 81) demonstrated low expression of p300, in which less than 50% of tumor cells showed immunoreactivity of p300
protein in nuclei (upper panel, × 100). E. Nearly negative expression of p300 protein was demonstrated in a HCC case (case 57, upper panel,×
100). F. The adjacent non-malignant liver tissues of HCC case 26 showed nearly negative expression of p300 protein (upper panel, × 100). The
lower panels indicated the higher magnification (× 400) from the area of the box in C., D., E. and F., respectively.
Li et al.Journal of Translational Medicine 2011, 9:5
http://www.translational-medicine.com/content/9/1/5
Page 5 of 11


![Vaccine và ứng dụng: Bài tiểu luận [chuẩn SEO]](https://cdn.tailieu.vn/images/document/thumbnail/2016/20160519/3008140018/135x160/652005293.jpg)


%20--%3e%3cdefs%3e%3cstyle%3e%20.st0%20{%20fill:%20%23fff;%20}%20.st1%20{%20fill:%20%237800fa;%20}%20%3c/style%3e%3c/defs%3e%3cpath%20class='st1'%20d='M117.78,12.18H43.11c2.9,3.47,4.65,7.94,4.65,12.82,0,5.6-2.3,10.66-6.01,14.29h76.02l7.22-13.56-7.22-13.56Z'/%3e%3cg%3e%3cpath%20class='st0'%20d='M53.58,26.17h-.59v-1.46h.59v-4.96h2.83c1.78,0,2.67.94,2.67,2.82v5.76c0,1.87-.89,2.81-2.67,2.81h-2.83v-4.96ZM55.36,21.37v3.34h1.1v1.46h-1.1v3.34h1.01c.61,0,.91-.37.91-1.1v-5.93c0-.74-.3-1.1-.91-1.1h-1.01Z'/%3e%3cpath%20class='st0'%20d='M65.99,31.14h-1.8l-.31-2.07h-2.19l-.31,2.07h-1.64l1.82-11.39h2.62l1.82,11.39ZM65.28,18.04c-.25.46-.51.77-.75.94-.21.15-.47.22-.79.22-.26,0-.57-.07-.92-.22l-.38-.15c-.14-.05-.26-.07-.37-.07-.3,0-.53.18-.71.54l-.91-.68c.25-.46.51-.77.75-.94.21-.14.48-.21.79-.21.26,0,.57.07.92.21l.38.15c.14.05.26.07.37.07.3,0,.53-.18.71-.54l.91.68ZM61.91,27.52h1.73l-.87-5.76-.87,5.76Z'/%3e%3cpath%20class='st0'%20d='M74.53,26.89v1.52c0,1.91-.89,2.86-2.67,2.86s-2.67-.95-2.67-2.86v-5.93c0-1.91.89-2.86,2.67-2.86s2.67.95,2.67,2.86v1.11h-1.69v-1.22c0-.75-.31-1.12-.93-1.12s-.93.37-.93,1.12v6.15c0,.74.31,1.11.93,1.11s.93-.37.93-1.11v-1.63h1.69Z'/%3e%3cpath%20class='st0'%20d='M81.4,31.14h-1.8l-.31-2.07h-2.19l-.31,2.07h-1.64l1.82-11.39h2.62l1.82,11.39ZM75.9,19.2l1.52-1.91h1.71l1.51,1.91h-1.61l-.76-.95-.75.95h-1.61ZM77.32,27.52h1.73l-.87-5.76-.87,5.76ZM83.1,15.99l-1.76,1.91h-1.26l1.17-1.91h1.86Z'/%3e%3cpath%20class='st0'%20d='M84.86,19.75c1.78,0,2.67.94,2.67,2.82v1.48c0,1.87-.89,2.81-2.67,2.81h-.85v4.28h-1.79v-11.39h2.64ZM84.01,21.37v3.86h.85c.58,0,.87-.36.87-1.08v-1.71c0-.71-.29-1.07-.87-1.07h-.85Z'/%3e%3cpath%20class='st0'%20d='M93.51,19.75c1.78,0,2.67.94,2.67,2.82v1.48c0,1.87-.89,2.81-2.67,2.81h-.85v4.28h-1.79v-11.39h2.64ZM92.66,21.37v3.86h.85c.58,0,.87-.36.87-1.08v-1.71c0-.71-.29-1.07-.87-1.07h-.85Z'/%3e%3cpath%20class='st0'%20d='M98.8,31.14h-1.79v-11.39h1.79v4.88h2.03v-4.88h1.83v11.39h-1.83v-4.88h-2.03v4.88Z'/%3e%3cpath%20class='st0'%20d='M105.36,24.55h2.46v1.62h-2.46v3.34h3.09v1.63h-4.88v-11.39h4.88v1.63h-3.09v3.18ZM108.17,17.29l-1.76,1.91h-1.26l1.17-1.91h1.86Z'/%3e%3cpath%20class='st0'%20d='M112.2,19.75c1.78,0,2.67.94,2.67,2.82v1.48c0,1.87-.89,2.81-2.67,2.81h-.85v4.28h-1.79v-11.39h2.64ZM111.35,21.37v3.86h.85c.58,0,.87-.36.87-1.08v-1.71c0-.71-.29-1.07-.87-1.07h-.85Z'/%3e%3c/g%3e%3ccircle%20class='st1'%20cx='25'%20cy='25'%20r='20'/%3e%3cpath%20class='st0'%20d='M32.78,19.27c2.92,0,4.43,2.55,5.28,5.33l.71,2.17c.14.38-.33.75-.71.75h-5.61c.19-.33.24-.71.09-1.08l-.75-2.45c-.43-1.32-.99-2.64-1.79-3.77.75-.57,1.65-.94,2.78-.94h0ZM25,18.38c3.25,0,4.9,2.78,5.89,5.89l.76,2.45c.14.42-.33.8-.8.8h-11.69c-.42,0-.94-.38-.8-.8l.75-2.45c.99-3.11,2.64-5.89,5.89-5.89h0ZM25,11.35c1.74,0,3.11,1.37,3.11,3.11s-1.37,3.11-3.11,3.11-3.11-1.41-3.11-3.11,1.41-3.11,3.11-3.11h0ZM17.27,19.27c1.08,0,1.98.38,2.73.94-.8,1.13-1.37,2.45-1.74,3.77l-.8,2.45c-.14.38-.05.75.09,1.08h-5.56c-.42,0-.9-.38-.75-.75l.71-2.17c.9-2.78,2.41-5.33,5.33-5.33h0ZM17.27,12.91c1.51,0,2.78,1.27,2.78,2.83s-1.27,2.83-2.78,2.83-2.83-1.27-2.83-2.83,1.27-2.83,2.83-2.83h0ZM32.78,12.91c1.56,0,2.78,1.27,2.78,2.83s-1.23,2.83-2.78,2.83-2.83-1.27-2.83-2.83,1.27-2.83,2.83-2.83h0ZM27.07,28.56v.09c0,.57-.24,1.08-.61,1.46h0v.05c-.38.33-.9.57-1.46.57s-1.08-.24-1.46-.61h0c-.38-.38-.61-.9-.61-1.46v-.09h1.41v.09c0,.19.05.38.19.47v.05c.09.09.28.19.47.19s.38-.09.47-.19v-.05c.14-.09.24-.28.24-.47t-.05-.09h1.41ZM30.99,28.56v.09c0,1.65-.66,3.16-1.74,4.24-1.08,1.08-2.59,1.79-4.24,1.79s-3.16-.71-4.24-1.79l-.05-.05c-1.04-1.08-1.7-2.55-1.7-4.2v-.09h1.41v.09c0,1.27.47,2.4,1.27,3.25h.05c.85.85,1.98,1.37,3.25,1.37s2.4-.52,3.25-1.37c.85-.8,1.37-1.98,1.37-3.25v-.09h1.37ZM34.99,28.56v.09c0,2.78-1.13,5.28-2.92,7.07-1.79,1.79-4.29,2.92-7.07,2.92s-5.23-1.13-7.07-2.92c-1.79-1.79-2.92-4.29-2.92-7.07v-.09h1.41v.09c0,2.4.94,4.53,2.5,6.08,1.56,1.56,3.72,2.5,6.08,2.5s4.52-.94,6.08-2.5c1.56-1.56,2.5-3.68,2.5-6.08v-.09h1.41Z'/%3e%3c/svg%3e)