
RESEARC H Open Access
Prognostic impact of ZAP-70 expression in
chronic lymphocytic leukemia: mean fluorescence
intensity T/B ratio versus percentage of positive
cells
Francesca M Rossi
1
, Maria Ilaria Del Principe
2
, Davide Rossi
3
, Maria Irno Consalvo
2
, Fabrizio Luciano
2
,
Antonella Zucchetto
1
, Pietro Bulian
1
, Riccardo Bomben
1
, Michele Dal Bo
1
, Marco Fangazio
3
, Dania Benedetti
1
,
Massimo Degan
1
, Gianluca Gaidano
3
, Giovanni Del Poeta
2†
, Valter Gattei
1*†
Abstract
Background: ZAP-70 is an independent negative prognostic marker in chronic lymphocytic leukemia (CLL). Usually,
its expression is investigated by flow cytometric protocols in which the percentage of ZAP-70 positive CLL cells is
determined in respect to isotypic control (ISO-method) or residual ZAP-70 positive T cells (T-method). These
methods, however, beside suffering of an inherent subjectivity in their application, may give discordant results in
some cases. The aim of this study was to assess the prognostic significance of these methods in comparison with
another in which ZAP-70 expression was evaluated as a Mean-Fluorescence-Intensity Ratio between gated T and
CLL cells (T/B Ratio-method).
Methods: Cytometric files relative to ZAP-70 determination according to the three readouts were retrospectively
reviewed on a cohort of 173 patients (test set), all with complete clinical and biological prognostic assessment and
time-to-treatment (TTT) available. Findings were then validated in an independent cohort of 341 cases from a
different institution (validation set).
Results: The optimal prognostic cut-offs for ZAP-70 expression were selected at 11% (ISO-method) or 20% of
positive cells (T-method), as well as at 3.0 (T/B Ratio-method) in the test set; these cut-offs yielded 66, 60 and 73
ZAP-70
+
cases, respectively. Univariate analyses resulted in a better separation of ZAP-70
+
vs. ZAP-70
-
CLL patients
utilizing the T/B Ratio, compared to T- or ISO-methods. In multivariate analyses which included the major clinical
and biological prognostic markers for CLL, the prognostic impact of ZAP-70 appeared stronger when the T/B-Ratio
method was applied. These findings were confirmed in the validation set, in which ZAP-70 expression, evaluated
by the T- (cut-off = 20%) or T/B Ratio- (cut-off = 3.0) methods, yielded 180 or 127 ZAP-70
+
cases, respectively.
ZAP-70
+
patients according to the T/B Ratio-method had shorter TTT, both if compared to ZAP-70
-
CLL, and to
cases classified ZAP-70
+
by the T-method only.
Conclusions: We suggest to evaluate ZAP-70 expression in routine settings using the T/B Ratio-method, given the
operator and laboratory independent feature of this approach. We propose the 3.0 T/B Ratio value as optimal cut-
off to discriminate ZAP-70
+
(T/B Ratio less than 3.0) from ZAP-70
-
(T/B Ratio more/equal than 3.0) cases.
* Correspondence: vgattei@cro.it
†Contributed equally
1
Clinical and Experimental Onco-Hematology Unit, Centro di Riferimento
Oncologico, I.R.C.C.S., Aviano (PN), Italy
Rossi et al.Journal of Translational Medicine 2010, 8:23
http://www.translational-medicine.com/content/8/1/23
© 2010 Rossi et al; licensee BioMed Central Ltd. This is an Open Access article distributed under the terms of the Creative Commons
Attribution License (http://creativecommons.org/licenses/by/2.0), which permits unrestricted use, distribution, and reproduction in
any medium, provided the original work is properly cited.

Background
The T cell specific zeta-associated protein 70 (ZAP-70),
first identified by gene expression profiling of chronic
lymphocytic leukemia (CLL) cells [1], has been the focus
of many studies in the last few years, due to the ability
of this molecule to act as an independent prognostic
marker in CLL, when its expression is investigated by
flow cytometry [2-5].
At least two approaches are currently employed to
define ZAP-70 positivity in CLL by flow cytometry. The
first approach is based on the signal obtained using an
isotype-matched antibody as negative control [3,4]
Accordingly, a CLL sample is defined as ZAP-70 posi-
tive when at least 20% of CLL cells have a signal exceed-
ing that of isotypic control. The second approach is
based on the expression of ZAP-70 in normal T cells,
that constitutively express the protein and hence are uti-
lized as an internal positive control. Following this strat-
egy, a CLL sample is defined as ZAP-70 positive when
at least 20% of CLL cells express ZAP-70 at levels com-
parable to those found in the residual T cell component
[2,6] Given the different readouts utilized to define
ZAP-70 positivity in CLL, it is not unexpected that a
fraction of cases may result discordant when both
approaches are applied to the same cohort of patients
[7]. In particular, ZAP-70 expression intensity by T cells
has been found to influence the evaluation of ZAP-70
positivity by CLL cells when the latter method is
employed [6,7]. However, both approaches indistinctly
suffer of an inherent variability, due to subjectivity in
cursor placement to determine the percentage of ZAP-
70 positive cells. To overcome the latter issue, subse-
quent reports suggested to evaluate ZAP-70 expression
with methods relying upon evaluation of mean fluores-
cence intensity (MFI) values, as measured in the context
of both CLL cells and residual normal B or T cells,
rather than computing the percentage of positive cells
[6,8-15]. Notably, these methods have been demon-
strated to be more reproducible in multicenter compari-
sons, and more easily adaptable to thawed material
[8,14,15].
In the present study, we used a test and validation
strategy to evaluate the clinical impact of ZAP-70
expression, as determined by computing the ratio
between MFI values separately obtained on T and CLL
cells (T/B Ratio-method). As a test set, we took advan-
tage of a consecutive series of 173 CLL cases, all with a
complete clinical and biological prognostic assessment.
Methods
Patient characteristics and prognostic assessment
This study analyzed two separate cohorts of peripheral
blood (PB) samples of untreated CLL patients overall
accounting for 514 cases. Diagnosis of CLL was con-
firmed by morphology and cytometric immunopheno-
type, according to the recently published guidelines
[16,17]. The first cohort (hereafter “test set”)included
173 patients enrolled at the Division of Hematology,
University of Eastern Piedmont, Novara. Samples were
79 females and 94 males, with a median age of 70
(range 42-91). A complete clinical and biological assess-
ment was available for all samples, including Rai stage
at diagnosis, b2-microglobulin, interphase fluorescence
in situ hybridization (FISH) analysis, immunoglobulin
heavy chain variable (IGHV) genes mutational status,
and flow cytometric analysis of CD38 and CD49d
expression. The second cohort (hereafter “validation
set”) included 341 patients enrolled at the Division of
Hematology, S. Eugenio Hospital and University of Tor
Vergata, Rome. These patients were 152 females and
189 males, with a median age of 65 (range 33-89).
Cytogeneticabnormalitiesweredetectedbystandard
interphase FISH carried out with locus-specific (on
chromosomes 11, 13 and 17) or a-satellite DNA (on
chromosome 12) Vysis probes (Abbott, London, UK)
[18]. IGHV genes mutational status was analyzed as
extensively described in previous reports by our groups
[19,20] Flow cytometric analyses of CD38 and CD49d
were done as previously described [18], using the cut-off
point of 30% of positive cells for both markers
[18,21-23]. Patients provided informed consent in accor-
dance with local Internal Review Board requirements
and Declaration of Helsinki.
Flow cytometric analysis of ZAP-70 expression
All flow cytometric detections of ZAP-70 expression in
PB samples belonging to the test set were performed at
the Clinical and Experimental Onco-Hematology Unit of
the Centro di Riferimento Oncologico (Aviano, Italy).
Samples were either processed within 48 hours since
collection (50 cases), or cryopreserved until analysis
(123 cases). Cells were labeled with anti-CD19-APC,
anti-CD5-PE-Cy7 and anti-CD3-PE-conjugated mono-
clonal antibodies (mAbs, Becton-Dickinson, San Jose,
CA) for 20 minutes, then treated with fixing and per-
meabilizing reagents (Fix&Perm kit, Caltag, Burlingame,
CA) according to the manufacturer’s instructions, and
finally stained with the Alexa-488-conjugated anti-ZAP-
70 mAb (clone 1E7.2, Caltag). A second tube was pre-
pared exactly as above, but substituting the Alexa-488-
conjugated anti-ZAP-70 mAb with an isotype-matched
Alexa-488-conjugated control mAb (Caltag). All samples
were acquired on a FACSCanto flow cytometer and ana-
lyzed with DiVa software (Becton-Dickinson). No signif-
icant differences in term of ZAP-70 Mean Fluorescence
Intensity (MFI) values were found by comparing fresh
Rossi et al.Journal of Translational Medicine 2010, 8:23
http://www.translational-medicine.com/content/8/1/23
Page 2 of 11
versus thawed samples, as judged by evaluating the T
cell component (p = 0.14; see Additional file 1).
Flow cytometric detections of ZAP-70 in PB samples
belonging to the validation set, all performed at the
laboratory of the Hematology Unit, S. Eugenio Hospital,
University of Tor Vergata (Rome, Italy), were an updat-
ing of previously reported analyses [22]. Briefly, PB
mononuclear cells, separated on a density gradient
(Ficoll-Hypaque, Pharmacia), were stained with anti-
CD19-PerCP, anti-CD5-APC, anti-CD3/anti-CD56-PE
mAbs, treated with the Fix&Perm kit (Caltag), and
finally stained with the Alexa-488-conjugated anti-ZAP-
70 mAb (clone 1E7.2, Caltag). Samples were acquired
on a FACSCalibur flow cytometer and analyzed with
CellQuest software (Becton-Dickinson).
In all cases, at least 15 000 mononucleated cells and
2 000 T cells were acquired per tube. The lymphocyte
population was gated based on morphological para-
meters on a forward- versus side-scatter (FSC/SSC) plot,
excluding potential debris and lymphocyte doublets
from the analysis. CLL and T cells were defined respec-
tively as CD19
+
/CD5
+
/CD3
-
or CD19
-
/CD5
+
/CD3
+
lym-
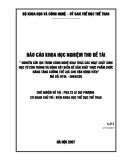
phocytes (Fig. 1A).
ZAP-70 expression was evaluated according to three
different approaches (Figure 1B): i) a 2-tubes protocol,
modified from the original protocol described by Ras-
senti et al. [4,7,24] (ISO-method); ii) a single-tube proto-
col, as originally described by Crespo et al. [2] (T-
method); iii) a single-tube method calculating the ratio
between the ZAP-70 Mean Fluorescence Intensity (MFI)
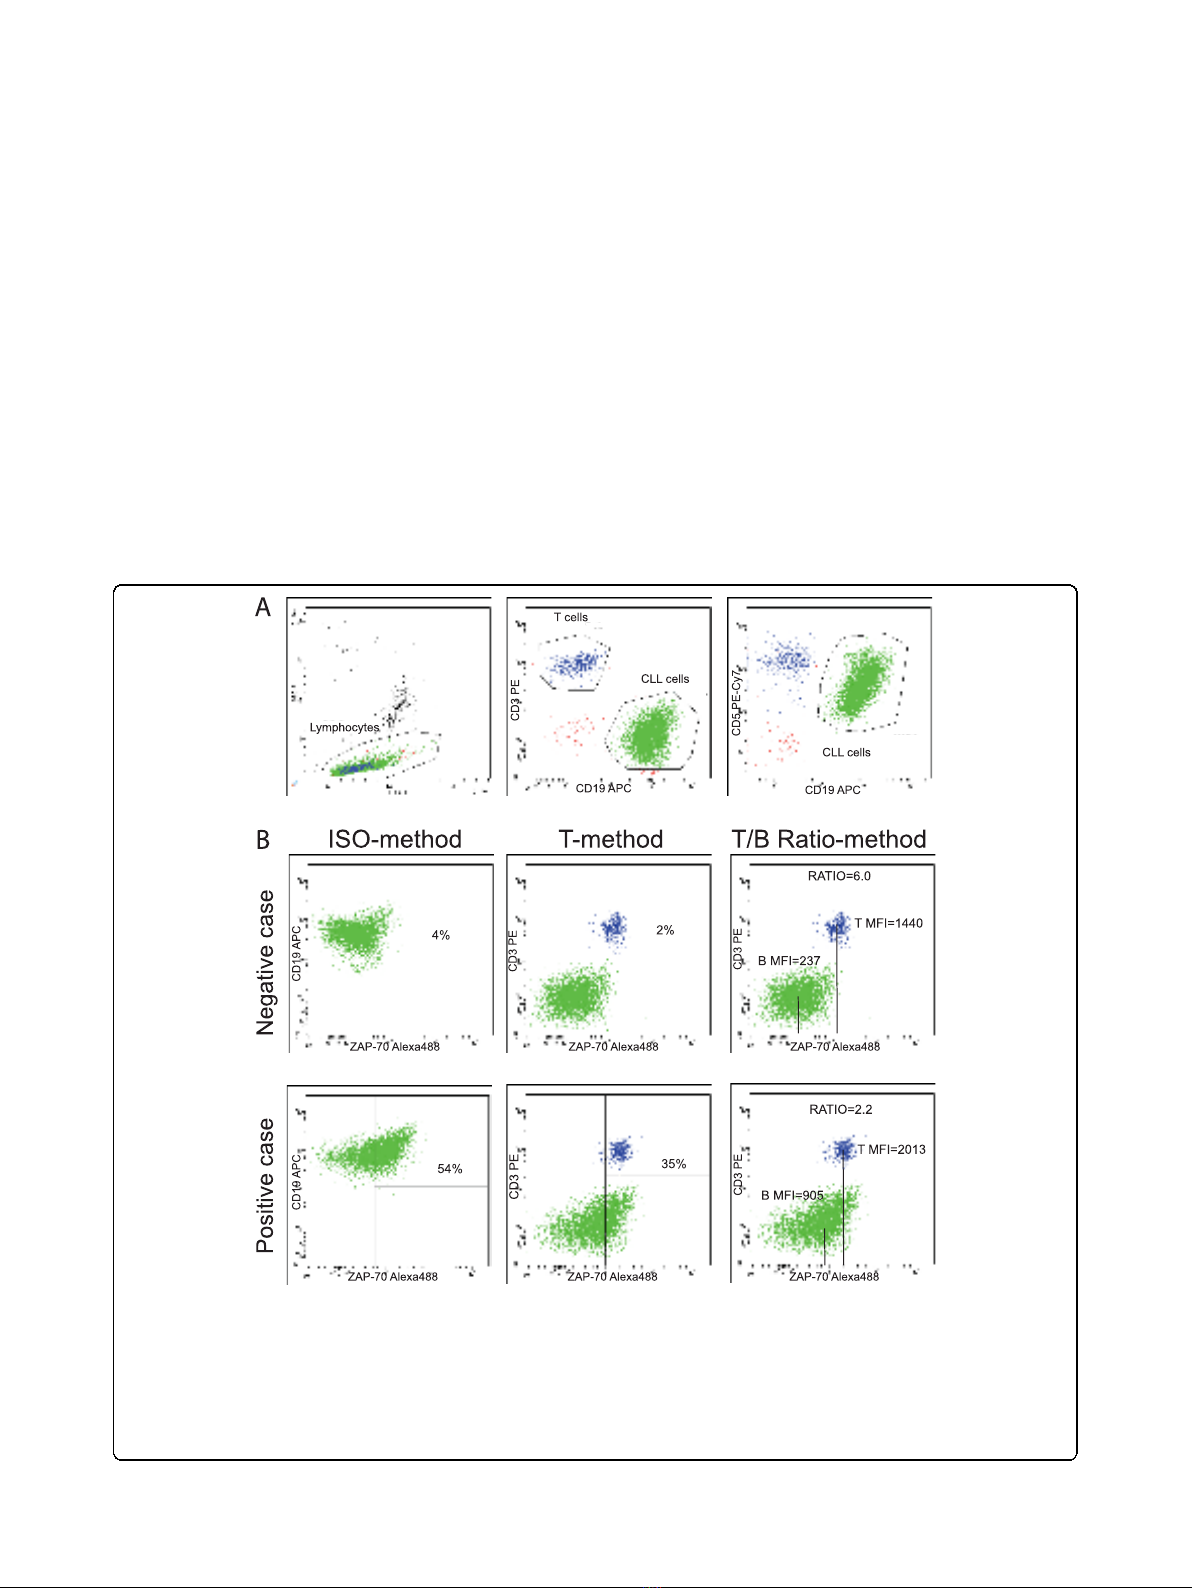
Figure 1 Flow cytometric analysis of ZAP-70 expression (test set). PB cells of CLL samples were analyzed after staining with anti-CD19-APC,
anti-CD3-PE, anti-CD5-PECy7 and AlexaFluor488-conjugated isotype control or anti-ZAP-70 antibodies. Panel A shows the gating strategies used
to select lymphocytes in the left plot, CLL cells (CD19+/CD5+/CD3-) or T cells (CD19-/CD5+/CD3+) in middle and right plots, upon gating on
lymphocytes. Panel B contains plots showing a representative ZAP-70 negative (upper row) and a representative ZAP-70 positive (lower row)
sample, both analyzed according to the three different approaches utilized to evaluated ZAP-70 expression. The ISO- T-, and T/B Ratio-method
readouts are shown respectively in the left, middle and right panels. For the ISO-method marker was set to have <1% CLL positive cells with
isotypic control. For the T-method, marker was set on the left edge of T cells cluster, to have about 98% of positive cells. For the T/B Ratio-
method the ratio was calculated directly from MFI values as separately read from T cell and CLL cell gates defined in panel A.
Rossi et al.Journal of Translational Medicine 2010, 8:23
http://www.translational-medicine.com/content/8/1/23
Page 3 of 11

values obtained from T and CLL cells (T/B Ratio-
method).
According to the ISO-method (Fig. 1B, left panels),
non-specific staining was evaluated on gated CLL cells
in a CD19/isotypic control plot, setting the marker in
order to have no more than 1% of positive cells (tube
1). This marker was then used to evaluate the percen-
tage of ZAP-70 labeled CLL cells, as detected in tube 2.
The T-method (Fig. 1B, middle panels) implied the
positioning of a marker close to the left edge of the T
cell cluster in a ZAP-70/CD3 plot, and the use of this
marker to calculate, in the same plot, the percentage of
CLL positive cells. Although a skewed distribution of
ZAP-70 in T cells was sometime observed [7], and con-
sidered in the positioning of the marker, this was usually
set to have 98% of positive T cells.
The third approach (Fig. 1B, right panels) was based on
the evaluation of ZAP-70 expression levels in terms of
MFI, as measured on a CD3/ZAP-70 plot, utilizing the
“mean”parameter, respectively on gated T lymphocytes
(T-MFI), or CLL cells (B-MFI) as defined in plot A.
These values were used to calculate the ratios between
corresponding T-MFI and B-MFI (T/B Ratio-method).
Statistical analysis
Statistical analyses were performed using the R statistical
package with Design library [25]. Time-to-treatment
(TTT) was measured from diagnosis to first line treat-
ment, or last follow-up, and was available for all CLL
cases entering the study. No deaths were recorded in the
untreated patients or prior the start of therapy. Treat-
ments were established following National Cancer Insti-
tute-Working Group guidelines [16]. The concordance
index (c index) was used to determine the predictive abil-
ity of ZAP-70 positivity in a TTT model. Briefly, the c
index is a probability of concordance between predicted
and observed survival, with c = 0.5 for random predic-
tions and c = 1 for a perfectly discriminating model [25].
An optimal cut-off for each of the three ZAP-70 readouts
was chosen at the highest value of the c index, calculated
for all the possible cut-off values of ZAP-70 [25]. TTT
were estimated using Kaplan-Meier curves and compari-
son between groups were made by log-rank test. The
Cox proportional hazard regression model was used to
assess the independent effect of covariables, treated as
dichotomous, on the TTT, with a backward procedure to
select for significant variables. Coefficients of variation
(CV) were calculated according to one way ANOVA test.
Results and discussion
ZAP-70 expression according to the ISO-, T- and T/B
Ratio-methods
We first considered the cohort of 173 CLL patients
included in the test set. Flow cytometric data files were
re-analyzed according to the three different readouts
applied to evaluate ZAP-70 expression (Fig. 1).
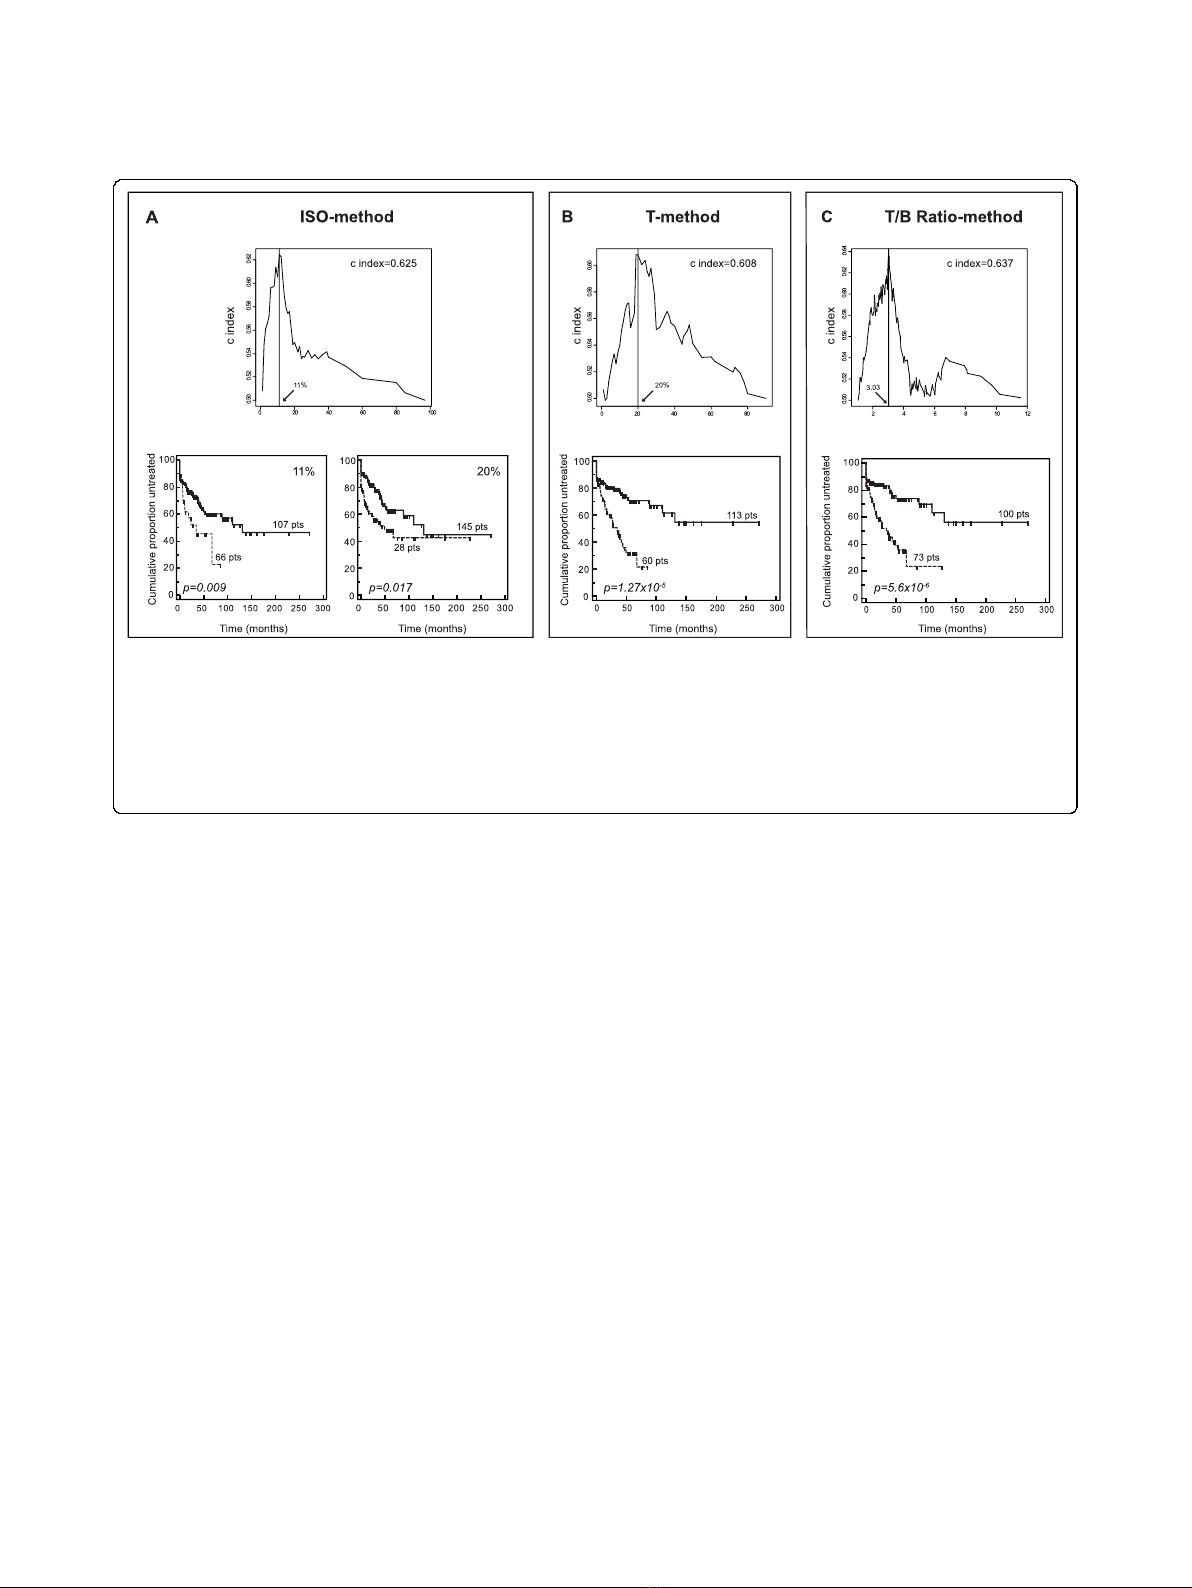
According to the ISO-method, in which ZAP-70 eva-
luation is driven by an isotypic control, 66/173 (38%)
cases were defined as ZAP-70 positive using a cut-off
value set at 11% of positive cells (Fig. 2A). This cut-off,
in keeping with some pioneering studies on ZAP-70
expression and prognosis in CLL [3], was determined by
selecting the value associated to the highest value of the
c index. It was preferred to the standard 20% of positive
cells, employed by other studies [4,24,26], which yielded
in our series 28/173 ZAP-70 positive cases (16.2%), but
a worse separation of ZAP-70+ vs. ZAP-70-cases (Fig.
2A). This result may be in part explained considering
that CLL samples from the test set were analyzed either
upon shipment by overnight courier or following thaw-
ing procedures, two conditions reported to potentially
reduce ZAP-70 expression levels by CLL cells [14,27].
Consistently, a cut-off set at 15% of positive cells was
also found to be more informative as a prognostic mar-
ker than the standard 20% in a series of frozen CLL
samples retrospectively tested for ZAP-70 expression
[27].
The T-method, in which ZAP-70 evaluation is driven
by the residual population of normal T cells, yielded 60/
173 positive cases (34.7%), by choosing the standard
cut-off value of 20% positive cells to discriminate ZAP-
70 positive vs. ZAP-70 negative CLL (Fig. 2B). At
variance with the ISO-method, this cut-off was also
associated with the best predictive ability as determined
by the c index (Fig. 2B).
In the case of the T/B Ratio-method, in which ZAP-70
expression is evaluated taking into account T-MFI and
B-MFI, the optimal cut-off value was again estimated by
calculating the c index. As shown in Fig. 2C, a 3.0 T/B
Ratio value was very near to the best cut-off selected for
prognostic purposes. In our series, 100 CLL had T/B
Ratio values greater or equal to 3.0 (i.e. ZAP-70 nega-
tive), while 73 CLL had values lower than 3.0, and were,
therefore, considered as ZAP-70 positive cases (42.2%;
Fig. 2C).
Approaches for evaluating ZAP-70 expression levels
by computing the ratio between MFI values of CLL vs.
T cells or T vs. CLL cells have been already proposed,
although either applied to relatively small patient series,
or without evaluating its prognostic relevance compared
to the other methods currently employed in routine
prognostic assessment of CLL patients [9-11,14,15,28].
Data presented here, suggesting a T/B Ratio value of 3.0
as the optimal cut-off point to discriminate ZAP-70
positive (i.e. with T/B Ratio values lower than 3.0) vs.
ZAP-70 negative (i.e. with T/B Ratio values greater than
or equal to 3.0) CLL, was obtained by utilizing the
Alexa-488-conjugated 1E7.2 anti-ZAP-70 mAb.
Rossi et al.Journal of Translational Medicine 2010, 8:23
http://www.translational-medicine.com/content/8/1/23
Page 4 of 11
Although this mAb is one of the most frequently
employed anti-ZAP-70 mAbs [4,5,24], several other
mAbs have been reported, with different reactivity,
fluorochrome conjugation, hence with different com-
parative performances [10,29]. Therefore, it would be
not surprising that the 3.0 cut-off indicated by us could
be influenced by the use of a particular anti-ZAP-70
mAb. As an example, a 4.5 was recently employed in a
CLL series in which ZAP-70 expression was investigated
by using the PE-conjugated SBZAP mAb [28]. More-
over, in a study by Le Garff-Tavernier et al. [14] a posi-
tivity threshold set at 4.0 was chosen by considering the
mean value determined in a series of normal blood sam-
ples in which the ratio between expression of ZAP-70 in
T vs. B cells was computed. Additional studied are
therefore needed to validate the 3.0 cut-off, utilizing
other anti-ZAP-70 clones and/or fluorochrome
combinations.
In an attempt to evaluate the robustness of the T/B
Ratio-method, as compared to the other approaches,
ZAP-70 expression was independently evaluated by two
operators (F.M.R. and A.Z.) in a series of 42 CLL. As
reported in Additional file 2, although analyses were
made by expert cytometrists, mean CV values computed
for the three methods revealed a significantly higher
variability when ZAP-70 expression was evaluated by
the ISO-method (CV = 19.4) or the T-method (CV =
29.2) compared to the T/B Ratio-method (CV = 3.6).
Accordingly, a technical report aimed at harmonizing
different procedures for ZAP-70 evaluation among sev-
eral laboratories, proposed an approach similar to our
T/B Ratio-method as the method yielding the most
accurate and reproducible results in both ZAP-70 posi-
tive and ZAP-70 negative cases [15].
ZAP-70 expression according to the ISO-, T- and T/B
Ratio-methods: prognostic significance
As summarized in Fig. 2, regardless of the readout cho-
sen to evaluate ZAP-70 expression, high ZAP-70 levels
always correlated with shorter TTT in CLL. This is in
keeping with previous studies in which both ISO- and T-
methods were proven to have prognostic relevance, also
in wide cohorts of patients [5,24]. Nevertheless, a parallel
comparison of the prognostic impact of different meth-
ods for ZAP-70 evaluation in a relatively wide CLL series
is still lacking. In this regard, the Kaplan-Meier curves
reported in Fig. 2 clearly showed that an evaluation of
ZAP-70 expression utilizing the T/B Ratio-method
yielded the best separation between ZAP-70 positive and
ZAP-70 negative cases (p value = 5.6 × 10
-6
), followed by
T- (p value = 1.3 × 10
-5
) and ISO- (p value = 0.009)
methods.
Figure 2 C index and Kaplan-Meier curves for ZAP-70 evaluation according to ISO-, T- and T/B Ratio-methods (test set). Upper panels
in A, B, and C show c index curves applied to ZAP-70 expression values to estimate the optimal cut-off capable to split patients into groups
with different time to treatment (TTT) probabilities. X-axes report expression values for ZAP-70, expressed as percent of positive cells (A and B),
or T/B ratio values (C); y-axes report the corresponding c index values. For each method, solid line indicates the chosen cut-off value. Lower
panels show Kaplan-Meier curves obtained comparing TTT of patients affected by CLL expressing or not ZAP-70, as evaluated according to ISO-
(A), T- (B) or T/B Ratio- (C) methods. In all plots, solid lines indicate ZAP-70 negative CLL, while dashed line indicate ZAP-70 positive CLL,
according to the three readouts. In (A) Kaplan-Meier curves obtained by dividing CLL patients according to two different cut-offs (11% and 20%)
for ZAP-70 evaluation are reported.
Rossi et al.Journal of Translational Medicine 2010, 8:23
http://www.translational-medicine.com/content/8/1/23
Page 5 of 11


%20--%3e%3cdefs%3e%3cstyle%3e%20.st0%20{%20fill:%20%23fff;%20}%20.st1%20{%20fill:%20%237800fa;%20}%20%3c/style%3e%3c/defs%3e%3cpath%20class='st1'%20d='M117.78,12.18H43.11c2.9,3.47,4.65,7.94,4.65,12.82,0,5.6-2.3,10.66-6.01,14.29h76.02l7.22-13.56-7.22-13.56Z'/%3e%3cg%3e%3cpath%20class='st0'%20d='M53.58,26.17h-.59v-1.46h.59v-4.96h2.83c1.78,0,2.67.94,2.67,2.82v5.76c0,1.87-.89,2.81-2.67,2.81h-2.83v-4.96ZM55.36,21.37v3.34h1.1v1.46h-1.1v3.34h1.01c.61,0,.91-.37.91-1.1v-5.93c0-.74-.3-1.1-.91-1.1h-1.01Z'/%3e%3cpath%20class='st0'%20d='M65.99,31.14h-1.8l-.31-2.07h-2.19l-.31,2.07h-1.64l1.82-11.39h2.62l1.82,11.39ZM65.28,18.04c-.25.46-.51.77-.75.94-.21.15-.47.22-.79.22-.26,0-.57-.07-.92-.22l-.38-.15c-.14-.05-.26-.07-.37-.07-.3,0-.53.18-.71.54l-.91-.68c.25-.46.51-.77.75-.94.21-.14.48-.21.79-.21.26,0,.57.07.92.21l.38.15c.14.05.26.07.37.07.3,0,.53-.18.71-.54l.91.68ZM61.91,27.52h1.73l-.87-5.76-.87,5.76Z'/%3e%3cpath%20class='st0'%20d='M74.53,26.89v1.52c0,1.91-.89,2.86-2.67,2.86s-2.67-.95-2.67-2.86v-5.93c0-1.91.89-2.86,2.67-2.86s2.67.95,2.67,2.86v1.11h-1.69v-1.22c0-.75-.31-1.12-.93-1.12s-.93.37-.93,1.12v6.15c0,.74.31,1.11.93,1.11s.93-.37.93-1.11v-1.63h1.69Z'/%3e%3cpath%20class='st0'%20d='M81.4,31.14h-1.8l-.31-2.07h-2.19l-.31,2.07h-1.64l1.82-11.39h2.62l1.82,11.39ZM75.9,19.2l1.52-1.91h1.71l1.51,1.91h-1.61l-.76-.95-.75.95h-1.61ZM77.32,27.52h1.73l-.87-5.76-.87,5.76ZM83.1,15.99l-1.76,1.91h-1.26l1.17-1.91h1.86Z'/%3e%3cpath%20class='st0'%20d='M84.86,19.75c1.78,0,2.67.94,2.67,2.82v1.48c0,1.87-.89,2.81-2.67,2.81h-.85v4.28h-1.79v-11.39h2.64ZM84.01,21.37v3.86h.85c.58,0,.87-.36.87-1.08v-1.71c0-.71-.29-1.07-.87-1.07h-.85Z'/%3e%3cpath%20class='st0'%20d='M93.51,19.75c1.78,0,2.67.94,2.67,2.82v1.48c0,1.87-.89,2.81-2.67,2.81h-.85v4.28h-1.79v-11.39h2.64ZM92.66,21.37v3.86h.85c.58,0,.87-.36.87-1.08v-1.71c0-.71-.29-1.07-.87-1.07h-.85Z'/%3e%3cpath%20class='st0'%20d='M98.8,31.14h-1.79v-11.39h1.79v4.88h2.03v-4.88h1.83v11.39h-1.83v-4.88h-2.03v4.88Z'/%3e%3cpath%20class='st0'%20d='M105.36,24.55h2.46v1.62h-2.46v3.34h3.09v1.63h-4.88v-11.39h4.88v1.63h-3.09v3.18ZM108.17,17.29l-1.76,1.91h-1.26l1.17-1.91h1.86Z'/%3e%3cpath%20class='st0'%20d='M112.2,19.75c1.78,0,2.67.94,2.67,2.82v1.48c0,1.87-.89,2.81-2.67,2.81h-.85v4.28h-1.79v-11.39h2.64ZM111.35,21.37v3.86h.85c.58,0,.87-.36.87-1.08v-1.71c0-.71-.29-1.07-.87-1.07h-.85Z'/%3e%3c/g%3e%3ccircle%20class='st1'%20cx='25'%20cy='25'%20r='20'/%3e%3cpath%20class='st0'%20d='M32.78,19.27c2.92,0,4.43,2.55,5.28,5.33l.71,2.17c.14.38-.33.75-.71.75h-5.61c.19-.33.24-.71.09-1.08l-.75-2.45c-.43-1.32-.99-2.64-1.79-3.77.75-.57,1.65-.94,2.78-.94h0ZM25,18.38c3.25,0,4.9,2.78,5.89,5.89l.76,2.45c.14.42-.33.8-.8.8h-11.69c-.42,0-.94-.38-.8-.8l.75-2.45c.99-3.11,2.64-5.89,5.89-5.89h0ZM25,11.35c1.74,0,3.11,1.37,3.11,3.11s-1.37,3.11-3.11,3.11-3.11-1.41-3.11-3.11,1.41-3.11,3.11-3.11h0ZM17.27,19.27c1.08,0,1.98.38,2.73.94-.8,1.13-1.37,2.45-1.74,3.77l-.8,2.45c-.14.38-.05.75.09,1.08h-5.56c-.42,0-.9-.38-.75-.75l.71-2.17c.9-2.78,2.41-5.33,5.33-5.33h0ZM17.27,12.91c1.51,0,2.78,1.27,2.78,2.83s-1.27,2.83-2.78,2.83-2.83-1.27-2.83-2.83,1.27-2.83,2.83-2.83h0ZM32.78,12.91c1.56,0,2.78,1.27,2.78,2.83s-1.23,2.83-2.78,2.83-2.83-1.27-2.83-2.83,1.27-2.83,2.83-2.83h0ZM27.07,28.56v.09c0,.57-.24,1.08-.61,1.46h0v.05c-.38.33-.9.57-1.46.57s-1.08-.24-1.46-.61h0c-.38-.38-.61-.9-.61-1.46v-.09h1.41v.09c0,.19.05.38.19.47v.05c.09.09.28.19.47.19s.38-.09.47-.19v-.05c.14-.09.24-.28.24-.47t-.05-.09h1.41ZM30.99,28.56v.09c0,1.65-.66,3.16-1.74,4.24-1.08,1.08-2.59,1.79-4.24,1.79s-3.16-.71-4.24-1.79l-.05-.05c-1.04-1.08-1.7-2.55-1.7-4.2v-.09h1.41v.09c0,1.27.47,2.4,1.27,3.25h.05c.85.85,1.98,1.37,3.25,1.37s2.4-.52,3.25-1.37c.85-.8,1.37-1.98,1.37-3.25v-.09h1.37ZM34.99,28.56v.09c0,2.78-1.13,5.28-2.92,7.07-1.79,1.79-4.29,2.92-7.07,2.92s-5.23-1.13-7.07-2.92c-1.79-1.79-2.92-4.29-2.92-7.07v-.09h1.41v.09c0,2.4.94,4.53,2.5,6.08,1.56,1.56,3.72,2.5,6.08,2.5s4.52-.94,6.08-2.5c1.56-1.56,2.5-3.68,2.5-6.08v-.09h1.41Z'/%3e%3c/svg%3e)