
Open Access
Available online http://ccforum.com/content/11/5/R115
Page 1 of 10
(page number not for citation purposes)
Vol 11 No 5
Research
Intentional overdose with insulin: prognostic factors and
toxicokinetic/toxicodynamic profiles
Bruno Mégarbane1, Nicolas Deye2, Vanessa Bloch1, Romain Sonneville1, Corinne Collet2, Jean-
Marie Launay2 and Frédéric J Baud1
1Assistance Publique – Hôpitaux de Paris, Hôpital Lariboisière, Réanimation Médicale et Toxicologique, INSERM U705, CNRS, UMR 7157,
Université Paris 7, Université Paris 5, 2 Rue Ambroise Paré, 75010, Paris, France
2Assistance Publique – Hôpitaux de Paris, Hôpital Lariboisière, Laboratoire de Biochimie et de Biologie Moléculaire, 2 Rue Ambroise Paré, 75010,
Paris, France
Corresponding author: Bruno Mégarbane, bruno.megarbane@lrb.aphp.fr
Received: 31 Aug 2007 Revisions requested: 28 Sep 2007 Accepted: 28 Oct 2007 Published: 28 Oct 2007
Critical Care 2007, 11:R115 (doi:10.1186/cc6168)
This article is online at: http://ccforum.com/content/11/5/R115
© 2007 Mégarbane et al.; licensee BioMed Central Ltd.
This is an open access article distributed under the terms of the Creative Commons Attribution License (http://creativecommons.org/licenses/by/2.0),
which permits unrestricted use, distribution, and reproduction in any medium, provided the original work is properly cited.
Abstract
Introduction Prognostic factors in intentional insulin self-
poisoning and the significance of plasma insulin levels are
unclear. We therefore conducted this study to investigate
prognostic factors in insulin poisoning, in relation to the value of
plasma insulin concentration.
Methods We conducted a prospective study, and used logistic
regression to explore prognostic factors and modelling to
investigate toxicokinetic/toxicodynamic relationships.
Results Twenty-five patients (14 female and 11 male; median
[25th to 75th percentiles] age 46 [36 to 58] years) were
included. On presentation, the Glasgow Coma Scale score was
9 (4 to 14) and the capillary glucose concentration was 1.4 (1.1
to 2.3) mmol/l. The plasma insulin concentration was 197 (161
to 1,566) mIU/l and the cumulative amount of glucose infused
was 301 (184 to 1,056) g. Four patients developed sequelae
resulting in two deaths. Delay to therapy in excess of 6 hours
(odds ratio 60.0, 95% confidence interval 2.9 to 1,236.7) and
ventilation for longer than 48 hours (odds ratio 28.5, 95%
confidence interval 1.9 to 420.6) were identified as independent
prognostic factors. Toxicokinetic/toxicodynamic relationships
between glucose infusion rates and insulin concentrations fit the
maximum measured glucose infusion rate (Emax) model (Emax
29.5 [17.5 to 41.1] g/hour, concentration associated with the
half-maximum glucose infusion rate [EC50] 46 [35 to 161] mIU/
l, and R2 range 0.70 to 0.98; n = 6).
Conclusion Intentional insulin overdose is rare. Assessment of
prognosis relies on clinical findings. The observed plasma
insulin EC50 is 46 mIU/l.
Introduction
Contrasting with the common occurrence of insulin-induced
hypoglycaemia in type 1 diabetes patients, deliberate over-
dose with insulin are rarely reported [1]. In the 2005 Annual
Report of the American Association of Poison Control Cent-
ers, only 3,934 out of the 2,424,180 reported exposures to
substances involved insulin [2]. Consistent with this, a recent
study in a poison centre [3] estimated the annual rate of
enquiries secondary to insulin overdose at 20. In a series of
diabetic poisoned patients, fewer than 5% of suicide attempts
involved insulin [4]. Similarly, in a series of nondiabetic poi-
soned patients presenting with toxic hypoglycaemia, fewer
than 1% had self-injected insulin [5].
Deliberate self-poisoning with insulin may result in severe
symptoms, including hypoglycaemic coma, neurological
impairment and death [1,6]. The major difference between
insulin therapeutic mistake and deliberate overdose is the
much greater dose of insulin used in the latter, leading to ele-
vated and prolonged need for glucose. Prognostic factors in
insulin overdose remain subject to debate, and the optimal
modalities of glucose therapy are not known. It is still unknown
CI = confidence interval; CPC = Cerebral Performance Category; Emax = maximum measured glucose infusion rate; EC50 = insulin concentration
associated with the half-maximum glucose infusion rate; ICU = intensive care unit; OR = odds ratio; SAPS = Simplified Acute Physiology Score; TK/
TD = toxicokinetic/toxicodynamic.

Critical Care Vol 11 No 5 Mégarbane et al.
Page 2 of 10
(page number not for citation purposes)
whether the necessary rate of glucose infusion may be pre-
dicted by determining the plasma insulin level. We therefore
conducted the presented study with the following goals: to
describe patients admitted to the intensive care unit (ICU) for
severe insulin poisoning; to investigate prognostic factors in
insulin overdose; and to determine the association between
rate of glucose infusion and plasma insulin concentration, by
examining toxicokinetic/toxicodynamic (TK/TD) relationships.
Materials and methods
Descriptive study setting
We prospectively reviewed the charts of all consecutive
patients admitted to our ICU from January 1999 to December
2005 because of intentional insulin overdose. The circum-
stances of poisoning, clinical presentation, and results of cap-
illary glucose concentrations, routine blood tests and
toxicological screening were recorded. Data regarding clinical
features and glucose levels were obtained at the scene and on
ICU admission.
All the patients were managed in accordance with the stand-
ard treatment guidelines that are currently used in our depart-
ment. Glucose infusion rate was continuously adapted based
on hourly determination of capillary glucose to maintain a
blood glucose level in the range of 10 to 12 mmol/l. System-
atic attempts were made to reduce the infusion rate, but the
rate was returned to the previous level if evidence of hypogly-
caemia was detected. We calculated the cumulative amount
of glucose given orally and intravenously to each patient until
the time point at which the effects of injected insulin were
deemed to have ceased. This time was determined, as previ-
ously proposed [7], from therapy initiation to the time point at
which no further hypoglycaemic episodes occurred along with
one of the following events: discontinuation of the intravenous
line; decrease in intravenous glucose infusion to under 2.5 g/
hour or change to a nonglucose solution; insulin restart if the
patient was type 1 diabetic; or measurements of a glucose
concentration above 6.5 mmol/l on two occasions or more
than 8.25 mmol/l once. Physiological variables measured on
admission were used to calculate the Simplified Acute Physi-
ology Score (SAPS) II [8]. At ICU discharge, the Glasgow-
Pittsburgh Cerebral Performance Category (CPC) was deter-
mined [9]. For data analysis, the patient population was split
into two groups according to the following outcomes: 'favour-
able' (defined as CPC 1 or 2) and 'unfavourable' (defined as
CPC 3 to 5). Unfavourable outcomes include death and
severe neurological impairment on ICU discharge.
Analysis of TK/TD relationships
We conducted a TK/TD analysis between the glucose infusion
rate in order to normalize the capillary glucose concentration
(as a toxicodynamic parameter) and the corresponding serum
insulin concentrations (as a toxicokinetic parameter). This
study was approved by our institutional ethics committee, and
verbal informed consent was obtained from the patient when
conscious or from the next of kin when not.
Plasma insulin and C-peptide concentrations were determined
using the same samples as those used for glucose measure-
ments. Plasma insulin concentration was measured using a
commercial Microparticle Enzyme Immunoassay (MEIA tech-
nology, Axsym system; Abbott Japan Co., Ltd, Osaka, Japan;
limit of quantification 1.0 mU/l). Plasma C-peptide concentra-
tion was determined with a solid-phase competitive chemilu-
minescent enzyme immunoassay (Immulite; Diagnostic
Products Corporation, Los Angeles, CA, USA; limit of quanti-
fication 0.5 ng/ml). Venous blood samples were obtained at
the discretion of the attending physicians. The rate of glucose
infusion was prospectively recorded at each blood sampling,
and nurses in charge were blinded to the results of plasma
insulin measurement. For each value of plasma insulin concen-
tration measured at time tn (with t0 being the time of initial ther-
apy and t1 being time of the first plasma insulin measurement),
we attributed a value of glucose infusion rate obtained by
dividing the quantity of glucose administered from (tn-1 + tn)/2
to (tn+1 + tn)/2 by the delay (tn+1 - tn-1)/2. For the first value at
time t1, the glucose infusion rate was obtained by dividing the
quantity of glucose administered from t0 to (t1 + t2)/2 by the
corresponding time. Regarding the toxicokinetic study, we
considered all plasma insulin values in type 1 diabetic patients,
provided that no insulin was re-administrated. In nondiabetic
and type 2 diabetic patients, we only considered plasma insu-
lin concentrations above 20 mU/l (the upper limit of normal in
the fasting state), provided that their corresponding plasma C-
peptide concentration was under 0.5 ng/ml. The half-time of
the disappearance rate of exogenous insulin was calculated
using the method proposed by Pearson and coworkers [10].
Studies of toxicokinetic (noncompartmental analysis) and TK/
TD relationships were performed using a computerized curve
fitting program (Win-Nonlin Pro 4.1; Pharsight, Mountain
View, CA, USA).
Statistical analysis
Results are expressed as median (25th to 75th percentiles) or
percentage when appropriate. Fisher's exact tests and non-
parametric tests were used for between-group comparisons.
Correlations were quantified using Pearson's linear correlation
coefficient. A stepwise logistic regression was used to explore
the effects of several variables on the outcome (considering
death or significant neurological sequelae at ICU discharge to
represent an unfavourable outcome) and the duration of ICU
stay (considering an ICU stay >10 days to represent an unfa-
vourable outcome). The predicted proportion of unfavorable
outcomes was assumed to follow the logistic model. The step
selection was based on the maximum likelihood ratio. Odds
ratio (OR) were calculated along with 95% confidence interval
(CI). P < 0.05 was considered statistically significant.

Available online http://ccforum.com/content/11/5/R115
Page 3 of 10
(page number not for citation purposes)
Results
Descriptive analysis and study of prognostic factors
Over a 6-year period, 25 patients (14 females and 11 male,
age 46 [36 to 58] years and SAPS II score 25 [19 to 51])
were admitted in our ICU because of intentional insulin poison-
ing. A past psychiatric history was noted in 20 of the 25
patients (80%) and diabetes mellitus in 13 of the 25 patients
(52%). The five nondiabetic patients (20%) were nurses.
Rapid-acting insulin (injected amount 300 [138 to 525] IU)
was involved in 14 out of 25 patients, while intermediate-act-
ing or slow-acting insulin (300 [170 to 1,300] IU) was used by
13 out of 25 patients. Two patients self-injected both insulin
types. Drug ingestion, mainly benzodiazepines, was also iden-
tified in 68% of patients. The interval between insulin self-
injection and pre-hospital glucose administration was 2.7 (1 to
5) hours. At presentation, Glasgow Coma Scale score was 9
(4 to 14), systolic blood pressure was 120 (110 to 158)
mmHg, pulse rate was 95 (80 to 111) beats/minute and res-
piratory rate was 20 (18 to 28) breaths/minute. The tempera-
ture was 36.0°C (35.0°C to 37.0°C). At the scene, the
capillary glucose concentration was 1.4 (1.1 to 2.3) mmol/l.
Six patients were mechanically ventilated for persistent coma
despite correction of hypoglycaemia. On ICU admission, the
blood glucose was 5.3 (2.8 to 7.3) mmol/l, plasma potassium
was 3.3 (3.0 to 3.8) mmol/l, plasma lactate 2.0 (1.7 to 2.8)
mmol/l, and the maximal observed plasma insulin concentra-
tion was 197 (161 to 1,566) IU/ml.
All patients received an infusion of 30% dextrose in water
titrated to blood glucose levels. Six patients received addi-
tional 50% dextrose in water and five glucagon injections. The
total amount of infused glucose was 301 (184 to 1,056) g.
The total duration of glucose infusion was 32 (12 to 68) hours.
In the ICU, seven patients (28%) were mechanically ventilated
(duration 15 [3 to 51] days) and five (20%) received catecho-
lamine infusions for circulatory failure. Four patients (16%)
developed an aspiration pneumonia. Two patients developed
an acute respiratory distress syndrome confirmed by pulmo-
nary wedge pressure measurements.
Final outcome was favourable in 21 out of 25 patients (Table
1). Two patients died in the ICU, following withholding and
withdrawal of life-sustaining treatments because of severe
hypoglycaemic encephalopathy, associated in one case with a
terminal phase cancer. Two other patients suffered from signif-
icant neurological sequelae at ICU discharge (CPC 3), includ-
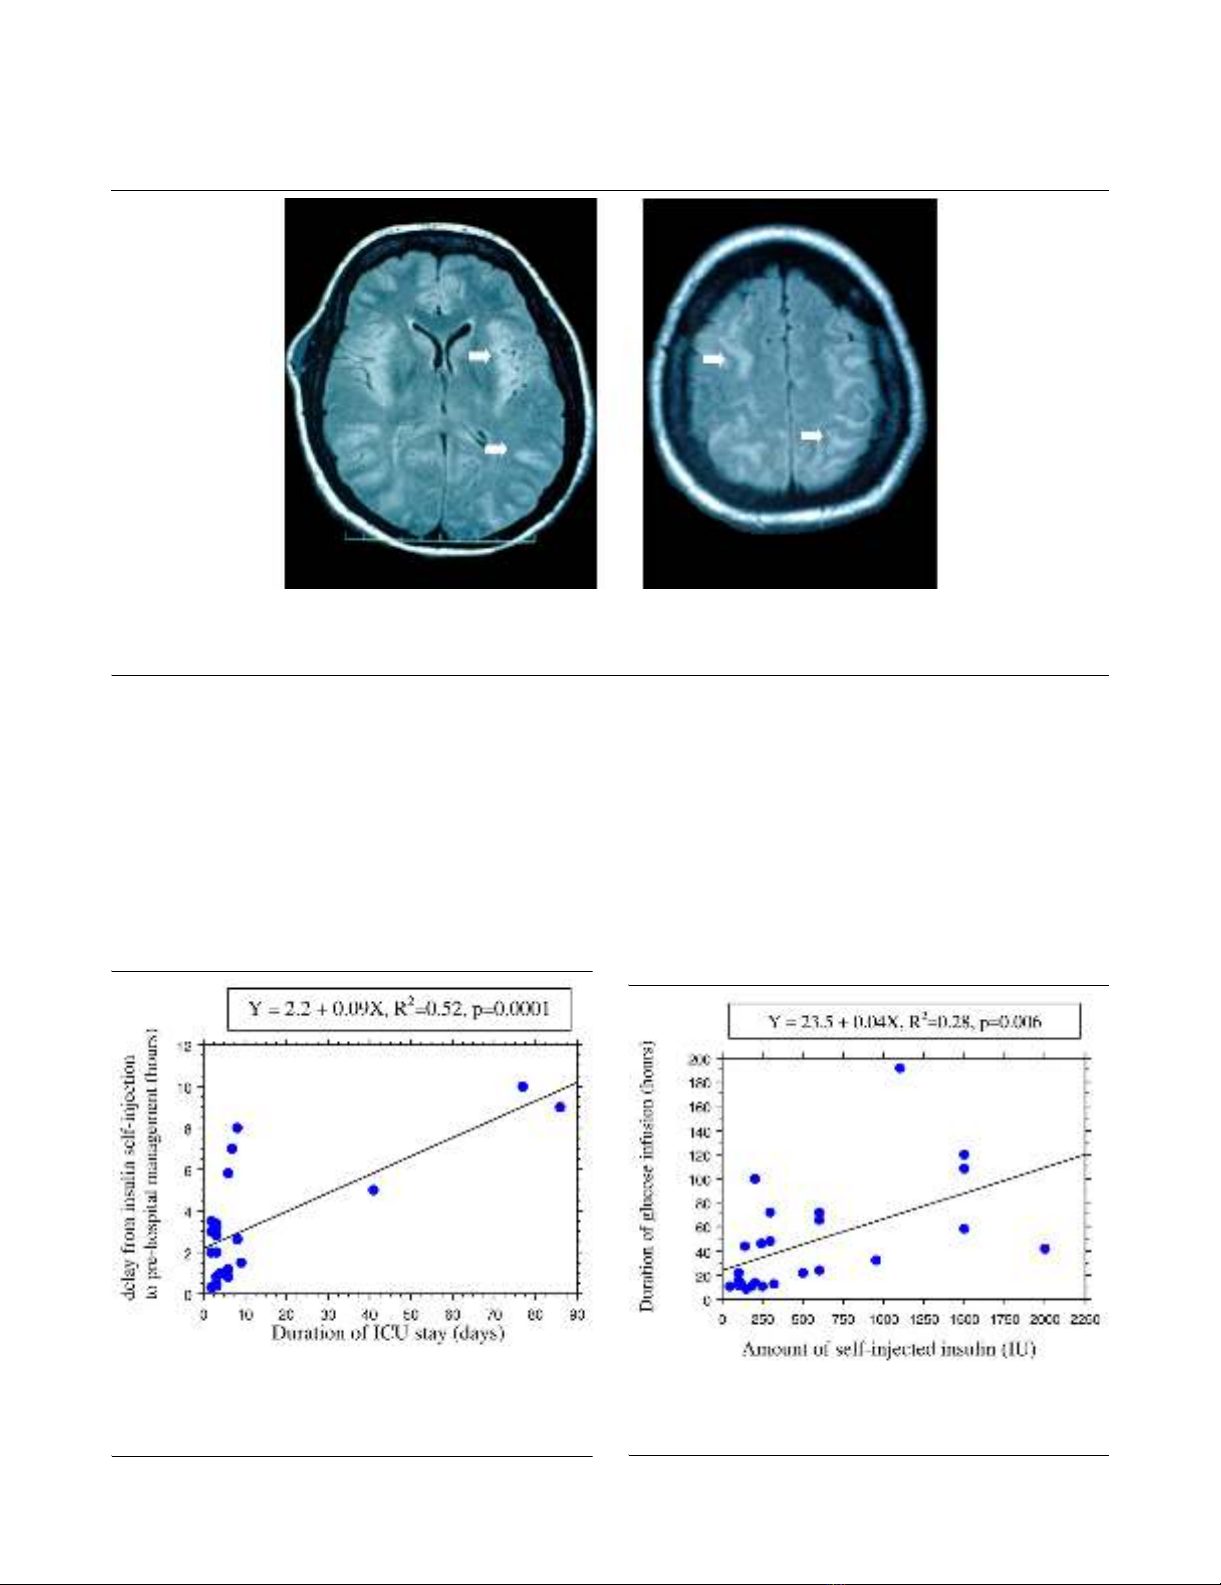
ing cognitive and memory impairments. In the patient who died
on day 85 with a severe hypoglycaemia-related encephalopa-
thy, fast fluid-attenuated inversion recovery magnetic reso-
nance imaging showed disseminated hypersignals in the
cerebral gray matter at day 3 (Figure 1). Interestingly, all these
signal abnormalities disappeared on day 30, whereas marked
cerebral atrophy was observed and neurological disabilities
persisted. A stepwise multiple regression logistic regression
model showed that a delay between insulin injection and first
medical treatment in excess of 6 hours (OR 60.0, 95% CI 2.9
to 1,236.7) and a duration of mechanical ventilation in excess
of 48 hours (OR 28.5, 95% CI 1.9 to 420.6) appeared to be
significant independent predictors of unfavourable outcome of
insulin poisoning.
There was no significant correlation between plasma insulin
level and the amount of injected insulin (R2 = 0.07, P = 0.9; n
= 15). There was a significant correlation between the dura-
tion of ICU stay and the delay to initial therapy (R2 = 0.52, P =
0.0001; n = 22; Figure 2). There was no significant correlation
between the amount of administered glucose and the amount
of injected insulin (R2 = 0.12, P = 0.1; n = 25). A weak corre-
lation was found between the duration of glucose infusion and
the self-injected insulin amount (R2 = 0.28, P = 0.006; n = 25;
Figure 3).
The duration of ICU stay was 3 (3 to 7) days. Comparisons
using univariate analysis showed that the following factors dif-
fered significantly according to length of ICU stay (≤ days ver-
sus > 10 days): age (P = 0.001), SAPS II score (P < 0.001),
amount of injected insulin (P < 0.001), interval between insulin
injection and first medical treatment (P < 0.001), initial capil-
lary glucose concentration (P = 0.003), initial Glasgow Coma
Scale score (P = 0.03), mechanical ventilation requirement (P
= 0.03), maximum observed plasma insulin level (P < 0.001),
cumulative amount of administered dextrose (P < 0.001) and
onset of sequelae (P = 0.04). A stepwise multiple regression
logistic regression model showed that SAPS II score above
40 (OR 123.8, 95% CI 1.0 to 157.2) and occurrence of
severe hypoglycaemic encephalopathy (CPC 3 to 5; OR 20.0,
95% CI 1.2 to 331.0) were significant independent predictors
of ICU stay longer than 10 days.
Study of insulin kinetics and toxicokinetic/
toxicodynamic relationships
Kinetics of insulin and TK/TD relationships were conducted in
six patients, including three nondiabetic patients, two type 1
diabetic patients and one type 2 diabetic patient (Table 2). The
decrease in exogenous insulin concentrations using a semi-
logarithmic scale was linear, exhibiting first-order kinetics (Fig-
ure 4). The terminal half-life was 3.8 (1.5 to 4.6) hours. During
the course of poisoning, TK/TD relationships between the glu-
cose infusion rate (E) and insulin concentrations (C) fit the
Emax model E = (Emax × C)/(EC50 + C), where Emax is the maxi-
mum measured glucose infusion rate and EC50 is the concen-
tration associated with the half-maximum glucose infusion rate
(Figure 5). In these six patients the maximal observed plasma
insulin concentration Cmax was 1,279 (197 to 5,740) mIU/l, the
Emax was 29.5 (17.5 to 41.1) g/hour and the EC50 was 46 (35
to 161) mIU/l (Table 2).
Discussion
Despite the widespread use of insulin, overdoses are infre-
quently reported. In comparison, sulfonylureas are the most

Critical Care Vol 11 No 5 Mégarbane et al.
Page 4 of 10
(page number not for citation purposes)
frequently identified antidiabetic agent in human poisonings
[11]. Insulin causes the greatest number of major and serious
problems, whereas biguanides lead to most deaths. In our
study, which included 25 patients admitted to our ICU
because of severe insulin self-poisoning, four patients devel-
oped significant sequelae that resulted in two deaths. Consist-
ent with this, in a large study assessing outcomes following
160 enquiries regarding insulin overdose recorded in a
regional poison unit [3], full recovery occurred in 94.7% of
patients while 2.7% patients had cerebral defects and 2.7%
died. Hypoglycaemic encephalopathy is the most feared con-
sequence of self-poisoning with insulin. The cortex, caudate,
putamen and hippocampus are considered to be most vulner-
able to hypoglycaemia. Selective regional brain vulnerability is
related to differences in glucose content, glucose influx, amino
acid distribution and inhibition of cerebral protein synthesis.
Diffusion-weighted magnetic resonance imaging is therefore
an excellent tool for evaluating patients who have self-poi-
soned with insulin, because it has the ability to detect cytotoxic
damage early and can demonstrate (as in one of our patients)
heterogeneous high intensity areas in both cortex and subcor-
tex [12].
Prognosis of severe acute insulin poisoning
Prognostic factors in insulin poisoning are subject to debate.
It is generally accepted that the severity of intoxication should
be assessed based on clinical findings rather than on any
speculated amount of self-injected insulin [1,13]. The interval
between insulin self-injection and initiation of therapy (>10
hours) and the duration of the hypoglycaemic coma were pro-
posed to be relevant prognostic factors [13,14]. Our findings
were consistent with the reported literature in that we identi-
fied two independent outcome predictors: delayed initiation of
dextrose infusion (>6 hours) and duration of mechanical venti-
lation (>48 hour; a surrogate marker of the severity of the
hypoglycaemic encephalopathy). Interestingly, as in our study,
the dose and type of insulin were found to be closely related
to the duration but not to the severity of hypoglycaemia
Table 1
Comparison of patient clinical parameters according to the outcome
Parameter Favourable outcome (n = 21) Unfavourable outcome (n = 4) P
Age (years) 46 (36 to 58) 45 (26 to 67) 0.9
SAPS II 23 (18 to 36) 62 (61 to 69) 0.002
Total amount of injected insulin (IU) 250 (135 to 988) 450 (250 to 600) 0.6
Delay before pre-hospital management (hours; n = 22) 2 (0.9 to 3.4) 9 (7.5 to 9.8) 0.009
On the scene
Glasgow Coma Scale score 12 (8 to 14) 4 (4 to 6) 0.06
Capillary glucose level (mmol/l) 1.4 (1.1 to 2.3) 0.7 (1.5 to 4.1) 0.9
Mechanical ventilation (%) 14 75 0.03
On ICU admission
GCS score before dextrose administration 15 (14 to 15) 6 (4 to 10) 0.003
Systolic blood pressure (mmHg) 120 (105 to 158) 125 (112 to 158) 0.7
Pulse rate (beats/min) 81 (74 to 101) 126 (112 to 143) 0.005
Temperature (°C) 35.6 (35.0 to 36.6) 36.9 (36.7 to 37.1) 0.04
Blood glucose level (mmol/l) 6.2 (4.0 to 8.0) 2.3 (1.0 to 3.5) 0.03
Maximum plasma insulin concentration (IU/l; n = 15) 192 (153 to 1,853) 209 (ND) 0.8
Plasma lactate concentration (mmol/l) 2.0 (1.7 to 2.8) 2.0 (1.8 to 2.9) 0.8
Mechanical ventilation in ICU (%) 19 75 0.05
Amount of infused glucose (g) 282 (167 to 1,056) 886 (574 to 1,410) 0.2
Duration of glucose infusion (hours) 24 (12 to 62) 57 (31 to 69) 0.4
Duration of ICU stay (days) 3 (2 to 6) 42 (5 to 82) 0.04
The patients were classified according to their Glasgow-Pittsburgh Cerebral Performance Category (CPC) on intensive care unit (ICU) discharge
in two outcome groups: 'favourable' (CPC 1 or 2) and 'unfavourable' (CPC 3 to 5). Values are expressed as median (25th to 75th percentile).
GCS, Glasgow Coma Scale; SAPS, Simplified Acute Physiology Score II.
Available online http://ccforum.com/content/11/5/R115
Page 5 of 10
(page number not for citation purposes)
[1,13,15]. It should be noted that patients may become
hypoglycaemic much later than predicted based on the con-
ventional duration of action of insulin preparations [7].
The cause of the dissociation between large doses of insulin
and the severity of subsequent hypoglycaemia remains
unclear [16]. In addition to activation of counter-regulatory
mechanisms, a rate-limiting system appears to be involved in
the blood glucose response to plasma insulin level, which is
not affected by increased circulating insulin [16,17]. This is
supported by the comparable efficacy between low-dose and
conventional high-dose insulin therapy in diabetic ketosis [18].
Moreover, in diabetic patients who are chronically exposed to
high levels of insulin, saturation of or decreased insulin recep-
tors alters the response of blood glucose to circulating insulin
[16]. It has also been hypothesized that there is a delayed dis-
sociation of insulin bound to antibodies in vivo, but this is con-
sidered rather unlikely [16]. In contrast, duration of
hypoglycaemia is usually much longer than predicted based
on the commonly accepted kinetics of insulin absorption and
action, whereas the degree of hypoglycaemia may not be so
profound, especially in patients who have diabetes [7]. Some
Figure 1
MRI findings in hypoglycemia-related encephalopathyMRI findings in hypoglycemia-related encephalopathy. Cerebral fast fluid-attenuated inversion recovery magnetic resonance imaging (MRI) in a
patient suffering from a severe hypoglycaemia-related encephalopathy on day 3 after deliberate insulin self-poisoning. The disseminated hypersig-
nals of the cerebral gray matter (plain arrows) disappeared on day 30, whereas neurological impairments persisted.
Figure 2
Delay from insulin self-injection to pre-hospital management versus duration of ICU stayDelay from insulin self-injection to pre-hospital management versus
duration of ICU stay. Shown is the correlation between the delay from
insulin self-injection to pre-hospital management and the duration of
intensive care unit (ICU) stay in 22 cases of insulin self-poisoning.
Figure 3
Duration of glucose infusion versus self-injected insulin doseDuration of glucose infusion versus self-injected insulin dose. Shown is
the correlation between the duration of glucose infusion and the self-
injected insulin dose in 25 cases of insulin self-poisoning.


![PET/CT trong ung thư phổi: Báo cáo [Năm]](https://cdn.tailieu.vn/images/document/thumbnail/2024/20240705/sanhobien01/135x160/8121720150427.jpg)


%20--%3e%3cdefs%3e%3cstyle%3e%20.st0%20{%20fill:%20%23fff;%20}%20.st1%20{%20fill:%20%237800fa;%20}%20%3c/style%3e%3c/defs%3e%3cpath%20class='st1'%20d='M117.78,12.18H43.11c2.9,3.47,4.65,7.94,4.65,12.82,0,5.6-2.3,10.66-6.01,14.29h76.02l7.22-13.56-7.22-13.56Z'/%3e%3cg%3e%3cpath%20class='st0'%20d='M53.58,26.17h-.59v-1.46h.59v-4.96h2.83c1.78,0,2.67.94,2.67,2.82v5.76c0,1.87-.89,2.81-2.67,2.81h-2.83v-4.96ZM55.36,21.37v3.34h1.1v1.46h-1.1v3.34h1.01c.61,0,.91-.37.91-1.1v-5.93c0-.74-.3-1.1-.91-1.1h-1.01Z'/%3e%3cpath%20class='st0'%20d='M65.99,31.14h-1.8l-.31-2.07h-2.19l-.31,2.07h-1.64l1.82-11.39h2.62l1.82,11.39ZM65.28,18.04c-.25.46-.51.77-.75.94-.21.15-.47.22-.79.22-.26,0-.57-.07-.92-.22l-.38-.15c-.14-.05-.26-.07-.37-.07-.3,0-.53.18-.71.54l-.91-.68c.25-.46.51-.77.75-.94.21-.14.48-.21.79-.21.26,0,.57.07.92.21l.38.15c.14.05.26.07.37.07.3,0,.53-.18.71-.54l.91.68ZM61.91,27.52h1.73l-.87-5.76-.87,5.76Z'/%3e%3cpath%20class='st0'%20d='M74.53,26.89v1.52c0,1.91-.89,2.86-2.67,2.86s-2.67-.95-2.67-2.86v-5.93c0-1.91.89-2.86,2.67-2.86s2.67.95,2.67,2.86v1.11h-1.69v-1.22c0-.75-.31-1.12-.93-1.12s-.93.37-.93,1.12v6.15c0,.74.31,1.11.93,1.11s.93-.37.93-1.11v-1.63h1.69Z'/%3e%3cpath%20class='st0'%20d='M81.4,31.14h-1.8l-.31-2.07h-2.19l-.31,2.07h-1.64l1.82-11.39h2.62l1.82,11.39ZM75.9,19.2l1.52-1.91h1.71l1.51,1.91h-1.61l-.76-.95-.75.95h-1.61ZM77.32,27.52h1.73l-.87-5.76-.87,5.76ZM83.1,15.99l-1.76,1.91h-1.26l1.17-1.91h1.86Z'/%3e%3cpath%20class='st0'%20d='M84.86,19.75c1.78,0,2.67.94,2.67,2.82v1.48c0,1.87-.89,2.81-2.67,2.81h-.85v4.28h-1.79v-11.39h2.64ZM84.01,21.37v3.86h.85c.58,0,.87-.36.87-1.08v-1.71c0-.71-.29-1.07-.87-1.07h-.85Z'/%3e%3cpath%20class='st0'%20d='M93.51,19.75c1.78,0,2.67.94,2.67,2.82v1.48c0,1.87-.89,2.81-2.67,2.81h-.85v4.28h-1.79v-11.39h2.64ZM92.66,21.37v3.86h.85c.58,0,.87-.36.87-1.08v-1.71c0-.71-.29-1.07-.87-1.07h-.85Z'/%3e%3cpath%20class='st0'%20d='M98.8,31.14h-1.79v-11.39h1.79v4.88h2.03v-4.88h1.83v11.39h-1.83v-4.88h-2.03v4.88Z'/%3e%3cpath%20class='st0'%20d='M105.36,24.55h2.46v1.62h-2.46v3.34h3.09v1.63h-4.88v-11.39h4.88v1.63h-3.09v3.18ZM108.17,17.29l-1.76,1.91h-1.26l1.17-1.91h1.86Z'/%3e%3cpath%20class='st0'%20d='M112.2,19.75c1.78,0,2.67.94,2.67,2.82v1.48c0,1.87-.89,2.81-2.67,2.81h-.85v4.28h-1.79v-11.39h2.64ZM111.35,21.37v3.86h.85c.58,0,.87-.36.87-1.08v-1.71c0-.71-.29-1.07-.87-1.07h-.85Z'/%3e%3c/g%3e%3ccircle%20class='st1'%20cx='25'%20cy='25'%20r='20'/%3e%3cpath%20class='st0'%20d='M32.78,19.27c2.92,0,4.43,2.55,5.28,5.33l.71,2.17c.14.38-.33.75-.71.75h-5.61c.19-.33.24-.71.09-1.08l-.75-2.45c-.43-1.32-.99-2.64-1.79-3.77.75-.57,1.65-.94,2.78-.94h0ZM25,18.38c3.25,0,4.9,2.78,5.89,5.89l.76,2.45c.14.42-.33.8-.8.8h-11.69c-.42,0-.94-.38-.8-.8l.75-2.45c.99-3.11,2.64-5.89,5.89-5.89h0ZM25,11.35c1.74,0,3.11,1.37,3.11,3.11s-1.37,3.11-3.11,3.11-3.11-1.41-3.11-3.11,1.41-3.11,3.11-3.11h0ZM17.27,19.27c1.08,0,1.98.38,2.73.94-.8,1.13-1.37,2.45-1.74,3.77l-.8,2.45c-.14.38-.05.75.09,1.08h-5.56c-.42,0-.9-.38-.75-.75l.71-2.17c.9-2.78,2.41-5.33,5.33-5.33h0ZM17.27,12.91c1.51,0,2.78,1.27,2.78,2.83s-1.27,2.83-2.78,2.83-2.83-1.27-2.83-2.83,1.27-2.83,2.83-2.83h0ZM32.78,12.91c1.56,0,2.78,1.27,2.78,2.83s-1.23,2.83-2.78,2.83-2.83-1.27-2.83-2.83,1.27-2.83,2.83-2.83h0ZM27.07,28.56v.09c0,.57-.24,1.08-.61,1.46h0v.05c-.38.33-.9.57-1.46.57s-1.08-.24-1.46-.61h0c-.38-.38-.61-.9-.61-1.46v-.09h1.41v.09c0,.19.05.38.19.47v.05c.09.09.28.19.47.19s.38-.09.47-.19v-.05c.14-.09.24-.28.24-.47t-.05-.09h1.41ZM30.99,28.56v.09c0,1.65-.66,3.16-1.74,4.24-1.08,1.08-2.59,1.79-4.24,1.79s-3.16-.71-4.24-1.79l-.05-.05c-1.04-1.08-1.7-2.55-1.7-4.2v-.09h1.41v.09c0,1.27.47,2.4,1.27,3.25h.05c.85.85,1.98,1.37,3.25,1.37s2.4-.52,3.25-1.37c.85-.8,1.37-1.98,1.37-3.25v-.09h1.37ZM34.99,28.56v.09c0,2.78-1.13,5.28-2.92,7.07-1.79,1.79-4.29,2.92-7.07,2.92s-5.23-1.13-7.07-2.92c-1.79-1.79-2.92-4.29-2.92-7.07v-.09h1.41v.09c0,2.4.94,4.53,2.5,6.08,1.56,1.56,3.72,2.5,6.08,2.5s4.52-.94,6.08-2.5c1.56-1.56,2.5-3.68,2.5-6.08v-.09h1.41Z'/%3e%3c/svg%3e)