Specific biomarkers for stochastic division patterns and starvation-induced quiescence under limited glucose levels in fission yeast Toma´ sˇ Pluskal1, Takeshi Hayashi1,2, Shigeaki Saitoh3, Asuka Fujisawa2,* and Mitsuhiro Yanagida1,2
1 Okinawa Institute of Science and Technology Promotion Corporation, Okinawa, Japan 2 CREST Research Project, Japan Science and Technology Corporation (JST), Graduate School of Biostudies, Kyoto University, Japan 3 Division of Cell Biology, Institute of Life Science, Kurume University, Fukuoka, Japan
Keywords CDP-choline; ergothioneine; glutathione; longevity; trehalose
Correspondence M. Yanagida, CREST Research Project, Japan Science and Technology Corporation (JST), Graduate School of Biostudies, Kyoto University, Sakyo-ku, Kyoto 606-8501, Japan Fax: +81 75 753 4208 Tel: +81 75 753 4205 E-mail: yanagida@kozo.lif.kyoto-u.ac.jp
*Present address Kashiwa Chuo High School, Chiba, Japan
Re-use of this article is permitted in accordance with the Terms and Conditions set out at http://wileyonlinelibrary.com/ onlineopen#OnlineOpen_Terms
(Received 14 October 2010, revised 1 January 2011, accepted 7 February 2011)
doi:10.1111/j.1742-4658.2011.08050.x
to 40 mM H2O2 as a result of Glucose as a source of energy is centrally important to our understanding of life. We investigated the cell division–quiescence behavior of the fission yeast Schizosaccharomyces pombe under a wide range of glucose concentra- tions (0–111 mM). The mode of S. pombe cell division under a microfluidic perfusion system was surprisingly normal under highly diluted glucose con- centrations (5.6 mM, 1 ⁄ 20 of the standard medium, within human blood sugar levels). Division became stochastic, accompanied by a curious divi- sion-timing inheritance, in 2.2–4.4 mM glucose. A critical transition from division to quiescence occurred within a narrow range of concentrations (2.2–1.7 mM). Under starvation (1.1 mM) conditions, cells were mostly qui- escent and only a small population of cells divided. Under fasting (0 mM) conditions, division was immediately arrested with a short chronological lifespan (16 h). When cells were first glucose starved prior to fasting, they possessed a substantially extended lifespan ((cid:2)14 days). We employed a quantitative metabolomic approach for S. pombe cell extracts, and identi- fied specific metabolites (e.g. biotin, trehalose, ergothioneine, S-adenosyl methionine and CDP-choline), which increased or decreased at different glucose concentrations, whereas nucleotide triphosphates, such as ATP, maintained high concentrations even under starvation. Under starvation, the level of S-adenosyl methionine increased sharply, accompanied by an increase in methylated amino acids and nucleotides. Under fasting, cells rapidly lost antioxidant and energy compounds, such as glutathione and in fasting cells after starvation, these and other metabolites ATP, but, ensuring longevity remained abundant. Glucose-starved cells became resis- the accumulation of antioxidant tant compounds.
Introduction
Abbreviations CPT, camptothecin; HEPES, 4-(2-hydroxyethyl)-1-piperazineethanesulfonic acid; H2DCFDA, 2¢,7¢-dichlorodihydrofluorescein diacetate; PIPES, piperazine-N,N¢-bis(2-ethanesulfonic acid); SAH, S-adenosyl-homocysteine; SAM, S-adenosyl-methionine; YFP, yellow fluorescent protein.
FEBS Journal 278 (2011) 1299–1315 ª 2011 The Authors Journal compilation ª 2011 FEBS
1299
respiratory electron transport H2O generates ATP by glycolysis in the cytosol and subsequent coupled to oxidative phosphorylation in the mitochondria. Glucose is made by photosynthesis in plants and cer- tain bacteria. It is the essential source of cellular energy for all organisms as its metabolism to CO2 and
T. Pluskal et al.
Fission yeast division under glucose starvation
analysis of the S. pombe metabolome using LC ⁄ MS, with the semi-quantitative analysis of more than 100 principal metabolites [23]. We applied such analysis for S. pombe cells cultured under a wide range of different glucose conditions. Some specific metabolites may be designated as biomarkers, because of their distinct diagnostic responses (increase or decrease) at different glucose concentrations.
Results
Multiplication of S. pombe at a glucose level equivalent to that in human blood
(111 mm, 2000 mgÆdL)1). Glucose forms polymerized complexes, such as starch, glycogen or cellulose, for storage and architecture. Glucose is circulated within the human body via the bloodstream for supply to body cells. Hormones, such as insulin, control the uptake, storage and consump- tion of glucose in human bodies [1]. The level of glu- cose in the human blood is tightly regulated as a part of metabolic homeostasis, fluctuating during the day and peaking after meals. Normally, the human blood glucose reference level (the daily lowest level before breakfast) is maintained within a range of approxi- mately 3.9–6.1 mm [2]. Glucose levels rise briefly after meals for an hour or two. In diabetic patients, normal regulation of blood glucose levels is disrupted for vari- ous reasons, resulting in a generally prolonged high concentration of glucose in the blood [3].
to the normal equivalent replication [12],
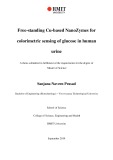
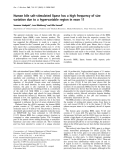
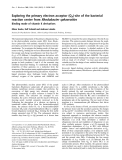
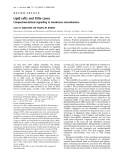
The standard synthetic medium EMM2 for S. pombe contains 2% glucose It should be noted that glucose is the sole carbon source in EMM2 as the nitrogen source is NH4Cl (not amino acids). To examine whether S. pombe grows and divides under a glucose concentration similar to that in human blood, S. pombe was cultured in 20 mL of EMM2 med- ium containing 25-fold-diluted glucose (4.4 mm), the concentration level (80 mgÆdL)1) in human blood before breakfast. As shown in Fig. 1A, the cell number increase (red line) and the remaining glucose concentration (green line) were measured at 26 (cid:2)C in the culture transferred from 111 to 4.4 mm glucose at 0 h (left panel) and in the control culture transferred to the same 111 mm glucose medium (right panel; Fig. S1 obtained at 30 (cid:2)C). After transfer to 4.4 mm glucose, the cell number increased only approximately five-fold from 2 · 106 mL)1, and the remaining glucose was exhausted after approxi- mately 10–14 h. In the control 111 mm glucose med- ium, however, the cell number continued to increase approximately 15-fold after 10–14 h, and the glucose concentration at that time remained high (85 mm).
Glucose was nearly exhausted at the end of the experiment for the initial 4.4 mm glucose, and the dou- bling times from the cell number increase during the earlier period (4–8 h, (cid:2)3.0 mm remaining glucose) were 3.3 and 4.2 h at 30 and 26 (cid:2)C, respectively. In the 111 mm glucose medium, the doubling times were 2.5 and 3.5 h at 30 and 26 (cid:2)C (4–8 h, (cid:2)100 mm remaining glucose), respectively. Considering the large difference (25-fold) in glucose concentrations, the difference in the doubling time was surprisingly small. The fission yeast Schizosaccharomyces pombe is an excellent model eukaryote [4–6] for a number of cell biologic issues, such as cell division cycle control [7], meiosis [8], actin- and microtubule-mediated cytoskele- tal organization [9], centromere ⁄ kinetochore-based chromosome segregation [10], DNA damage repair [11], transcription [13] and gene silencing [14]. S. pombe contains mitochondria with a small-sized DNA, similar to that in humans [15], lyso- some-like vacuoles [16], peroxisomes [17], lipid drop- lets, endosomes and endoplasmic reticulum, all of which may be important for the support of cellular glucose metabolism. It has been proposed to utilize S. pombe as a model for cellular aging [18,19]. Glucose is reported to enhance aging in many organisms, inclu- ding S. pombe [20]. Establishing S. pombe as a model for glucose metabolism would allow for the use of powerful genetic methods available for this organism. If cellular regulatory systems for glucose utilization are highly conserved between humans and fission yeast, S. pombe studies may be useful to understand human glucose-related diseases such as diabetes. Such studies must, however, be performed at a similar glucose concentration to that supplied to human cells via the bloodstream, as in excess glucose the phenotypes associ- ated with diseases may not be observed. In general, the glucose concentration in standard laboratory culture media for fungi is approximately 20–30 times higher than that in normal human blood [21]. Even the stan- dard Dulbecco’s medium (DMEM) for human cell lines contains several times higher glucose levels [22].
Decreased cell size helps to maintain the doubling time under low glucose conditions
FEBS Journal 278 (2011) 1299–1315 ª 2011 The Authors Journal compilation ª 2011 FEBS
1300
To avoid the problem of a decrease in glucose concen- tration when determining various parameters of cell In this study, we evaluated the mode of S. pombe cell division under a wide range of glucose concentra- tions, using the perfusion system, and show that S. pombe cells can efficiently increase in number at glu- cose concentrations similar to those in normal human blood. Previously, we have reported the comprehensive
T. Pluskal et al.
Fission yeast division under glucose starvation
A
D
B
E
F
C
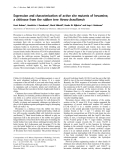
Fig. 1. Cell behavior of S. pombe under limited glucose concentrations. (A) Cells cultured in standard medium containing 111 mM glucose were shifted to medium containing 4.4 mM glucose (left) or to control culture containing the same amount (111 mM) of glucose (right). The cell number increase and the level of glucose remaining in the liquid culture were measured at 26 (cid:2)C for 14 h. (B) Comparison of the cell number increase between the two culture systems. Red: cells cultivated in a water bath shaker in liquid EMM2 culture (111 mM glucose), collected by vacuum filtration and switched to a new medium (4.4 mM glucose). Blue: cells fixed in a microscopic perfusion system, which constantly supplied fresh medium, switched from 111 to 4.4 mM glucose. (C) The doubling time (h) under different glucose concentrations was obtained by the observation of movies taken using the microscopic perfusion system (see text). (D) The mean cell length of dividing cells under the perfusion system was determined for different glucose concentrations. (E) Micrographs of cells cultured in different glucose concentrations. (F) Micrographs of cells in the same microscope field at 0 h (top) and 48 h (bottom) in culture medium containing 1.7 mM (left) and 1.1 mM (right) glucose. Cells identified by red numbers did not divide, whereas cells identified by black numbers performed one or several divisions.
FEBS Journal 278 (2011) 1299–1315 ª 2011 The Authors Journal compilation ª 2011 FEBS
1301
division using static culture conditions (no exchange of the medium over time), we employed a low-volume specimen chamber that was continuously supplied with fresh culture medium (Onix(cid:3) Microfluidic Perfusion System, CellASIC, Hayward, CA, USA) at a flow rate of 3 lLÆh)1. Using a DeltaVision microscope system (Applied Precision, Issaquah, WA, USA), which was installed in a room kept at a constant temperature (26 (cid:2)C), movies were obtained of living cells that were 111 mm cultured in medium containing initially glucose and then changed to medium containing 111 (control), 11.1, 4.4, 2.2, 1.7, 1.1 or 0 mm glucose (Movies S1–S7). Cells divided frequently in 111, 11.1 and 4.4 mm glucose, but the division rate decreased in 2.2 mm, decreased further in 1.7 and 1.1 mm, and stopped completely in 0 mm glucose. The period of temporal cell division arrest observed after the culture change from 111 to 4.4 mm glucose was shorter in the perfusion system (blue, Fig. 1B) than in the liquid cul- ture (red), perhaps as a result of the simplicity of the culture change manipulation: the microscopic perfu- sion was continuous and did not require a filter to collect cells for the intermittent medium change, which cells. probably caused a physical shock to the
T. Pluskal et al.
Fission yeast division under glucose starvation
A number of cells in the movies were followed over time (24–48 h). Under starvation, stochastic division and quiescence prevail
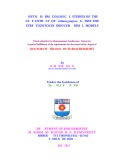
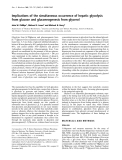
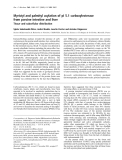
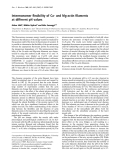
The doubling time was obtained for the second and third division (Fig. 1C), as the first division time showed large variations as a result of the diverse cell cycle points at the time of the glucose concentration shift. The mean values (3.5–3.8 h) for the doubling time of cells cultured in 111, 11.1 and 4.4 mm glucose were virtually identical, but increased (5.6 h) in 2.2 mm glucose. At lower glucose concentrations (1.7 and 1.1 mm), division was scarce with a long doubling time and large standard deviations. We measured the doubling time (obtained from mov- ies) for a number of individual cells in the perfusion system, and the distribution under different glucose concentrations is shown in Fig. 2A. In 1.7 and 1.1 mm glucose, the number of nondividing cells increased, and the doubling time became broadly distributed. In 2.2 mm glucose, most cells divided, although the dou- bling time was longer than that of cells cultured in 111 and 4.4 mm glucose.
Based on the narrow doubling time distribution in the second and third divisions, the doubling time was quite uniform for 111 and 4.4 mm glucose, and the stochastic nature of cell division became apparent in 2.2 mm glucose, and prominent in 1.7 and 1.1 mm glucose conditions. A sharp transition thus existed between the 2.2 and 1.7 mm glucose conditions: the second division doubling time was approximately 7 h for 2.2 mm glucose and 4–48 h for 1.7 mm glucose. Nondividing cells were scarce in 2.2 mm glucose, but plentiful in 1.7 and 1.1 mm glucose; hence, we desig- nated 1.7 and 1.1 mm glucose conditions as ‘substar- vation’ and ‘starvation’, respectively.
We then examined how cells in 4.4 mm glucose man- aged to divide with a doubling time that matched that in 111 mm glucose. Cells became short and pear- shaped under glucose limitation. As shown in Fig. 1D, E, the cell length at the time of division was reduced from a mean of 15 lm in 111 mm glucose to approxi- mately 13 lm in 4.4 mm and 10 lm in 2.2 mm glucose. In 11.1 mm glucose, the doubling time was identical and the cell length was intermediate between that at 111 and 4.4 mm glucose. Considering the reduced cell size and accumulation of certain stress-related metabo- lites (see below), we designated the 4.4 mm glucose concentration as the ‘diet’ condition. The 11.1 mm glu- cose concentration was designated as the ‘regular’ con- dition, as such effects were small.
Division timing is inherited from mother to daughters under starvation Glucose starvation causes semiquiescence
We characterized more detailed division patterns by measuring the time course of changes in cell length by following a number of cell lineages. In 111 and 4.4 mm glucose, each of three examples of lineages indicated that the division patterns of mother–daughter–grand- daughter cells were quite similar (Fig. 2B). A cell length plateau normally exists, which indicates that mitosis and cell separation are arrested with an increase in cell length. In 4.4 mm glucose, the initial cell division arrest seemed to occur at any stage of the cell cycle and lasted for approximately 4 h.
FEBS Journal 278 (2011) 1299–1315 ª 2011 The Authors Journal compilation ª 2011 FEBS
1302
lineages In the 2.2 and 1.7 mm glucose conditions, an irregu- lar cell division mode was obvious for individual cell lineages (Fig. 2B, two right panels). The doubling time occasionally exceeded 7 h in 2.2 mm and 24 h in 1.7 mm glucose. It should be noted that certain lin- eages continuously divided, but others did not divide at all, during the observation period. In 2.2 mm glu- cose, the mother cells that showed a short doubling time tended to produce daughters that also showed a short doubling time. This was substantiated by evalu- ating the doubling time between the second and third in 2.2 mm glucose division from the cell (Fig. 2C). Cells with a short doubling time (red lines) In 2.2 mm glucose, the doubling time increased con- siderably (5.6 h versus 3.5 h) and the cell length at the time of division decreased (10 lm versus 15 lm) in comparison with the 111, 11.1 and 4.4 mm glucose conditions. Further reduction of glucose to 1.7 and 1.1 mm induced semiquiescence among many cells when shifted from 111 mm glucose. In Fig. 1F, the top images were taken at the beginning of incubation and the bottom images were taken after 48 h in 1.7 mm (left) and 1.1 mm (right) glucose. The cells indicated by the black numbers divided one to four times during the 48 h, and those marked by the red numbers did not divide. The starving glucose condi- tions caused by these concentrations induced quies- cence and infrequent division. The ability to divide seemed quite variable among individual cells; certain cells were either nondividing or divided up to four times. Cell viability, however, did not decrease at all during the 48 h, and remained close to 100% for 7 days (see Fig. 6A), a result consistent with a previ- the chronological ously published observation that lifespan of S. pombe increases in a limited glucose environment [20].
T. Pluskal et al.
Fission yeast division under glucose starvation
A
B
C
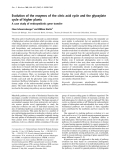
Fig. 2. Cell division timing under restricted glucose. (A) The division timing (h) from the first to the third division was measured for a number of cells cultured in the perfusion system in media with different glucose concentrations (111, 4.4, 2.2, 1.7 and 1.1 mM). (B) Cell division tim- ing was monitored by measuring the cell length vs. time (h) for three individual cells (A, B and C) cultured in 111, 4.4, 2.2 or 1.7 mM glucose. The top panels show detailed cell length measurements for two individual cells (A and B) vs. time. The bottom table shows the time span between divisions for cells A, B and C. (C) Inheritance of the doubling time for cells cultured in medium containing 2.2 mM glucose. The dou- bling time of the second division (left) was classified by three colors (short, red; medium, black; long, green) and connected to the doubling time of the third division (right) of the same cell.
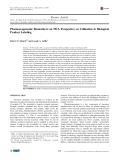
also had short intervals between subsequent divisions. Cells with a longer doubling time (green) also had long intervals between subsequent divisions. The reason for such an ‘inheritance’ is unknown. glucose, but increased to 3–6% at glucose concentra- tions below 4.4 mm (Fig. 3B). It should be noted that cell viability did not decrease, even in 1.1 mm glucose; these asymmetric divisions apparently do not thus, affect viability.
Asymmetric division under glucose starvation
Fasting causes the arrest of organelle movement and the loss of viability
cycle progression was
FEBS Journal 278 (2011) 1299–1315 ª 2011 The Authors Journal compilation ª 2011 FEBS
1303
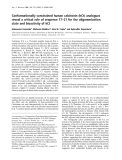
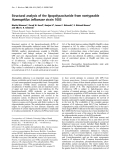
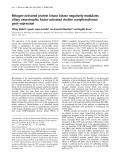
When shifted to a 0 mm glucose medium (i.e. ‘fasting’), cell immediately blocked (Movie S1). A small increase (< 1%) in the cell num- ber, however, was observed; a tiny fraction of cells with a septum appeared to commit cell separation even The division pattern of S. pombe is symmetrical with regard to the site of septation and cytokinesis. The positions of septation were often not precisely at the equator in dividing cells in 4.4 and 2.2 mm glucose (Fig. 3A). The relative standard deviation of the cell length ratio of the daughter cells (unity indicates per- fectly symmetrical division) was about 2% in 111 mm
T. Pluskal et al.
Fission yeast division under glucose starvation
A
C
B
D
Fig. 3. Asymmetric division and lifespan increase of cells in 0 mM glucose that had been treated previously by starvation (A) Representative micrographs of cells that display asymmetric septation in medium containing 4.4 or 2.2 mM glucose. (B) Cell length ratio of two daughter cells from one mother is shown in the first and second divisions for different glucose concentrations. In the top section, the relative stan- dard deviation (RSD) of the ratios is plotted. (C) Images from movies of cells in the medium lacking glucose (fasting condition). The number indicates time (h:min:s). (D) Lifespan increase for the cells pretreated by glucose starvation. Viability (%) was measured for cells shifted from the culture containing excess glucose (111 mM) directly to fasting glucose (0 mM; blue line) and for cells previously treated by diet glucose (4.4 mM; red) or starvation glucose (1.1 mM; green) for 16 h.
(e.g.
after the initiation of fasting. The movement of intra- cellular organelles was arrested around 1–2 h after the initiation of fasting. Significant changes were observed large, apparently in the cytoplasmic features empty vacuoles) after 6 h (Fig. 3C). Cells displaying these striking changes were still viable, as their ability to form colonies on a replenished glucose-containing plate was nearly 100% after 8 h in 0 mm glucose. Cell viability after the abrupt shift to the 0 mm glucose liquid culture from the standard 111 mm glucose med- ium was found to be nearly completely lost, however, after 32 h (Fig. 3D; blue line). cose (diet condition) for 16 h and then shifted to 0 mm glucose, viability improved slightly from 32 h to 2– 4 days (Fig. 3D; red line). If precultured in 1.1 mm glucose (starvation condition) for 16 h and then chan- ged to 0 mm glucose, the cell lifespan was dramatically prolonged (green line). Viability remained over 90% and 81% for 8 and 10 days, respectively, and then decreased to 1% at 16 days. Previous starvation treat- ment thus increased the lifespan by approximately 10 times under the fasting condition. These remarkable findings of a lifespan increase under fasting conditions by previous starvation were further investigated by metabolomic analysis (see below).
Previous starvation increases lifespan under fasting Metabolic biomarkers revealed under different glucose concentrations
FEBS Journal 278 (2011) 1299–1315 ª 2011 The Authors Journal compilation ª 2011 FEBS
1304
The lifespan of cells under 0 mm glucose was pro- longed if the cells were precultured under starvation conditions. When cells were precultured in 4.4 mm glu- We evaluated the cellular metabolic changes that occurred on changes in the glucose concentration.
T. Pluskal et al.
Fission yeast division under glucose starvation
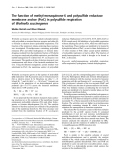
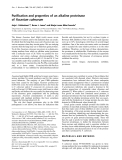
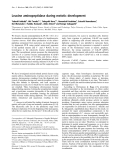
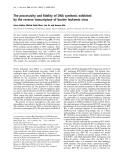
2.2 mm glucose (Fig. 4E). It was noted that a number of methylated amino acids and nucleosides were also increased in low glucose (Fig. 4E). Trehalose and ergo- thioneine were produced in cells under the 5.6 mm glu- cose condition, whereas only small amounts were produced in the two-fold higher (11.1 mm) glucose indicating that 5.6 mm was the threshold condition, glucose concentration for the production of trehalose and ergothioneine.
except concentrations,
Metabolic profiling was performed using LC ⁄ MS as described previously [23]. Methanol (50%)-extracted samples obtained from S. pombe wild-type cells grown in liquid culture containing different glucose concen- trations for 6 h at 26 (cid:2)C were analyzed. It should be noted that the glucose concentrations below are the initial values, and culture conditions cannot be consid- ered to be completely steady as in the case of the per- concentrations the actual glucose fusion system; decreased at the time (6 h) of metabolite extraction, but were very dependent on the cell concentrations. For the case of 4.4 mm glucose and the initial cell con- centration of 2 · 106 mL)1, a concentration of (cid:2)3 mm glucose remained at the time (6 h) of metabolite extractions (Fig. 1A). The numerical results of three sample extractions in each condition are reported in independent metabolomic Table S1. The results of experiments were mostly reproducible. The potent antioxidant glutathione, a tripeptide of glutamate, cysteine and glycine, was abundant at all for 0 mm glucose glucose (Fig. 4F). Oxidized glutathione, however, did not increase. Cells under abrupt fasting therefore seemed susceptible to oxidative stress. We encountered some technical difficulties with reproducible measurements of glutathione levels, so that a number of measure- ments were performed for glutathione.
ATP, ADP, AMP and adenosine Glycolysis-related metabolites
similarly
ATP levels were high in 111 to 1.1 mm glucose, 6 h after the glucose shift (Fig. 4A). Under 0 mm glucose, ATP levels decreased dramatically, whereas AMP and adenosine increased sharply. GTP, CTP, UTP and to ATP behaved phosphoenolpyruvate (Table S1). The high-energy compounds were thus even in 1.1 mm glucose, but decreased plentiful, strongly in 0 mm glucose. Glycolysis pathway intermediates, such as phosphory- lated glucose and fructose, were abundant at high glucose concentrations, but diminished in the starva- tion condition and were absent in the fasting condi- (activated form of tion (Fig. 4H). UDP-glucose glucose), however, maintained a high level, even in 1.1 mm glucose, and only disappeared in the fasting condition.
increased in the fasting Compounds decreased or condition Fructose-1,6-diphosphate, an intermediate in glycol- ysis prior to cleavage into triose, decreased strongly at glucose concentrations below 11.1 mm. The change seemed to be the reverse of that of trehalose.
S-Adenosyl methionine and methylation products
Certain biosynthetic precursor compounds, such as UDP-glucose, acetyl-CoA and phosphoglyceric acid, were virtually absent in 0 mm glucose, like ATP and other high-energy compounds, but plentiful at higher glucose concentrations. In contrast, the CDP-bound lipid components, CDP-choline and CDP-ethanol- amine (precursors for phosphatidylcholine and phos- phatidylethanolamine, respectively), increased sharply (Fig. 4B).
Increase in ergothioneine and trehalose in low glucose
S-Adenosyl-methionine (SAM), a methyl donor com- pound, increased strongly ((cid:2)20-fold) at glucose con- below 2.2 mm, whereas S-adenosyl- centrations homocysteine (SAH) levels decreased. In the fasting condition, the SAM level was minimal, whereas the SAH level increased sharply (Fig. 4G). SAH may be increases during fasting, a marker compound that whereas SAM may be a marker metabolite that increases during starvation. The methyl transfer reactions to proteins such as histones and tRNAs might be activated under glucose starvation, but not in fasting.
Biotin
FEBS Journal 278 (2011) 1299–1315 ª 2011 The Authors Journal compilation ª 2011 FEBS
1305
Two metabolic compounds showed sharply increased levels in low-glucose (1.1–5.5 mm) cultures. The peak area of trehalose, a disaccharide (a,a-1,1-glucoside bond between two a-glucose units), increased strongly in 2.2 mm glucose (Fig. 4C). Another increased com- pound, ergothioneine, is a trimethylated thiol deriva- tive of histidine (Fig. 4D). Trimethyl histidine, a precursor of ergothioneine, also increased sharply in The level of biotin, which was high in excess (111 mm) and standard (11 mm) glucose, diminished in the diet
T. Pluskal et al.
Fission yeast division under glucose starvation
B
C
D
A
E
F
G
H
I
Fig. 4. Peak areas of potential biomarker compounds in 10 different glucose concentrations determined by the LC ⁄ MS method. Cells were switched to media containing 10 different glucose concentrations and cultivated for 6 h. Note that the glucose concentrations were initial at the start of cultivation. Metabolite extracts were prepared three times and mean peak areas with standard deviations of the following metab- olites are shown: (A) ATP, ADP, AMP and adenosine; (B) CDP-choline, CDP-ethanolamine; (C) trehalose; (D) ergothioneine; (E) methylated amino acids and nucleosides; (F) reduced (GSH) and oxidized (GSSG) glutathione; (G) S-adenosyl-methionine, S-adenosyl-homocysteine; (H) UDP-glucose, glucose-6-phosphate, fructose-6-phosphate, fructose-1,6-diphosphate; (I) biotin.
Decay of energy metabolites and cell death under 0 mM glucose
FEBS Journal 278 (2011) 1299–1315 ª 2011 The Authors Journal compilation ª 2011 FEBS
1306
and starvation conditions of glucose, and decreased to zero in the fasting condition (Fig. 4I). The changes in biotin were unique, as no other metabolite showed a similar pattern of change according to glucose concentrations. transfer from 111 to 0 mm Following the abrupt glucose for 6 h at 26 (cid:2)C, the levels of energy-related
T. Pluskal et al.
Fission yeast division under glucose starvation
A
B
C
D
E
F
Fig. 5. The time course change of the peak areas of key metabolites in cells switched to a fasting (0 mM) glucose condition from 111 mM glucose. S. pombe cells cultivated in mid-logarithmic phase (5 · 106 cellsÆmL)1) in standard EMM2 medium containing 111 mM glucose were shifted to the fasting condition (0 mM glucose) and metabolites were extracted after 0 min (prior to shift), 5 min, 2 h, 4 h and 8 h. Three samples were prepared at each time point. Mean peak areas with standard deviations of the following metabolites are shown: (A) UDP-glu- cose, GDP-glucose, glucose-6-phosphate, fructose-6-phosphate, fructose-1,6-diphosphate; (B) ATP, ADP and AMP; (C) CDP-choline, CDP-eth- anolamine; (D) reduced (GSH) and oxidized (GSSG) glutathione; (E) S-adenosyl-methionine, S-adenosyl-homocysteine; (F) biotin.
compounds all became negligible
to 100-fold,
metabolic (see above). All metabolites implicated in glycolysis and an- tioxidative stress-protective compounds decreased dras- tically. It should be noted that cells in 0 mm glucose for 6 h were unhealthy but not dead, as they could fully recover to form colonies if glucose was replen- ished at this time (Fig. 3D).
CDP-ethanolamine and CDP-choline, markers for glu- cose fasting, began to increase at 5 min and increased steadily by 10- respectively, at 8 h (Fig. 5C). Glutathione, SAM and biotin (Fig. 5D–F) levels decreased steadily to zero at around 8 h. Although the data for glutathione (GSH) were variable its mean peak area showed a for unknown reasons, the cell’s clear decrease after 2 h. Taken together, response to 0 mm glucose was very rapid, around 5 min, with regard to the shut-off of energy metabo- lism, but loss of viability occurred much later, after 8 h (Fig. 3D).
Metabolic compound analysis during the lifespan increase after starvation
FEBS Journal 278 (2011) 1299–1315 ª 2011 The Authors Journal compilation ª 2011 FEBS
1307
To determine how quickly the cells could respond to the fasting environment, the time course of changes of metabolites was analyzed (numerical data in Table S2). S. pombe cells first grown in 111 mm glucose were switched to 0 mm glucose, and metabolites were extracted at 0 and 5 min and 2, 4 and 8 h. Within 5 min, a large change occurred for many compounds. A very fast decay of UDP-glucose, phosphorylated glucose and fructose (Fig. 5A), phosphoenolpyruvate indicating and acetyl-CoA (Table S2) was observed, that the glycolysis pathway quickly consumed its remaining free intermediates. The loss of UDP-glucose within 5 min explains the lack of an increase in treha- lose. ATP decreased by three-fold within 5 min (Fig. 5B), and AMP increased five- to six-fold. At 4 h, the level of ATP decreased to approximately 3%. The increased lifespan after cells went through starva- tion was studied by analyzing the metabolites, and the results are shown in Fig. 6 and Table S3. Cells were cultured in 1.1 mm glucose medium for 7 days (1.1 mm was the initial concentration, and the exhaustion of glucose in the medium should occur within 1 day). remained fully viable during the experiment Cells
T. Pluskal et al.
Fission yeast division under glucose starvation
B
C
A
D
E
F
Fig. 6. The time course change of the peak areas of key metabolites in cells switched to the starvation condition (1.1 mM glucose) from 111 mM glucose. S. pombe cells cultivated in mid-logarithmic phase (5 · 106 cellsÆmL)1) in standard EMM2 medium containing 111 mM glu- cose were shifted to the starvation condition (1.1 mM glucose) and metabolites were extracted after 30 min, 1 h, 4 h, 1 day, 2 days and 7 days. Three samples were prepared at each time point. Mean peak areas with standard deviations of the following metabolites are shown: (A) ATP, ADP and AMP; cell viability is also shown in this plot; (B) ergothioneine, trimethyl-histidine; (C) trehalose; (D) S-adenosyl-methionine, S-adenosyl-homocysteine; (E) CDP-choline, CDP-ethanolamine; (F) ferrichrome, deferriferrichrome.
(Fig. 6A). ATP levels decreased but, after 7 days, were still over 10 times higher than those of cells shifted immediately to 0 mm from 111 mm glucose (Fig. 6A). AMP levels were high after 2 and 7 days. The UTP, CTP and GTP levels after the starvation treatment were also much higher than those of cells transferred directly from 111 to 0 mm glucose (Table S3).
from 111 to 0 mm glucose for 6 h showed strong fluo- rescent signals (Fig. 7A). We counted the percentage stained by H2DCFDA in each condition of cells (Fig. 7B). Although 94% of cells in 0 mm glucose were stained, almost no signals were observed in cells shifted from 111 mm to low glucose levels (1.1–4.4 mm) or in cells first treated with 1.1 mm glucose for 16 h and then transferred to fasting for 6 h. We interpret these results to indicate that the oxidative stress produced was not reduced appropriately in fasting cells as a result of the loss of antioxidant compounds. It should be noted that the cell viability was still nearly 100% at this time point (Fig. 3D).
Anti-stress compounds, such as ergothioneine, its precursor trimethyl histidine and trehalose, were main- tained at high levels in the starvation-mediated fasting condition (Fig. 6B, C). Levels of SAM and SAH were high after 7 days (Fig. 6D), suggesting the importance of this compound for longevity. The levels of CDP- choline (Fig. 6E) and ferrichrome (an iron-carrying compound; Fig. 6F) were high after 7 days.
Oxidative stress and DNA damage signals in glucose-fasting and glucose-starved cells
than cells
FEBS Journal 278 (2011) 1299–1315 ª 2011 The Authors Journal compilation ª 2011 FEBS
1308
Considering the rapid decrease in the antioxidants glutathione and ergothioneine in 0 mm glucose, we employed a fluorescent probe, 2¢,7¢-dichlorodihydro- fluorescein diacetate (H2DCFDA), to check for the presence of oxidative stress. Only cells abruptly shifted The increase in ergothioneine in starvation condi- tions may indicate increased resistance to oxidative stress. We challenged the cells with 40 mm H2O2, a concentration previously reported to kill S. pombe cells within 1 h [24]. The results shown in Fig. 7C indicate that cells incubated in 0 mm glucose for 6 h (blue squares) were sensitive to H2O2 oxidative stress, whereas cells cultivated in 1.1 mm glucose (green in squares) were much more resistant 111 mm glucose (red squares) or 0 mm fasting cells. Fasting cells abruptly shifted from 111 mm glucose
T. Pluskal et al.
Fission yeast division under glucose starvation
B
A
D
C
E
F
G
Fig. 7. Oxidative stress and DNA damage observation. (A) Oxidative stress accumulation was observed using H2DCFDA dye. Cells were cul- tured for 6 h in 111, 4.4, 1.1 and 0 mM glucose, or precultivated in 1.1 mM glucose for 16 h prior to the switch to 0 mM glucose medium for 6 h (rightmost image). Micrographs show representative examples of cells. (B) Percentage of cells stained by H2DCFDA dye is plotted for each observed condition (see A). The number in parentheses indicates the amount of observed cells. (C) Cells were incubated in excess (111 mM), starvation (1.1 mM) and fasting (0 mM) glucose conditions for 6 h, followed by the addition of H2O2 to the final concentration of 40 mM. Viability (%) was measured in 20-min intervals. (D) The frequency of cells resistant to camptothecin (CPT) per 106 cells was mea- sured after 6 or 12 h of incubation in 111, 11.1, 4.4, 2.2, 1.1 and 0 mM glucose. (E) The rate of loss of minichromosome was measured using the CN2 strain [27] after incubation in 111, 11.1, 4.4 and 2.2 mM glucose. The mis6-302 strain, which often loses a minichromosome [47], was used as the control. (F) Micrographs showing Rad22-YFP signals [45] after 8 h of cultivation in 111, 1.1 and 0 mM glucose. Red arrows indicate the observed Rad22 foci. The rightmost image shows cells precultivated in 1.1 mM glucose for 16 h prior to the switch to 0 mM glucose medium for 8 h. (G) Summary of the glucose concentrations described in this article. Concentrations are listed in three com- monly used notations: millimolar (mM), percentage (w ⁄ v) or mgÆdL)1. Biomarker metabolites increased (›) or decreased (fl) in each condition are noted, as well as the corresponding cell division phenotypes.
FEBS Journal 278 (2011) 1299–1315 ª 2011 The Authors Journal compilation ª 2011 FEBS
1309
report were the most sensitive to 40 mm H2O2. These results are consistent with a very recent showing that glucose starvation causes activation of the Sty1- dependent stress response pathway, which activates antioxidant production and increases resistance to stresses [25].
T. Pluskal et al.
Fission yeast division under glucose starvation
change cells did not
limitation. A protein kinase Ssp1, similar to calcium– calmodulin-dependent protein kinase kinase, may be implicated in this control, as ssp1 mutant cells are elongated under limited glucose concentrations [30]. A systematic genetic screen was performed to isolate a number of mutants that were unable to support cell division below 4.4 mm glucose concentration, and more than 100 mutant genes were identified. These genes were mostly conserved in eukaryotes (S. Saitoh et al., unpublished results).
(111 mm), concentrations
We further tested whether mutations, such as those resistant to camptothecin (CPT, an inhibitor of DNA topoisomerase) [26], arise frequently in cells under glu- cose starvation or fasting conditions. The number of significantly CPT-resistant (Fig. 7D): 3.3–3.7 per 106 cells in 111 mm glucose and 3.0–3.5 per 106 cells in 0 mm glucose for 6 or 12 h. Similar results were obtained in cells in 1.1–4.4 mm glucose. We also tested the loss of minichromosomes using the CN2 strain [27], and found that cell division under 4.4 or 2.2 mm glucose did not affect the rate of chromosome loss compared with 111 mm glucose (Fig. 7E). Finally, we examined whether the yellow fluorescent protein (YFP) signals of the DNA strand break-sensitive protein Rad22 tagged with YFP formed frequent foci under starvation or fasting condi- in Rad22 foci was increase tions. No dramatic observed (Fig. 7F; cells displaying foci are indicated by red arrows).
Discussion
In humans,
remains It
The regularity of cell division timing seemed to be disrupted under glucose starvation, and the critical transition for division and quiescence occurred between the severe diet (2.2 mm) and substarvation (1.7 mm) conditions. Based on the cellular and meta- bolic phenotypes obtained, we named the different glu- regular excess cose (11.1 mm), diet (4.4 mm), severe diet (2.2 mm), substar- vation (1.7 mm), starvation (1.1 mm) and fasting (0 mm), as summarized in Fig. 7G. These terminolo- gies for S. pombe bear some resemblance to the termi- nology used for human blood sugar content, but we do not intend to imply that they have any direct rela- tionship. The terminologies for S. pombe should be restricted to use only for the nutritional conditions of S. pombe. symptoms of hypoglycemia develop at 2.7 mm blood glucose, and seizures may occur as glucose falls to 1.7 mm. These concentrations correspond to the S. pombe terminologies of severe diet and substarvation, respectively. When blood glu- cose levels fall below 0.5 mm, human neurons are no longer functional, resulting in coma. In S. pombe, cell division is mostly arrested, but it does not lose viability in 1.1 mm glucose. to be determined whether very rapid responses and changes in important metabolites in S. pombe after the change in glucose concentrations have any parallel to the events that occur in human body cells.
Schizosaccharomyces pombe is widely distributed on Earth [28,29] and natural isolates were obtained from including millet beer (pombe a variety of substrates, means beer in Swahili). Its natural, ecological environ- ment, however, is little known. Its actual living condi- tions in nature, particularly with regard to nutritional conditions, may be very diverse, from harsh conditions that would cause the arrest of cell division, to rich con- ditions that could support the cycles of rapid cell divi- sion. It is unknown what nutritional conditions are ‘optimum’ for this organism in nature. We were thus interested in how S. pombe responded to the culture conditions of limited glucose, and initiated the present study to analyze the division patterns under a series of glucose concentrations. For this analysis, we employed a microfluidic perfusion system, which ensured the constant supply of fresh medium in the microscope chamber. glucose
seem to be optimal
FEBS Journal 278 (2011) 1299–1315 ª 2011 The Authors Journal compilation ª 2011 FEBS
1310
We were able to identify metabolic biomarkers for different such as biotin concentrations, (excess), ergothioneine (diet), SAM (starvation) and CDP-choline (fasting). The identification of marker metabolites up- or down-regulated in a particular cel- lular condition may indicate which pathways play an important role in the maintenance of S. pombe cells in that glucose condition, and assist in the characteriza- tion of other conditions in future research by compar- ing their levels. High-energy phosphate compounds might represent metabolic markers for healthy viable cells, even under severe starvation. Their rapid decay was only observed in cells after an abrupt shift to glucose fasting. The phospholipid-related CDP com- pounds dramatically increased under the 0 mm glucose An initial finding of the present study, that the dou- bling time of S. pombe was identical between 111 and 4.4 mm glucose, was surprising. Judging from the iden- tical doubling time, these very different glucose con- for S. pombe cell centrations division. We therefore assumed that S. pombe may be used as a model of mammalian body cells that take up glucose from blood: 4.4 mm glucose is a pre-breakfast level in human blood. The reduction in cell size might at least partly explain the short doubling time in low glucose. The 33% reduction in cell length might reduce the duration of the cell division cycle. The size control for mitotic entry might thus be altered under glucose
T. Pluskal et al.
Fission yeast division under glucose starvation
to create membranous
condition. The reason for the increase in these com- pounds remains to be clarified: one possible reason is a cellular attempt structures under the fasting condition. Alternatively, the conver- sion from the precursors to phospholipids may be blocked in the fasting condition. In any case, CDP- choline and CDP-ethanolamine are not death marker compounds, as glucose-fasted cells at the time of their sharp increase were fully viable. growing S. pombe cells under excess glucose content, diminished in short-sized cells under diet and starva- tion, and was virtually absent in the growth-arrested fasting condition. Biotin is a vitamin bound to various carboxylases, including key enzymes such as pyruvate carboxylase and acetyl-CoA carboxylase, which con- trol sugar and fatty acid metabolism [38]. The level of biotin might correlate in a certain way with the cellular ability to utilize sugar and fatty acid.
threshold activity
Previously, we have reported two genes that are required to properly utilize the diet glucose level (4.4 mm), but are not needed under excess glucose con- ditions. They encode Ssp1 kinase (homolog of cal- cium–calmodulin-dependent protein kinase kinase) and Sds23 (an inhibitor of type 2A-related protein phos- phatases including Ppe1) [30]. Ssp1 and Sds23 are functionally closely related as the phenotype of ssp1 kinase mutants was suppressed by the increased gene dosage of Sds23, and vice versa. Glucose consumption was decreased significantly in these mutants, suggesting that the import or actual consumption of glucose might be impaired. Ssp1 kinase is involved in the G2 ⁄ M transition [39], so that glucose metabolism may be related to cell cycle regulation. In humans, calcium– calmodulin-dependent protein kinase kinase has a role in utilizing glucose through interaction with AMP- dependent protein kinase [40], which is implicated in diabetes [41]. In S. pombe, Ssp2 is the AMP-dependent protein kinase, and Ssp1 and Ssp2, whose mutants show similar phenotypes, interact closely [30,39]. Trehalose protects proteins and membranes from inactivation or denaturation [31]. In S. pombe, treha- lose is produced under various physiologic stresses [32]. Ergothioneine, an antioxidant, increased, possibly as a result of the activation of mitochondria that pro- duce oxidative stress [33]. It increased in the 4.4 mm diet condition, when the doubling time was 3.5 h, simi- lar to that in excess glucose, suggesting that diet cells might be under oxidative stress, although the rate of cell division was the most rapid. Ergothioneine in humans has been reported to act as an antioxidant compound with a role against inflammation, impli- cated in rheumatoid arthritis and Crohn’s disease [34]. Ergothioneine is present in human blood, and is con- sidered to be important for the protection of mito- chondrial glucose [35]. The concentration (5.6 mm) for the production of trehalose and ergothioneine in S. pombe may coincide with the intensified generation of oxidative stress by mitochon- dria and other cells. Starvation might produce highly these protective cells by increasing the levels of compounds.
There is no obvious explanation why SAM increased under severe diet and starvation conditions. Methyla- tion might play an important role in cells under low glu- cose. It is possible that the increase in methylation, such as for histones [36], might diminish gene transcription, which would cause slow division or quiescence. Further study is necessary. Fructose-1,6-phosphate decreased strongly under glucose starvation, possibly as a result of the increase in fructose-1,6-diphosphatase enzyme under glucose limitation [37]. Fructose-1,6-diphosphatase is a well-known glucose-repressing enzyme, and catalyzes fructose-1,6-diphosphate to fructose-6-phosphate. The level of fructose-6-phosphate was still high under the 4.4 and 2.2 mm glucose conditions. Fructose-1,6- diphosphate may be considered as a decreasing marker metabolite under diet and starvation conditions, which is consistent with the large increase in fructose-1,6-di- phosphatase.
FEBS Journal 278 (2011) 1299–1315 ª 2011 The Authors Journal compilation ª 2011 FEBS
1311
Biotin, a vitamin that represents the activity of sugar, fatty acid and amino acid metabolism, was a unique marker metabolite for growth (cell size) and division. It was found to be abundant in maximally Schizosaccharomyces pombe responds very differently to nitrogen and glucose starvation [19]. In the absence of a nitrogen source, cells undergo meiosis if a sexual partner cell is nearby. If not, cells become completely arrested after two rounds of cell division without cell growth, and the resulting small, round cells remain viable for months, as they possess the ability to reuse intracellular nitrogen [42]. The nitrogen source-starved quiescent G0 cells contain prereplicative 1C DNA, are efficient in DNA damage repair and active in various metabolic cellular pathways [43]. On replenishment of the nitrogen source, cells undergo the first mitosis after cell growth and DNA replication. In glucose fasting, however, S. pombe immediately stops cell division and loses viability within 32 h. These glucose-fasting arrested cells are rod-shaped and contain postreplica- tive 2C chromosomal DNA (S. pombe growing cells are mostly in the G2 phase). They are not a typical form of quiescence as they are devoid of ATP and lose their viability fairly quickly. However, cells subjected to glucose fasting after starvation pretreatment contain a high level of ATP and show more than a 10-fold lifespan. Hence, these increase in the chronological
T. Pluskal et al.
Fission yeast division under glucose starvation
foci. The CN2 strain carrying an artificial linear minichro- mosome, Ch10 (sup3-5), in the ade6-704 background [27] was used for the minichromosome loss assay, and mis6-302 [46,47] strain was used as the control.
Cells were cultivated in 111 mm glucose medium to mid- logarithmic phase (5 · 106 cellsÆmL)1), and then placed in 4.4 mm glucose or 111 mm glucose (control) medium at a concentration of 2 · 106 cellsÆmL)1 after washing. Samples of 500 lL were taken at each time point to measure the concentrations of cells and glucose. The glucose concentra- tion was determined using the Glucose (HK) assay kit (Sigma-Aldrich, St. Louis, MO, USA), following the manu- facturer’s instructions.
Culture glucose measurement
glucose-fasting quiescent cells after starvation pretreat- ment are worth investigating in detail. In these long-lived quiescent cells, high-energy compounds and anti-stress compounds are abundant. Starvation pre- treatment might produce highly protective cells by increasing the levels of stress-responsive compounds, together with a large increase in protective compounds, such as trehalose. The high levels of nucleotide tri- phosphates and other high-energy compounds may not be sufficient to explain why cells pretreated with 1.1 mm glucose were able to live so long. Additional properties, such as stress resistance and stress protec- tion, might be equally or more important for their lon- gevity. It should be noted that our results also indicate that the loss of viability as a result of DNA damage was negligible under fasting or starvation conditions.
Cells were cultivated in 111 mm glucose medium to loga- rithmic phase (2 · 106 cellsÆmL)1), and then fixed in a microscopic specimen chamber that was continuously sup- plied with culture medium (Onix(cid:3) Microfluidic Perfusion System) at a flow rate of 3 lLÆh)1. The temperature in the room was set to 26 (cid:2)C. Following the medium change to 111 (control), 11.1, 4.4, 2.2, 1.7, 1.1 or 0 mm glucose med- ium, photographs were taken every 3 min using a Delta- Vision microscope system (Applied Precision), and movies were created from the photographs. The cell length was measured using Adobe Photoshop from the micrographs. Microscopic observation was repeated three times with similar results.
Microscopy and movies
Viability measurement differences. Glucose
Cell viability was measured by plating 300 cells on a YPD (1% yeast extract, 2% polypeptone and 2% glucose) agar plate, incubating the plate at 26 (cid:2)C for several days, and counting the number of colonies formed. Viability was cal- culated as the percentage of the number of formed colonies against 300.
Variations in the mode of cell division became apparent under diet glucose conditions. Division tim- ing and symmetry seemed to become less uniform under limited glucose, suggesting that unknown factors related to nutrition affect the uniformity of division. The irregularities of division may be understood if we assume that nutrition is insufficient or in short supply. We asked the question of what was actually inherited from mother to daughter to keep the generation time the same under low glucose. We speculate that the ‘inheritance’ of nongenetic materials or epigenetic properties from the mother cells influences the dou- bling time of daughters for a few generations. The sto- chastic switching between proliferation and quiescence might be a result of variations in the abundance of organelles or the degree of cellular aging, or epigenetic differences caused by various metabolic and cellular starvation might structural enhance such differences. In other words, the evolution of S. pombe may occur more rapidly under diet to starvation conditions, as cellular variations were more prominent than in glucose-rich medium.
Materials and methods
Samples were prepared as described previously [23]. Cells from cultures (40 mL per sample, 5 · 106 cellsÆmL)1) were collected by vacuum filtration and immediately quenched in –40 (cid:2)C methanol. Cells were harvested by centrifugation and constant amounts of internal standards (10 nmol of HEPES and PIPES) were added to each sample. Cells were disrupted using a Multi-Beads Shocker (Yasui Kikai, Osaka, Japan) in 500 lL of 50% methanol. Proteins were removed by filtering on an Amicon Ultra 10-kDa cut-off filter (Millipore, Billerica, MA, USA) and samples were
The wild-type heterothallic haploid 972 h) S. pombe strain [44] was used for the metabolomic and viability experi- ments. Cells were cultivated in minimal synthetic medium EMM2 [5,7] with modified glucose content. Limited glucose media were prepared by mixing regular EMM2 (2% glu- cose) medium with EMM2-G (0% glucose) in the appropri- ate ratio. The cultivation temperature was 26 (cid:2)C unless otherwise stated. A haploid h+ rad22-YFP:KanR strain, obtained by back-crossing the EN3222 strain [45] with a wild-type 975 h+ strain, was used to observe the Rad22
FEBS Journal 278 (2011) 1299–1315 ª 2011 The Authors Journal compilation ª 2011 FEBS
1312
Sample preparation for metabolomic analysis Strains and growth conditions
T. Pluskal et al.
Fission yeast division under glucose starvation
concentrated by vacuum evaporation. Finally, each sample was resuspended in 20 lL of 50% acetonitrile and 1 lL was used for autosampler injection.
ium supplemented with leucine and adenine. Following growth for 10 or 20 generation times at 26 (cid:2)C, cells were plated on YPD plates and incubated at 26 (cid:2)C. Total colo- nies and red colonies were counted, and the percentage mitotic loss rates were calculated as described previously [50].
LC-MS analysis
Rad22-YFP strain was used to observe Rad22 foci as described previously [45]. Cells were fixed by methanol ()80 (cid:2)C), washed three times in NaCl ⁄ Pi buffer, and kept on ice prior to observation. Images were obtained using a DeltaVision microscope (Applied Precision). Ten z-axis sec- tions at 0.3-lm intervals were scanned and projected on a two-dimensional plot.
Rad22 foci observation
Acknowledgements
LC-MS data were obtained using a Paradigm MS4 HPLC system (Michrom Bioresources, Auburn, CA, USA) cou- pled to an LTQ Orbitrap mass spectrometer (Thermo Fisher Scientific, Waltham, MA, USA). LC separation was performed on a ZIC-pHILIC column (Merck SeQuant, Umea˚ , Sweden; 150 mm · 2.1 mm, 5 lm particle size). Ace- tonitrile (A) and 10 mm ammonium carbonate buffer, pH 9.3 (B) were used as the mobile phase, with gradient elution from 80% A to 20% A in 30 min, at a flow rate of 100 lLÆmin)1. The peak areas of the metabolites of interest were measured using MZmine 2 software [48] and normal- ized by the peak areas of the spiked internal standards. Detailed data analysis procedures and parameters have been described previously [23].
Oxidative stress staining
We acknowledge the generous support of the Okinawa Institute of Science and Technology Promotion Corpo- ration. This work was partly supported by a CREST grant from the Japan Science and Technology Corpo- ration (JST). We would like to thank P. Russell for providing the Rad22-YFP strain, E. Lopez for techni- cal assistance and R. Sinclair for consultation regard- ing statistical hypothesis testing.
References
The procedure described previously [49] was followed. Cells were incubated with H2DCFDA dye (Invitrogen, Carlsbad, CA, USA; final concentration 10 lgÆmL)1) for 80 min in the absence of light, and then washed twice with 50 mm sodium citrate (pH 7.0) and kept on ice until observation. Images were obtained using an AxioPlan 2 (Carl Zeiss AG, Oberkochen, Germany) microscope.
1 Saltiel AR & Kahn CR (2001) Insulin signalling and
the regulation of glucose and lipid metabolism. Nature 414, 799–806.
2 Le T, Bhushan V & Vasan N (2010) First Aid for
the USMLE Step 1, 20 edn. McGraw-Hill Medical, New York City.
A 4 m stock solution of H2O2 was prepared in H2O. Cells were cultivated in excess (111 mm), starvation (1.1 mm) and fasting (0 mm) glucose conditions for 6 h (3 · 106 cellsÆmL)1), followed by the addition of H2O2 to a final concentration of 40 mm, as described previously [24]. Viabil- ity in the presence and absence of H2O2 was measured for 1 h in 20-min intervals (see Viability measurement section).
3 Nathan DM, Davidson MB, DeFronzo RA, Heine RJ, Henry RR, Pratley R & Zinman B (2007) Impaired fasting glucose and impaired glucose tolerance – impli- cations for care. Diabetes Care 30, 753–759.
4 Leupold U (1970) Genetical methods for Schizosacchar-
H2O2 resistance assay
omyces pombe. Methods Cell Physiol 4, 177. 5 Mitchison J (1970) Physiological and cytological
methods for Schizosaccharomyces pombe. Methods Cell Physiol 4, 60.
6 Egel R (2004) The Molecular Biology of Schizosacchar-
omyces pombe: Genetics, Genomics and Beyond. Springer, Berlin, Heidelberg.
Cells were incubated for 6–12 h in low-glucose medium at 26 (cid:2)C, and then incubated for 18 h in 111 mm glucose med- ium at 26 (cid:2)C. After the cell number had increased over 10-fold, cells were plated on YPD plates with or without 25 lm CPT. After incubation at 36 (cid:2)C for several days, the number of colonies was counted.
7 Nurse P (1975) Genetic control of cell size at cell divi-
sion in yeast. Nature 256, 547–551.
8 Yamamoto M (1996) Regulation of meiosis in fission
CPT resistance assay
yeast. Cell Struct Funct 21, 431–436.
9 Hagan I (1998) The fission yeast microtubule cytoskele-
CN2 cells [27] were cultured in EMM2 medium supple- mented with leucine, and then diluted in low-glucose med-
ton. J Cell Sci 111, 1603.
FEBS Journal 278 (2011) 1299–1315 ª 2011 The Authors Journal compilation ª 2011 FEBS
1313
Minichromosome loss assay
T. Pluskal et al.
Fission yeast division under glucose starvation
10 Yanagida M (2005) Basic mechanism of eukaryotic
26 Eng WK, Faucette L, Johnson RK & Sternglanz R
chromosome segregation. Philos Trans R Soc B Biol Sci 360, 609.
11 Rowley R, Hudson J & Young PG (1992) The wee1
(1988) Evidence that DNA topoisomerase I is necessary for the cytotoxic effects of camptothecin. Mol Pharma- col 34, 755–760.
protein kinase is required for radiation-induced mitotic delay. Nature 356, 353–355.
12 Kelly TJ, Martin GS, Forsburg SL, Stephen RJ, Russo A & Nurse P (1993) The fission yeast cdc18+ gene product couples S phase to START and mitosis. Cell 74, 371–382.
13 Bahler J (2005) A transcriptional pathway for cell sepa-
27 Niwa O, Matsumoto T, Chikashige Y & Yanagida M (1989) Characterization of Schizosaccharomyces pombe minichromosome deletion derivatives and a functional allocation of their centromere. EMBO J 8, 3045–3052. 28 Schlake T & Gutz H (1993) Mating configurations in Schizosaccharomyces pombe strains of different geo- graphical origins. Curr Genet 23, 108–114.
29 Patch AM & Aves SJ (2007) Fingerprinting fission
ration in fission yeast. Cell Cycle 4, 39–41.
14 Grewal SI (2000) Transcriptional silencing in fission
yeast. J Cell Physiol 184, 311–318.
yeast: polymorphic markers for molecular genetic analy- sis of Schizosaccharomyces pombe strains. Microbiology 153, 887–897.
15 Schafer B (2003) Genetic conservation versus variability in mitochondria: the architecture of the mitochondrial genome in the petite-negative yeast Schizosaccharomyces pombe. Curr Genet 43, 311–326.
30 Hanyu Y, Imai KK, Kawasaki Y, Nakamura T, Nak- aseko Y, Nagao K, Kokubu A, Ebe M, Fujisawa A, Hayashi T et al. (2009) Schizosaccharomyces pombe cell division cycle under limited glucose requires Ssp1 kinase, the putative CaMKK, and Sds23, a PP2A- related phosphatase inhibitor. Genes Cells 14, 539–554.
31 Elbein AD, Pan YT, Pastuszak I & Carroll D (2003)
16 Takegawa K, Iwaki T, Fujita Y, Morita T, Hosomi A & Tanaka N (2003) Vesicle-mediated protein transport pathways to the vacuole in Schizosaccharomyces pombe. Cell Struct Funct 28, 399–417.
New insights on trehalose: a multifunctional molecule. Glycobiology 13, 17R–27R.
32 Cansado J, Vicente-Soler J, Soto T, Fernandez J &
17 Jourdain I, Sontam D, Johnson C, Dillies C & Hyams JS (2008) Dynamin-dependent biogenesis, cell cycle reg- ulation and mitochondrial association of peroxisomes in fission yeast. Traffic 9, 353–365.
18 Roux AE, Chartrand P, Ferbeyre G & Rokeach LA
Gacto M (1998) Trehalose-6P synthase is essential for trehalase activation triggered by glucose, nitrogen source or heat shock, but not by osmostress, in Schizo- saccharomyces pombe. Biochim Biophys Acta 1381, 271– 278.
(2010) Fission yeast and other yeasts as emergent mod- els to unravel cellular aging in eukaryotes. J Gerontol A Biol Sci Med Sci 65, 1–8.
33 Wallace DC (1999) Mitochondrial diseases in man and
19 Yanagida M (2009) Cellular quiescence: are controlling
mouse. Science 283, 1482–1488.
34 Grundemann D, Harlfinger S, Golz S, Geerts A, Lazar A, Berkels R, Jung N, Rubbert A & Schomig E (2005) Discovery of the ergothioneine transporter. Proc Natl Acad Sci USA 102, 5256–5261.
genes conserved? Trends Cell Biol 19, 705–715. 20 Roux AE, Leroux A, Alaamery MA, Hoffman CS, Chartrand P, Ferbeyre G & Rokeach LA (2009) Pro-aging effects of glucose signaling through a G protein-coupled glucose receptor in fission yeast. PLoS Genet 5, e1000408.
35 Paul BD & Snyder SH (2009) The unusual amino acid L-ergothioneine is a physiologic cytoprotectant. Cell Death Differ 17, 1134–1140.
21 Madigan M, Martinko J, Dunlap P & Clark D (2008) Brock Biology of Microorganisms, 12th edn. Benjamin Cummings, Town.
22 Dulbecco R & Freeman G (1959) Plaque production by
36 Grewal SI & Rice JC (2004) Regulation of heterochro- matin by histone methylation and small RNAs. Curr Opin Cell Biol 16, 230–238.
the polyoma virus. Virology 8, 396.
23 Pluskal T, Nakamura T, Villar-Briones A &
37 Vassarotti A & Friesen JD (1985) Isolation of the fruc- tose-1,6-bisphosphatase gene of the yeast Schizosacchar- omyces pombe. Evidence for transcriptional regulation. J Biol Chem 260, 6348–6353.
38 Pacheco-Alvarez D, Solorzano-Vargas RS & Del Rio
Yanagida M (2010) Metabolic profiling of the fission yeast S. pombe: quantification of compounds under different temperatures and genetic perturbation. Mol Biosyst 6, 182–198.
24 Lee J, Dawes IW & Roe JH (1995) Adaptive
AL (2002) Biotin in metabolism and its relationship to human disease. Arch Med Res 33, 439–447.
response of Schizosaccharomyces pombe to hydrogen peroxide and menadione. Microbiology 141(Pt 12), 3127–3132.
39 Matsusaka T, Hirata D, Yanagida M & Toda T (1995) A novel protein kinase gene ssp1+ is required for alter- ation of growth polarity and actin localization in fission yeast. EMBO J 14, 3325–3338.
40 Witczak CA, Sharoff CG & Goodyear LJ (2008)
AMP-activated protein kinase in skeletal muscle: from
25 Zuin A, Carmona M, Morales-Ivorra I, Gabrielli N, Vivancos AP, Ayte J & Hidalgo E (2010) Lifespan extension by calorie restriction relies on the Sty1 MAP kinase stress pathway. EMBO J 29, 981–991.
FEBS Journal 278 (2011) 1299–1315 ª 2011 The Authors Journal compilation ª 2011 FEBS
1314
T. Pluskal et al.
Fission yeast division under glucose starvation
Supporting information
structure and localization to its role as a master regu- lator of cellular metabolism. Cell Mol Life Sci 65, 3737–3755.
41 Zhang BB, Zhou G & Li C (2009) AMPK: an emerging drug target for diabetes and the metabolic syndrome. Cell Metab 9, 407–416.
42 Sajiki K, Hatanaka M, Nakamura T, Takeda K, Shimanuki M, Yoshida T, Hanyu Y, Hayashi T, Nakaseko Y & Yanagida M (2009) Genetic control of cellular quiescence in S. pombe. J Cell Sci 122, 1418–1429.
43 Mochida S & Yanagida M (2006) Distinct modes of
DNA damage response in S. pombe G0 and vegetative cells. Genes Cells 11, 13–27.
44 Gutz H, Heslot H, Leupold U & Loprieno N (1974)
Schizosaccharomyces pombe. Handb Genet 1, 395–446. 45 Noguchi E, Noguchi C, McDonald WH, Yates JR III
& Russell P (2004) Swi1 and Swi3 are components of a replication fork protection complex in fission yeast. Mol Cell Biol 24, 8342–8355.
46 Takahashi K, Yamada H & Yanagida M (1994) Fission yeast minichromosome loss mutants mis cause lethal aneuploidy and replication abnormality. Mol Biol Cell, 5, 1145–1158.
47 Saitoh S, Takahashi K & Yanagida M (1997) Mis6, a
fission yeast inner centromere protein, acts during G1 ⁄ S and forms specialized chromatin required for equal seg- regation. Cell 90, 131–143.
48 Pluskal T, Castillo S, Villar-Briones A & Oresic M
(2010) MZmine 2: modular framework for processing, visualizing, and analyzing mass spectrometry-based molecular profile data. BMC Bioinformatics 11, 395. 49 Marchetti MA, Weinberger M, Murakami Y, Burhans
WC & Huberman JA (2006) Production of reactive oxy- gen species in response to replication stress and inap- propriate mitosis in fission yeast. J Cell Sci 119, 124– 131.
The following supplementary material is available: Fig. S1. Cell behavior of S. pombe under limited glu- cose concentrations at 30 (cid:2)C. Table S1. Metabolic compounds from cell extracts obtained from S. pombe cells cultured in synthetic medium EMM2 containing 111, 22.2, 16.7, 11.1, 5.6, 4.4, 2.2, 1.7, 1.1 or 0 mm glucose for 6 h at 26 (cid:2)C. Table S2. Time course change in peak areas of metab- olites under glucose fasting. Table S3. Time course change in peak areas of metab- olites under glucose starvation. Movie S1. Cells after shifting to the ‘fasting’ condition (0 mm glucose). Movie S2. Cells after shifting to the ‘starvation’ condi- tion (1.1 mm glucose). Movie S3. Cells after shifting to the ‘substarvation’ condition (1.7 mm glucose). Movie S4. Cells after shifting to the ‘severe diet’ condi- tion (2.2 mm glucose). Movie S5. Cells after shifting to the ‘diet’ condition (4.4 mm glucose). Movie S6. Cells after shifting to the ‘regular’ glucose condition (11.1 mm glucose). Movie S7. Cells grown in culture containing ‘excess’ (111 mm) glucose. This supplementary material can be found in the online version of this article.
50 Murray AW & Szostak JW (1983) Pedigree analysis of
plasmid segregation in yeast. Cell 34, 961–970.
FEBS Journal 278 (2011) 1299–1315 ª 2011 The Authors Journal compilation ª 2011 FEBS
1315
Please note: As a service to our authors and readers, this journal provides supporting information supplied by the authors. Such materials are peer-reviewed and may be re-organized for online delivery, but are not copy-edited or typeset. Technical support issues arising from supporting information (other than missing files) should be addressed to the authors.