REGULAR ARTICLE
Dose and temperature distribution in spent fuel containing
material
Ladislav Viererbl
1,*
, Zdena Lahodová
1
, Jelena Zmítková
1
, Miroslav Vinš
1
, and JiříŠrank
2
1
Research Centre Řež, Ltd., Hlavní 130, 250 68 Řežnear Prague, Czech Republic
2
UJV Řež, a.s., Hlavní 130, 250 68 Řežnear Prague, Czech Republic
Received: 13 October 2015 / Accepted: 31 May 2016
Abstract. Spent fuel containing material (SFCM) can arise during severe nuclear reactor accident by melting of
a reactor core and surrounding material (corium) or during accident in spent fuel storage. It consists of nuclear
fuel, ssion products, activation products and materials from fuel cladding, concrete, etc. The paper deals with
dose and temperature characteristics inside the SFCM after transition of the molten mixture to solid state.
Calculations were made on simplied spherical models, without connection to some specic nuclear accident. The
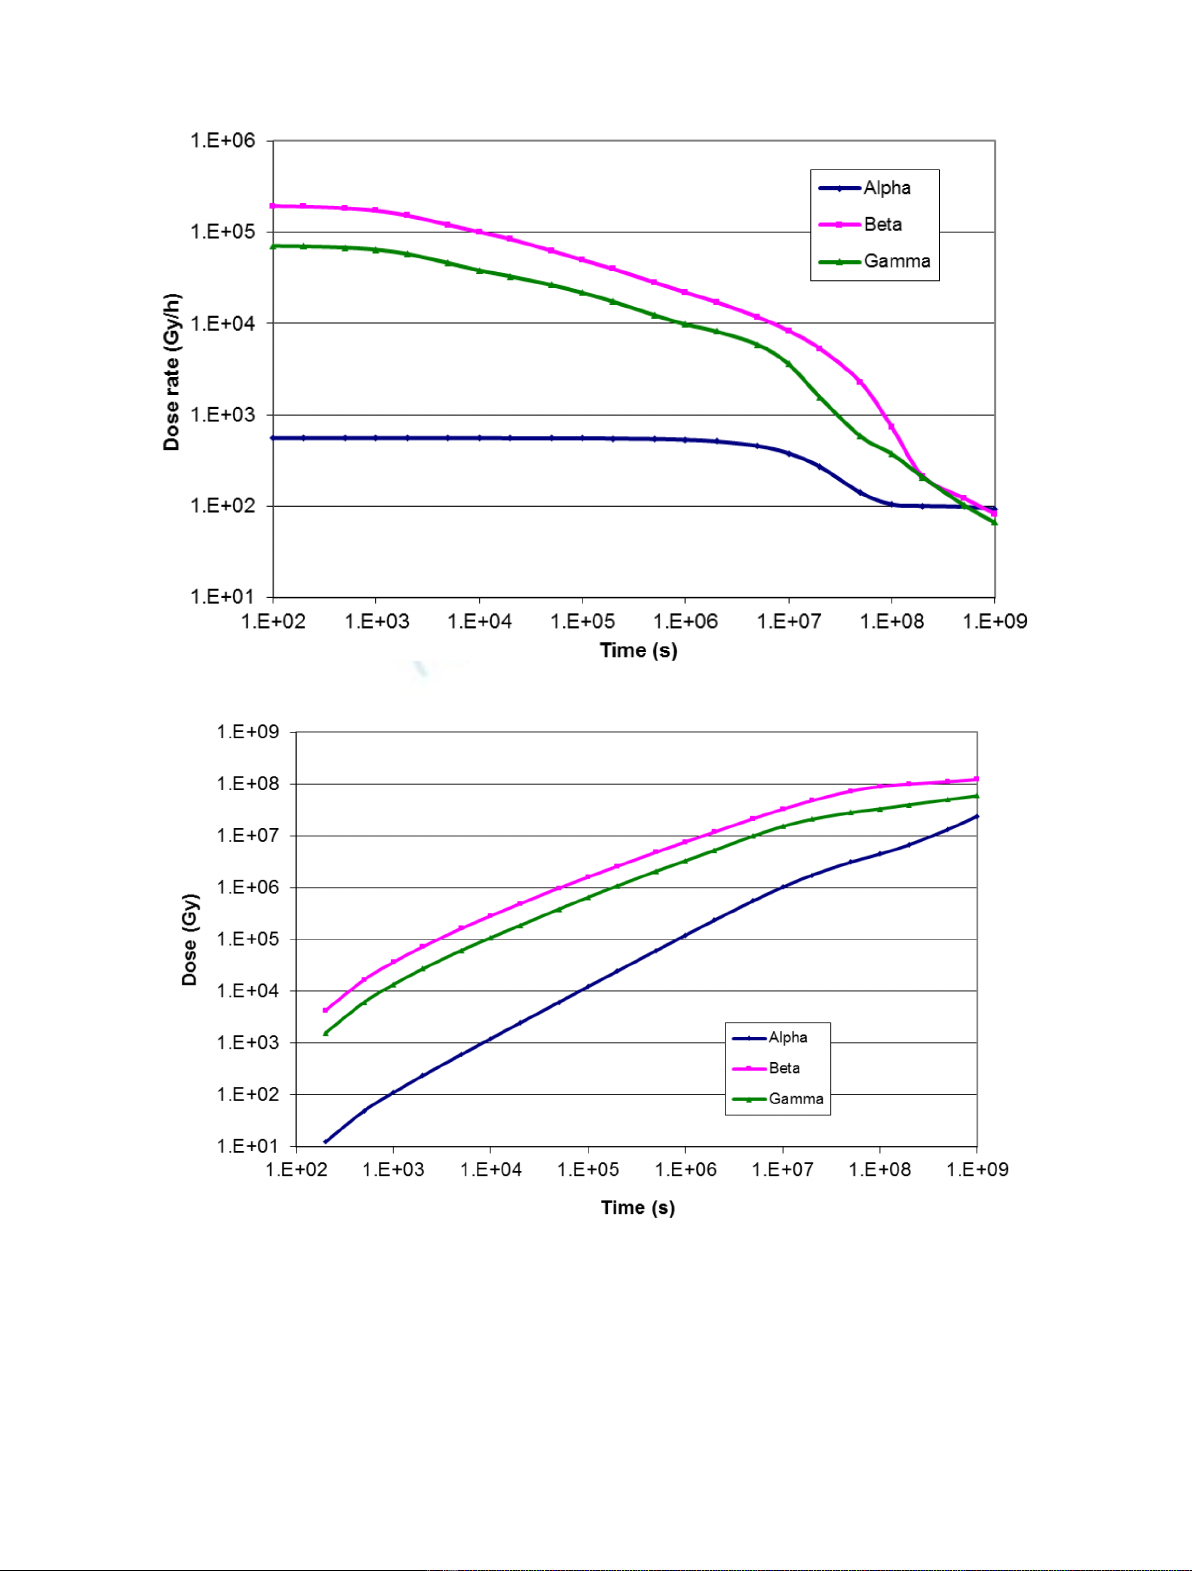
dose rate was estimated for alpha, beta and gamma radiation in times over the course of 30 years from the end of
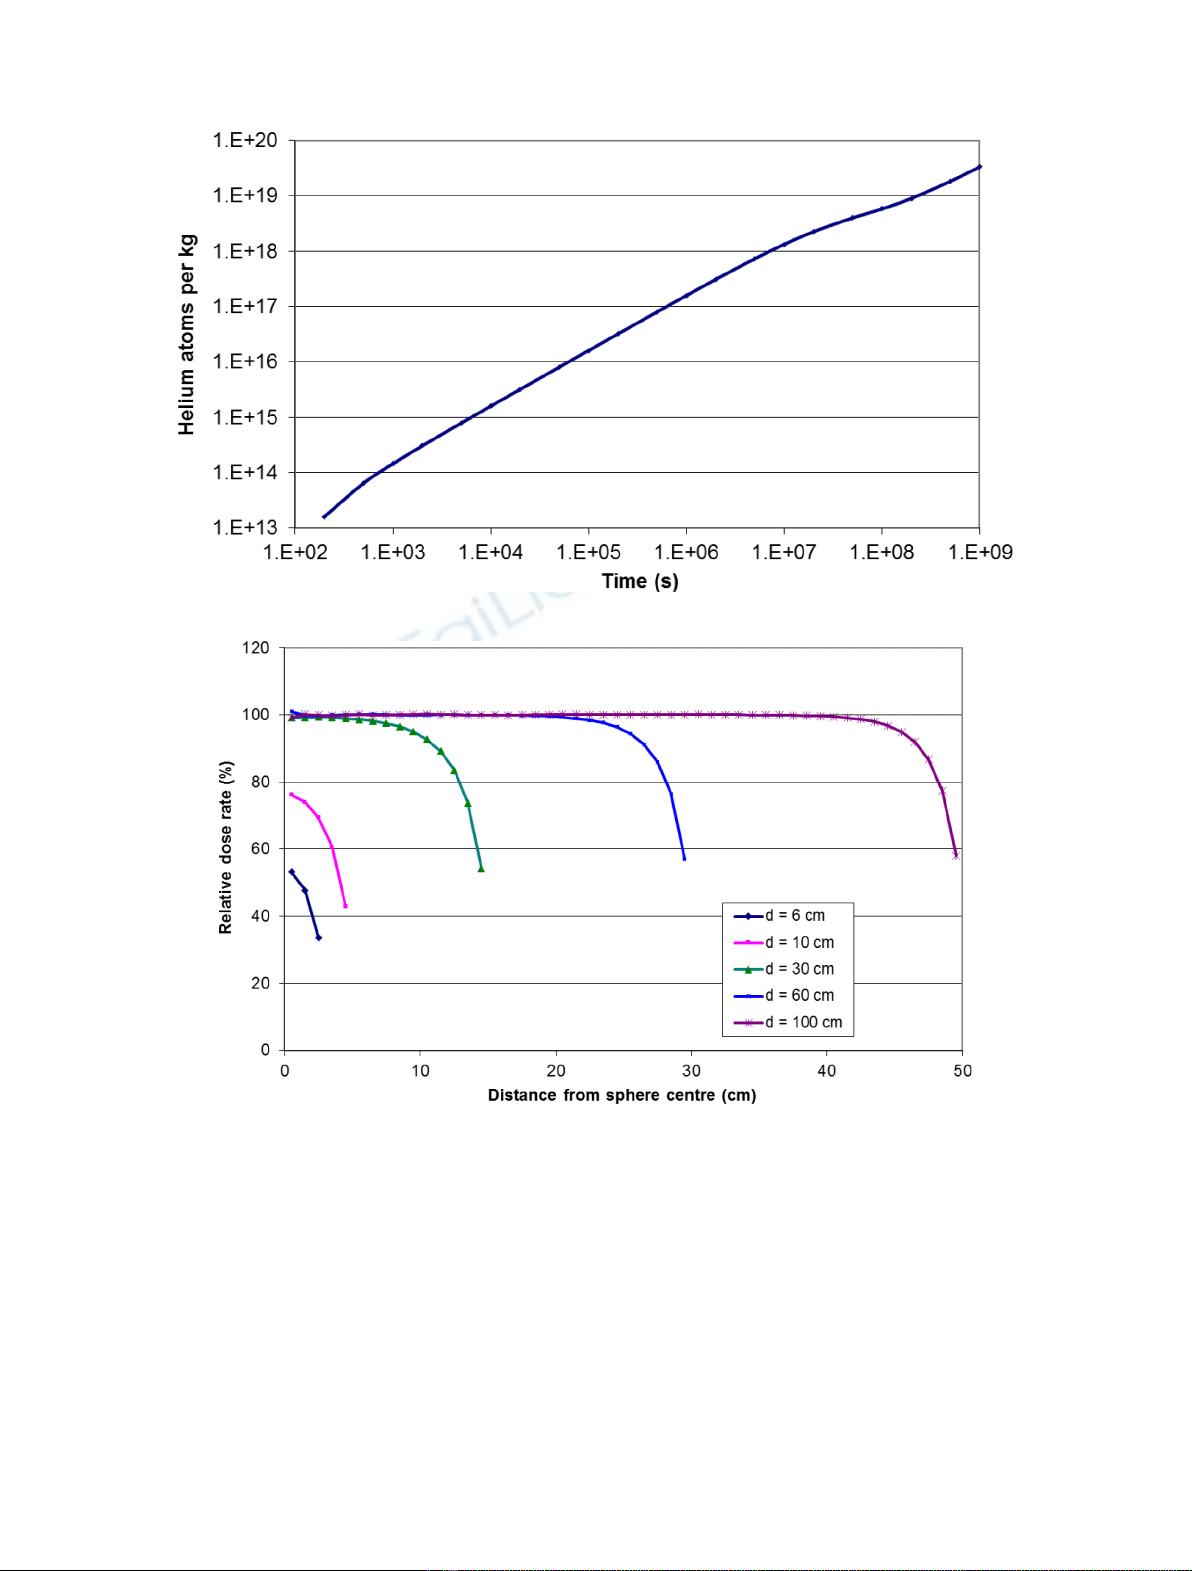
the ssion chain reaction. Concentration of helium generated in the material by alpha decay was calculated. For
the dose rate values estimation, computation code ORIGEN 2.2 with dosimetric library ENDF/B-IV were used.
Temperature distribution inside the solid SFCM was calculated by FLUENT code. As source of heating, energy of
radioactive decays was taken. Estimated dose and temperature characteristics can be used, e.g. for evaluation of
radiation damage and temperature behaviour of SFCM or for radiation test design of corium simulating
materials.
1 Introduction
Spent fuel containing material (SFCM) can arise during
severe nuclear reactor accident by melting of a reactor core
and surrounding material (it is called corium in this case) or
during accident in spent fuel storage. It consists of nuclear
fuel, ssion products, activation products and materials
from fuel control rods, fuel cladding, concrete and other
structural material [1]. Other compounds arise from
products of their chemical reaction with air and water.
The molten reactor core can release volatile elements and
compounds. After a reactor or spent fuel storage accident,
SFCM remains in a molten phase for some time, mainly due
to ssion products decay heating. When this heating
decreases and/or cooling is applied, the SFCM changes to a
solid state. The composition of SFCM at the time of
solidication depends on reactor type, the nature of the
accident, and many other factors.
This paper deals with dose characteristics inside the
SFCM after transition of the molten mixture to a solid
state. For calculations, simplied models of SFCM were
used. The purpose of the calculation is not to describe
some specic nuclear accident but estimated dose and
temperature characteristics can be used, e.g. for evalua-
tion of radiation damage and temperature behaviour of
SFCM or for radiation test design of corium simulating
materials [2].
2 Time dependence of dose rate and helium
generation in SFCM
2.1 Calculation model
In the real event, SFCM composition, shape and dimensions
could vary from case to case. For time dependence of dose
rate calculations, a simplied model with the following
assumptions was used:
the SFCM is homogenous;
the dose is equal to the decay energy (without neutrinos)
released in unit mass (more details in Sect. 3);
the dose rate is produced by alpha, beta and gamma
radiation (contributions for example from neutrons and
ssion fragments are neglected);
10% of SFCM mass is uranium with ssion and activation
products created during irradiation. Uranium enrichment
was 4.5% before ssion. The remaining 90% is some
passivematerial, e.g. Fe, SiO
2
. For this part of the
calculation, the precise content is not important;
* e-mail: ladislav.viererbl@cvrez.cz,vie@cvrez.cz
EPJ Nuclear Sci. Technol. 2, 31 (2016)
©L. Viererbl et al., published by EDP Sciences, 2016
DOI: 10.1051/epjn/2016024
Nuclear
Sciences
& Technologies
Available online at:
http://www.epj-n.org
This is an Open Access article distributed under the terms of the Creative Commons Attribution License (http://creativecommons.org/licenses/by/4.0),
which permits unrestricted use, distribution, and reproduction in any medium, provided the original work is properly cited.
uranium was irradiated in four reactor cycles per year as
follows: 25% of the uranium was irradiated with neutrons
for one year, 25% for two years, 25% for three years and
25% for four years. This corresponds to a situation where
every year 25% of the fuel is changed and the end of chain
ssion (time of accident) is end of a reactor cycle;
neutron uence and spectrum of irradiation agree with
PWR type reactors.
Dose rate, dose and helium production values are given
for 10% uranium content. For other content levels, the
values can be simply recalculated because in this simplied
model they are proportional to uranium content.
2.2 Radionuclide activities
For radionuclide activities estimation, computation code
ORIGEN 2.2 [3] with dosimetric library ENDF/B-IV was
used. ORIGEN is a computer code system for calculating
the build-up, decay, and processing of radioactive materi-
als. ORIGEN 2.2 is a revised version that incorporates
updates of reactor models, cross-sections, ssion product
yields, and decay data. This, not the newest version, was
chosen for his simplicity of result outputs and sufcient
precision for the given estimation.
Calculations were performed for 23 time points from 0 to
10
9
s (32 years) after end of chain ssion. Activities for
about 1000 ssion product radionuclides and 100 actinide
radionuclides were calculated using the assumptions in
Section 2.1. As an example, Table 1 provides a list of more
important radionuclides in SFCM.
2.3 Dose rate
For dose rate calculations, 89 ssion products and 17
actinide radionuclides were chosen. The selection was made
according to activities at different time points. Radio-
nuclides (elements) with a boiling point of less than 200 °C
were not used due to supposed evaporation.
For selected radionuclides, energy released per decay
was determined as the sum of products of Energy
Intensity of the lines for alpha, beta and/or gamma radiation
(including X-radiation) using NuDat [4] and Nucleonica [5]
databases. By multiplying by activity and summing over
selected radionuclides, nal dose rates were given (Fig. 1).
Absorbed doses can be obtained by integration of dose rates.
Doses were calculated from a time of 100 s after the end of
chain ssion (Fig. 2). From these values, doses for chosen
time interval can be obtained. For example, the total
absorbed dose from all radiation types from 10
4
sto10
8
s
(2.8 hours to 3.2 years) is equal to 1.5 10
8
Gy.
2.4 Helium production
Similarly as for dose rates, helium production was
calculated from the count rate of alpha particles generated
in alpha decays of actinides. Alpha particles make
consecutively helium atoms. The count rate has similar
shape as alpha dose rate. Integral count of helium atoms
generated in unit mass of SFCM is in Figure 3.
With similar calculation as for dose, e.g. from 10
4
sto
10
8
s number of helium atoms generated in 1 kg of SFCM
would be 6 10
18
atoms/kg.
The total uncertainty of the calculated values of dose
rates, doses and helium concentration was estimated to be
from 10 to 30%, depending on the type of radiation,
quantity, etc.
3 Spatial distribution of dose rate in SFCM
3.1 Calculation model
In Section 2 it was assumed that the dose is equal to the decay
energy released from a unit mass, i.e. released energy is in
equilibrium with absorbed energy. In other words, it was
assumed that the SFCM has innite dimensions. This is quite
true for the inner part of an object that is large in comparison
with the particle range in the material. For alpha particles,
the typical range is in tens of mm and for beta particle less
than one cm in SFCM. For gamma radiation, the typical
half-value shield thickness is a few cm depending on radiation
energy and SFCM composition. Gamma radiation is then
most interesting with regards to the spatial distribution of
dose rate. To illustrate this complex aspect, a few simple
model examples were calculated.
Simplied models with following the assumptions were
used for the calculations:
(a) the SFCM is homogenous;
(b) 10% of the mass is uranium and the remaining 90% is
SiO
2
;
(c) a spherical shape;
(d) the dose rate is produced by a homogenous mono-
energetic gamma radiation source.
Table 1. The most active ssion products and actinide
radionuclides ordered by mass activity for a time of 10
7
s
(116 days) after end of chain ssion in SFCM.
Fission products Actinides
Nuclide aNuclide a
(Bq/kg) (Bq/kg)
95
Nb 3.62E+12
241
Pu 4.20E+11
144
Pr 3.55E+12
242
Cm 7.99E+10
144
Ce 3.55E+12
244
Cm 1.38E+10
95
Zr 2.03E+12
238
Pu 1.35E+10
106
Rh 1.49E+12
240
Pu 1.72E+09
106
Ru 1.49E+12
239
Pu 1.30E+09
91
Y 1.37E+12
241
Am 6.13E+08
89
Sr 8.55E+11
243
Cm 7.94E+07
103
Ru 8.16E+11
239
Np 7.21E+07
103m
Rh 7.35E+11
242
Am 4.93E+07
134
Cs 6.26E+11
237
U 4.17E+07
141
Ce 6.00E+11
244
Am 8.56E+05
147
Pm 4.80E+11
244m
Am 3.49E+05
137
Cs 4.04E+11
238
Np 2.48E+05
90
Y 2.97E+11
2 L. Viererbl et al.: EPJ Nuclear Sci. Technol. 2, 31 (2016)
MCNP(X) [6] computer code with ENDF/B-VII.0
nuclear data library was used for calculation. The absorbed
dose was computed using Type 3 mesh mode (energy
absorption in volume) for spheres of diameters 6, 10, 30, 60,
and 100 cm. Source energies of 300 keV, 661 keV, and
3000 keV were also considered. These energies cover the
possible range of emission energies of real isotopes.
3.2 Results
Spatial distributions of relative dose rates in SFCM for
different energies and different diameters are shown in
Figures 4 and 5. Relative values are normalized to released
energy in a mass unit, i.e. 100% corresponds to values used
in Section 2.
Fig. 2. Time dependences of doses in SFCM calculated from time of 100 s after the end of chain ssion.
Fig. 1. Time dependences of dose rates for alpha, beta and gamma radiation in SFCM.
L. Viererbl et al.: EPJ Nuclear Sci. Technol. 2, 31 (2016) 3
The results conrm that assumption (b) in Section 2
(decay energy = absorbed energy) is a good approximation
for material dimensions above tens of centimetres even in
case of high gamma energies. Uncertainty of the calculated
values in this section for given assumptions was estimated to
be 5%.
4 Temperature distribution in the SFCM
4.1 Calculation model
To estimate the temperature eld inside the SFCM, a
simplied model was chosen with a homogenous spherical
shape. The energy source was radiation heating taken from
the dose rate calculation in Section 2. Perfect cooling was
presumed on the spheres surface. Geometry and calcula-
tion nets were created using GAMBIT 2.4.6 code, and
thermal calculations were performed using ANSYS FLU-
ENT 12 code [7] with some simplied assumptions.
A series of temperature distribution calculations in the
SFCM sphere was performed, where the four variable input
parameters were sphere surface temperature T
S
, sphere
radius R, specic heat Q, and SFCM material (the effect of
spent fuel with radionuclides in the SFCM on thermal
parameters was neglected). Table 2 shows the various
parameter values considered. Specic heat values were
derived from dose rates in the SFCM (see Sect. 2.2)at
different times after the end of the ssion chain reaction
Fig. 4. Spatial distribution of relative dose rate for gamma energy of 300 keV and different SFCM sphere diameters d.
Fig. 3. Time dependence of helium atoms generated in SFCM from a time of 100 s after end of chain ssion.
4 L. Viererbl et al.: EPJ Nuclear Sci. Technol. 2, 31 (2016)
(Tab. 3). Baseline values were chosen as follows (bold
values in Tab. 2): T
S
=20 °C, R= 50 cm, Q= 3.41 W/kg,
and ZrO
2
material. During each calculation, only one of the
parameters was varied from baseline values.
4.2 Results
Figure 6 shows the calculated temperature distribution
in the SFCM sphere for the baseline variant. Naturally,
the distribution is spherically symmetrical with the
maximum temperature T
C
in the spheres centre. The
distribution shape is similar for different variants
and varies mainly in the temperature difference DT
between the spheres centre and the spheres surface,
DT=T
C
T
S
. This value is therefore given as the only
parameter characterizing the temperature distribution for
a variant. Then, for example for the baseline variant with
surface temperature T
S
=20 °C and centre temperature
T
C
= 424 °C, the difference DT= 404 K. For varying
surface temperature T
S
, a constant difference DTis used
for calculation approximation. Thus for example for
T
S
= 120 °C, we would have T
C
= 524 °C(R,Qand
material as in the baseline variant). For values of DTfor
varying R,Q, and material, see Tables 46.When
temperatures obtained by simplifying formal calculations
are above the materials melting point, the values are
given in brackets.
5 Discussion and conclusion
The estimated calculation uncertainties in dosimetry
parameters for spent fuel containing material (up to 30%
in Sect. 2 and 5% in Sect. 3) are sufcient because
uncertainties in composition and other SFCM parameters
would in reality be much greater. Thermal calculations
conrmed that due to radiation heating, temperature inside
Fig. 5. Spatial distribution of relative dose rate for gamma energy of 3000 keV and different SFCM sphere diameters d.
Table 2. Parameter variants for calculation.
T
S
(°C) 20 50 100 200 400 800
R(cm) 5 10 20 50 100 200
Q(W/kg) 38.6 20.0 8.94 3.41 0.337 0.067
Material Steel Concrete Glass ZrO
2
ZrSiO
4
Al
2
O
3
Table 3. Specic radiation heat versus times tafter the end of the ssion chain reaction.
t(s) 1.00E+04 1.00E+05 1.00E+06 1.00E+07 1.00E+08 1.00E+09
Q(W/kg) 38.6 20.0 8.94 3.41 0.337 0.067
L. Viererbl et al.: EPJ Nuclear Sci. Technol. 2, 31 (2016) 5