REGULAR ARTICLE
Energetic and economic cost of nuclear heat impact on the
cost of desalination
Saied Dardour
1,2,*
and Henri Safa
1,3
1
Commissariat à l'Énergie Atomique et aux Énergies Alternatives, 13108 Saint-Paul-lez-Durance Cedex, France
2
DEN/DER/SESI, CEA Cadarache, Bât.1222, 13108 Saint-Paul-lez-Durance Cedex, France
3
International Institute of Nuclear Energy, 91191 Gif-sur-Yvette Cedex, France
Received: 5 April 2016 / Received in nal form: 8 November 2016 / Accepted: 8 November 2016
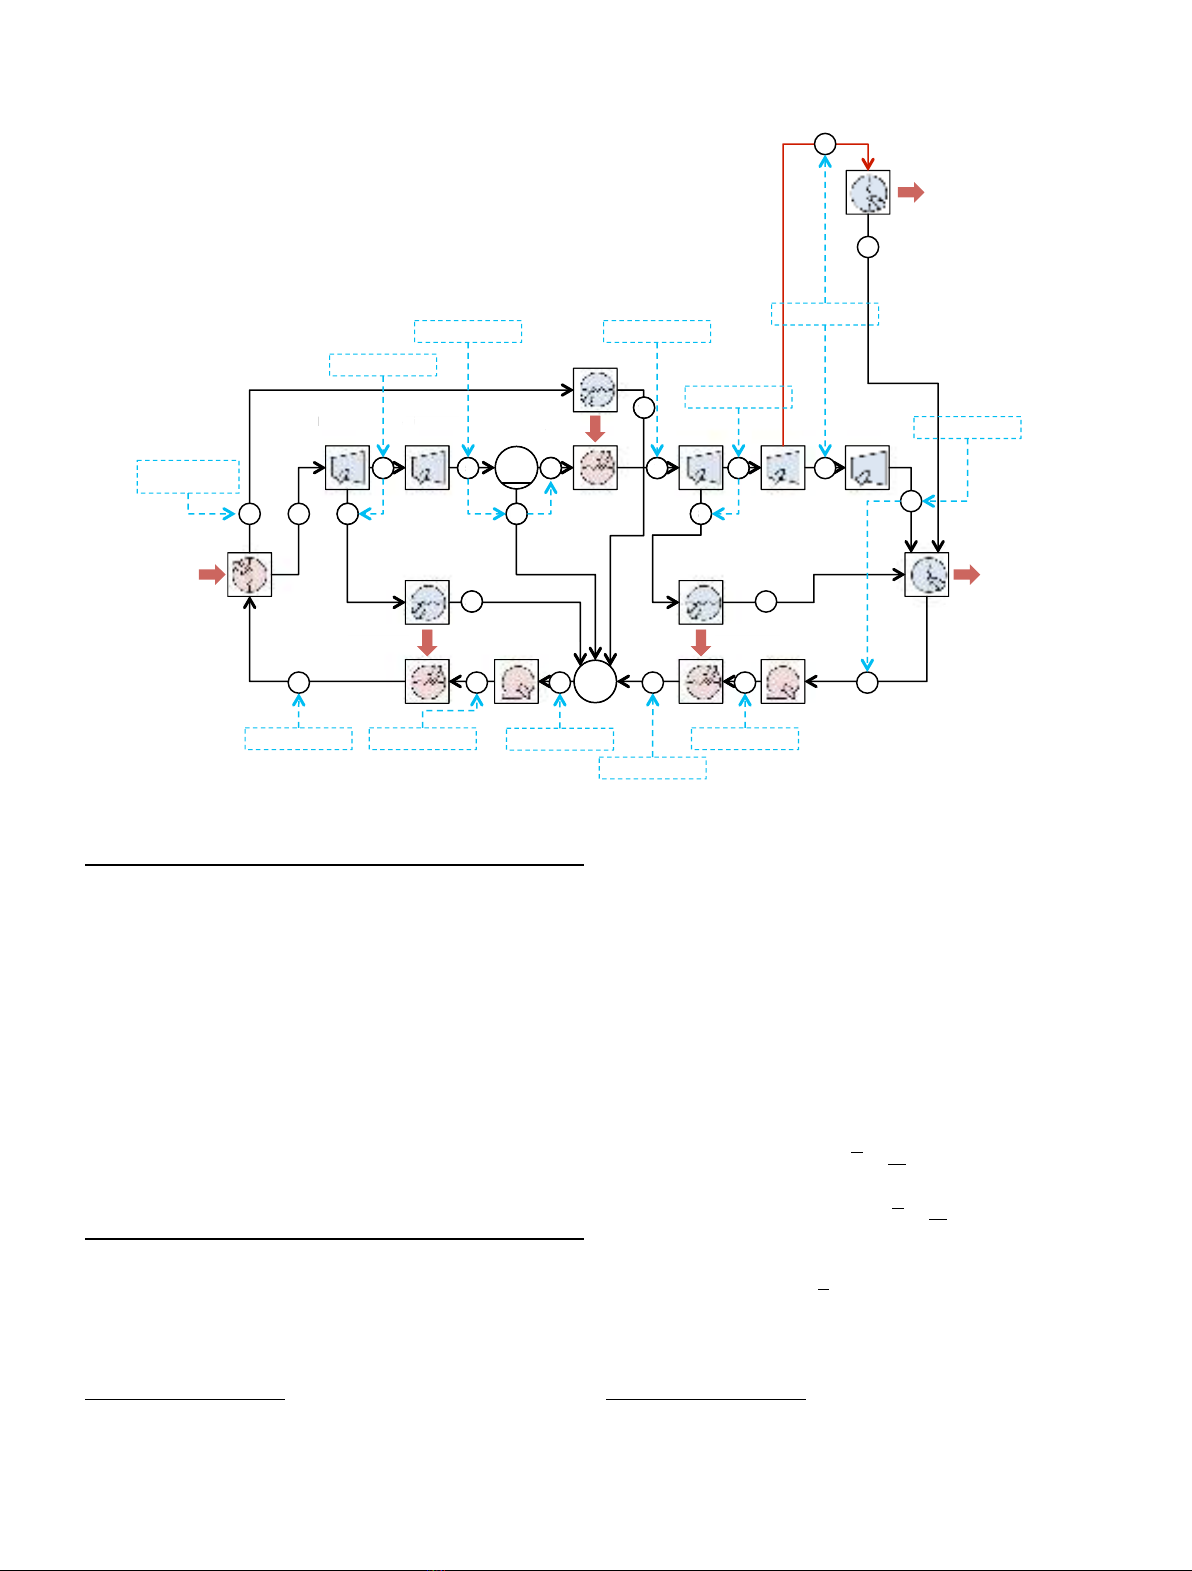
Abstract. An exploratory study has been carried out to evaluate the cost of heat supplied by a pressurized
water reactor type of nuclear reactors to thermal desalination processes. In the context of this work, simplied
models have been developed to describe the thermodynamics of power conversion, the energetics of multi-effect
evaporation (MED), and the costs of electricity and heat cogenerated by the dual-purpose power plant.
Application of these models show that, contrary to widespread belief, (nuclear-powered) MED and seawater
reverse osmosis are comparable in terms of energy effectiveness. Process heat can be produced, in fact, by a
relatively small increase in the core power. As fuel represents just a fraction of the cost of nuclear electricity, the
increase in fuel-related expenses is expected to have limited impact on power generation economics.
1 Introduction
With almost 75 million cubic meter per day of worldwide
installed capacity [1], desalination is the main technology
used to meet water scarcity. About two third of this
capacity is produced by reverse osmosis (RO) (Fig. 1). The
remaining one third is produced mainly by thermal
desalination plants multi-effect evaporation (MED) and
multi-stage ash (MSF), mostly in the Middle East.
Seawater desalination is an energy-intensive process.
1
According to [2], the lowest energy consumption and the
closest to the minimum set by thermodynamics
(1.06 kWh m
3
)[3]is achieved by RO processes equipped
with energy recovery devices. Seawater RO (SWRO) electri-
city utilization ranges, in fact, between 4 and 7 kW
e
hm
3
[4].
Some plants, producing large amount of desalinated water,
claim even lower energy consumption; 3.5 kW
e
hm
3
for
Ashkelon, Israel [4]; and 2.73.1 kW
e
hm
3
(depending on
temperature and membrane ageing) for Perth, Australia [5].
Thermal desalination processes consume heat,
2
in
addition to electricity. Heat consumption varies between
40 and 65 kWh
th
m
3
for MED, and 5580 kWh
th
m
3
for MSF [2]. MSF's electric power consumption is
higher than MED's because of pressure drops in
ashing chambers and the possible presence of brine
recirculation loops [6]. MSF's pumping power varies
between 2.5 and 5 kWh
e
m
3
[7]. MED manufacturers
claim specic electricity consumptions lower than
2.5 kWh
e
m
3
.
1.1 Power consumption: thermal desalination systems
vs. membrane-based processes
Thermal desalination systems are often coupled to power
generation units to form integrated water and power
plants(IWPPs) in which steam is supplied to the
desalination unit by the power plant.
The cost of process heat provided by such plants is
traditionally evaluated based on the missed electricity
production”–steam diverted to the process is no longer
used for electricity production leading, systematically, to
higher energy costs for the thermal desalination processes
compared to RO. MED's steam supply costs between 4 and
7 kWh
e
m
3
of missed electricity productionaccording
to [2]. If we add 1.22.5 kWh
e
m
3
of pumping energy, we
end up with an equivalent electric power consumption in
the range [5.29.5] kWh
e
m
3
.
Rognoni et al. [8] suggested an alternative way to
evaluating the cost of heat duly considering the benets of
cogeneration. The approach no longer views process heat
as a missed electricity production, but, rather, as a result
of a (limited) raise in the primary power”–the power
released from combustion. According to this approach, the
* e-mail: saied.dardour@cea.fr
1
Energy is, in many cases, the largest contributor to the desalted
water cost, varying from one-third to more than one-half of the
cost of produced water.
2
MED's top brine temperature (TBT) generally varies between
60 and 75 °C. MSF's TBT is higher, 90110 °C.
EPJ Nuclear Sci. Technol. 3, 1 (2017)
©S. Dardour and H. Safa, published by EDP Sciences, 2017
DOI: 10.1051/epjn/2016037
Nuclear
Sciences
& Technologies
Available online at:
http://www.epj-n.org
This is an Open Access article distributed under the terms of the Creative Commons Attribution License (http://creativecommons.org/licenses/by/4.0),
which permits unrestricted use, distribution, and reproduction in any medium, provided the original work is properly cited.
energetic cost of process heat is equal to the number of
MW
th
added to the boiler thermal power output. Since fuel
represents just a fraction of the cost of electricity, process
heat is expected to be cheaper than predictions based on
the traditional cost evaluation method. As a result, thermal
desalination processes precisely MED can be potentially
more cost-effective than SWRO. The authors provided
two-calculation examples MED processes fueled by coal-
red power plants in India for which the cost of
desalinated water is 50% lower than SWRO's.
1.2 Nuclear steamcost
The cost of process heat depends on the contribution, to the
total cost of electricity, of fuel-related expenses a
contribution widely considered to be lower for nuclear-
powered electricity generators compared to fossil power
plants [9]. Past studies show, in fact, that heat recovery
from light water reactors is economically competitive for a
number of low temperature applications, including district
heating [10] and seawater desalination [11].
The study described in this paper aims at evaluating
the energetic and economic cost of process heat, sup-
plied by pressurized water reactor (PWR) to a thermal
desalination process. The objective is to provide a basis for
comparing thermal (MED
3
) and membrane-based
(SWRO) desalination processes in terms of energy costs.
Simplied models, describing the thermodynamics of a
generic PWR power conversion system, the energetics the
MED process, and the costs of electricity and process heat
produced by the dual-purpose plant (DPP), support this
study. These models, and the results of their application,
are presented and discussed in the next sections.
2 Energetic cost of heat
The energetic cost of heat was evaluated based on the
power conversion system (PCS) architecture described in
the next paragraph.
2.1 Power conversion system architecture
Figure 2 illustrates the workow of the PCS being modeled.
The system is basically a Rankine cycle representa-
tive of the technologies commonly applied is PWRs.
Steam leaving steam generators (SG) undergoes two
expansions in the high-pressure body of the turbine
(HPT
1
and HPT
2
). The uid is then dried-up and
superheated before supplying the low-pressure stages
(LPT
1
, LPT
2
and LPT
3
). Liquid water extracted from the
condenser (Condenser
2
)isnally preheated and readmitted
back to SG.
A steam extraction point was positioned between
the outlet of LPT
2
and the inlet of LPT
3
. This location
allows for a variable quantity (y=0100%) of steam
(the steam normally owing through LPT
3
) to be diverted
to an external process. The pressure at the steam
extraction point (P
SteamEx
) may vary between 0.05 bar
(pressure at the condenser) and 2.685 bar (pressure at
LPT
2
outlet), and the temperature (T
SteamEx
) between 33
and 129 °C. The range of temperatures generally required
by thermal desalination systems generally falls within these
limits.
The power plant condenser was (virtually) split in two.
In Condenser
1
, the latent heat of condensation is
transferred to the external process. Condenser
2
cools the
condensates down to 33 °C. The heat duty of each of the
two condensers strongly depends on the quantity of steam
diverted to the process.
2.2 Thermodynamic model
A thermodynamic model, evaluating the energetic perfor-
mance of the PCS described in the previous paragraph,
was developed using CEA's in-house tool ICV.
4
MSF; 23%
MED; 8%
ED; 3%
RO; 63%
Hybrid; 1% Other; 2%
Installed Capacity (2013)
74.8 million m3per day
MED: Multi-Effect Evaporation
MSF: Multi-Stage Flash
RO: Reverse Osmosis
ED: Electrodialysis
Fig. 1. Total worldwide installed capacity by technology.
3
MSF is out of scope in this paper, as it consumes higher amounts
of energy compared to MED.
4
ICV simulates the steady-state behavior of components such as
boilers, heat exchangers, pumps, compressors and turbines, as
well as workows typically heat transfer loops and power
conversion cycles based on these components. ICV has a build-in
library providing the properties of steam and water [12], including
saline-water [13].
2 S. Dardour and H. Safa: EPJ Nuclear Sci. Technol. 3, 1 (2017)
The model calculates the characteristics of the 23 points
of the owsheet temperature, pressure, steam quality,
5
enthalpy, exergy and owrate the power of the major
components of the PCS, as well as the amounts of electricity
(W
Elec
) and process heat (Q
Pro
) cogenerated by the system.
Model inputs include:
an assumed pressure distribution within the PCS (Tab. 1);
SG outlet temperature (290 °C) and thermal power
output (Q
SG
);
the temperature at the steam extraction point (T
SteamEx
);
the fraction of steam (normally expending through
LPT
3
) diverted to the external process (y).
The calculation of the Rankine cycle is performed
sequentially, component by component, applying the mass
and energy balance equations (Eqs. (1) and (2)
6
)to
different control volumes.
X
in
_
m¼X
out
_
m;ð1Þ
X
in
_
Qþ_
Wþ_
mhþv2
2þgz

¼X
out
_
Qþ_
Wþ_
mhþv2
2þgz

;ð2Þ
_
m, mass owrate (kg/s); _
Q, thermal power (W); _
W,
mechanical power (W); h, specic enthalpy (J/kg); v
2
/2,
specic kinetic energy (J/kg); gz, specic potential
energy (J/kg); gz, specic potential energy (J/kg).
Table 1. Assumed pressure distribution.
Steam generator outlet
High pressure turbine 1 inlet 70 bar
High pressure turbine 2 inlet 36.5091 bar
High pressure turbine 2 outlet
Separator inlet, outlets 11 bar
Low pressure turbine 1 inlet 10 bar
Low pressure turbine 2 inlet 2.685 bar
Low pressure turbine 3 inlet
Condenser
1
(variable)
Condenser
2
0.05 bar
Low pressure pump outlet 15 bar
Preheater outlet 12.5 bar
Mixer outlet 11 bar
High pressure pump outlet 87.5 bar
Reheater outlet 85 bar
Nuclear Heat
High Pressure Pump
Low Pressure Pump
Preheating Reheating
Separator
Superheating
High Pressure Turbines
3
4
3s
1s
5
5s
6 7
8
9
Mixer
Condenser
2
High Pressure Pump
p
P
re
h
eat
i
n
g
R
e
h
eat
ing
Separa
tor
Hig
h
P
ressure
T
u
r
bi
n
es
3
4
3
s
1s
5
5s
6
7
8
9
C
10
11
12
8s
10s
13 14 16 17 18
1 2
290 °C
70 bar
36.51 bar
11 bar 10 bar
2.68 bar
Variable pressure
0.05 bar
15 bar
10 bar
87.5 bar 85 bar
Power Conversion System
(Rankine Cycle)
Tertiary
Circuit
Low Pressure
Turbines
Condenser
1
15
12.5 bar
Thermal Desalination
Process
Fig. 2. Power conversion system architecture.
5
Mass of vapor to total mass in a saturated liquidvapor mixture.
Values lower than 0 or higher than 1 indicate that the uid is
either subcooled (100) or superheated (200).
6
In practice, the kinetic + potential energiesterm of equation
(2) is neglected, leading to a simpler formulation of the energy
conservation principle.
S. Dardour and H. Safa: EPJ Nuclear Sci. Technol. 3, 1 (2017) 3
The state of the uid at the outlet of steam turbines and
water pumps is determined applying an isentropic
efciency (88% for turbines and 87% for pumps):
eturbine ¼hin hout
hin houtðsout ¼sinÞ;ð3Þ
epump ¼houtðsout ¼sinÞhin
hout hin
;ð4Þ
e, isentropic efciency; hin, specic enthalpy at inlet (J/kg);
sin, specic entropy at inlet (J/kg/K); hout, specic
enthalpy at outlet (J/kg); sout, specic entropy at outlet
(J/kg/K); houtðsout ¼sinÞ, specic enthalpy at outlet for a
constant-entropy transformation.
The following assumptions were also made:
Steam admitted to different heat exchangers is assumed
to leave all its latent heat to the uid owing on the
secondary side of the exchanger.
Axed pinch point temperature difference of 15 °C was
systematically applied to determine the outlet uid
temperature on the secondary side.
Energy losses
7
are not taken into account (the calculated
netpower and heat outputs are actually grosspower
and heat outputs).
2.3 Energetic performance of the PCS
Tables 2 and 3show the characteristics of a 2748 MW
th
single-
purpose plant (SPP) generating 1000 MW
e
of electricity.
The contribution of steam turbines to SPP's electricity
output is shown in Figure 3. LPT
3
delivers 213 MW
e
of
mechanical power, which represents 21% of the total
electricity output.
Table 2. SPP (PWR 2748 MW
th
1000 MW
e
): thermodynamic points.
Point T(°C) P(bar) X(%) H(kJ kg
1
)E(kJ kg
1
K
1
)F(kg s
1
)
1 290 70 200 2793.98 1048.97 139.405
2 290 70 200 2793.98 1048.97 1385.06
3 245 36.5091 93.2741 2685.23 931.684 245.05
4 245 36.5091 93.2741 2685.23 931.684 1140.01
5 184.07 11 85.9332 2499.41 729.341 1140.01
6 184.07 11 100 2780.67 827.192 979.649
7 275 10 200 2997.9 902.283 979.649
8 145.081 2.685 200 2753.21 633.359 180.999
9 145.081 2.685 200 2753.21 633.359 798.65
10 80 0.474147 93.8269 2500.54 351.599 0
11 80 0.474147 93.8269 2500.54 351.599 798.65
12 32.8755 0.05 86.5162 2234.05 49.7124 798.65
13 32.8755 0.05 0 137.765 4.22995 979.649
14 32.9654 15 100 139.492 2.72166 979.649
15 130.081 12.5 100 547.394 60.0595 979.649
16 170.264 10 100 720.471 110.977 1524.47
17 171.56 87.5 100 730.378 120.02 1524.47
18 230 85 100 991.385 216.545 1524.47
1s 285.83 70 0 1267.44 336.615 139.405
3s 245 36.5091 0 1061.49 242.266 245.05
5s 184.07 11 0 781.198 131.569 160.363
8s 129.782 2.685 0 545.456 58.7786 180.999
10s 80 0.474147 0 334.949 14.3207 0
Table 3. SPP (PWR 2748 MW
th
1000 MW
e
): mechan-
ical and thermal powers.
Component Power (MW)
Steam generators 2747.99
High pressure turbine 1 150.624
High pressure turbine 2 211.837
Low pressure turbine 1 239.709
Low pressure turbine 2 201.796
Low pressure turbine 3 212.827
Condenser
1
(Process) 0
Condenser
2
(Tertiary circuit) 1747.99
Low pressure pump 1.69183
High pressure pump 15.102
Sum 1.14 10
13
Net power output 1000
Power conversion efciency (%) 36.3902
7
Thermal losses at heat exchangers. Mechanical losses at pumps,
turbines and generators. Electrical power consumption, internal
to the power plant and the external process.
4 S. Dardour and H. Safa: EPJ Nuclear Sci. Technol. 3, 1 (2017)
If all the steam normally owing towards this turbine is
redirected to the external process (T
SteamEx
=80°C), the
plant would generate 787 MW
e
of electricity and
1730 MW
th
of process heat. The reactor's process heat
generation capacity depends, in fact, on the core power,
and on the temperature at the steam extraction point, as
shown in Figure 4.
Now, if only a portion of this steam exactly 57.8% is
diverted, the plant would produce 877 MW
e
of electricity
and 1000 MW
th
of heat. The characteristics of
conguration we will call it DPP
1
(dual-purpose plant)
are listed in Tables 4 and 5.
The differences between SPP and DPP
1
are highlighted
(underlined) in Tables 25. The two Rankine cycles have
identical characteristics except for points 1012. In DPP
1
,
turbine LPT
3
is partly bypassed the exergy of the
rerouted steam is later destructedin Condenser
1
resulting in a 123 MW
e
decrease in power generation
compared to SPP.
The number of MW
e
of electricity production lost for
each MW
th
supplied to the external process (123 kW
e
per
MW
th
in the case of DPP
1
) is a traditional measure of the
energetic cost of process heat. This measure will be referred
to as the W-cost of heator WCH:
WCH ¼D_
WElec
_
QPro
"#
Q
_
SG¼Constant
:ð5Þ
This lossin electricity production can be avoided by
increasing the thermal power of the core. To keep the
electricity generation capacity at 1000 MW
e
and the heat
production level at 1000 MW
th
SG have to deliver an
additional 338 MW
th
. The portion of diverted steam has
also to be adjusted (51.5%). This conguration we will
call it DPP
2
(Tabs. 6 and 7)not only offers higher power
conversion efciency (32.40%) compared to DPP
1
(31.91%), but also results in lower heat cost, as we will
see in Section 2.
The number of MW
th
added to core power, per MW
th
supplied to the external process (338 kW
th
per MW
th
in the
case of DPP
2
) provides an alternative measure of the
energetic cost of steam we will call it the Q-cost of heat
or QCH:
QCH ¼D_
QSG
_
QPro
"#
_
WElec¼Constant
;ð6Þ
1699 1725 1746 1761
2803 2846 2880 2905
0
500
1000
1500
2000
2500
3000
3500
50 75 100 125
Available Process Heat (MWth)
Temperature at the Steam Extraction Point (C)
Fig. 4. Available heat for the external process vs. temperature at the steam extraction point. Blue bar: PWR 1000 MWe
(2748 MWth); orange bar: PWR 1650 MWe (4534 MWth).
15%
21%
23%
20%
21% High Pressure Turbine 1
High Pressure Turbine 2
Low Pressure Turbine 1
Low Pressure Turbine 2
Low Pressure Turbine 3
Fig. 3. Contribution of steam turbines to SPP's electricity output.
S. Dardour and H. Safa: EPJ Nuclear Sci. Technol. 3, 1 (2017) 5