of the most commonly
asked questions with the
introduction of the TrueNet™
Structured Cabling System is,
“Why do you only offer patch cords in certain lengths?”
Specifically, those lengths are 4, 7, 10 and 15 feet.
And the simple answer is: certain patch cord lengths
cause unacceptable signal reflection and distortion to
Ethernet signals, leading to errors and poor network
throughput. Factory-terminated 4, 7, 10 and 15 foot
TrueNet cords prevent this distortion, preserving the
integrity of 10/100Base-T Ethernet signals.
What is an Ethernet signal?
The explanation of what an Ethernet signal is, is rather
complex. In fact, in order to begin, it is first important to
understand the composition of an Ethernet signal.
An Ethernet signal is designed to mimic the binary language
of computers (ones and zeros), by creating a signal which
can be sent over a distance. One of the binary signaling
methods that is easiest to understand is Morse code, where
a quick “dot” is one and a long “dash” is zero. Ethernet
uses electrical impulses to create a signaling method which
also can be interpreted as zeros or ones. The basic idea is to
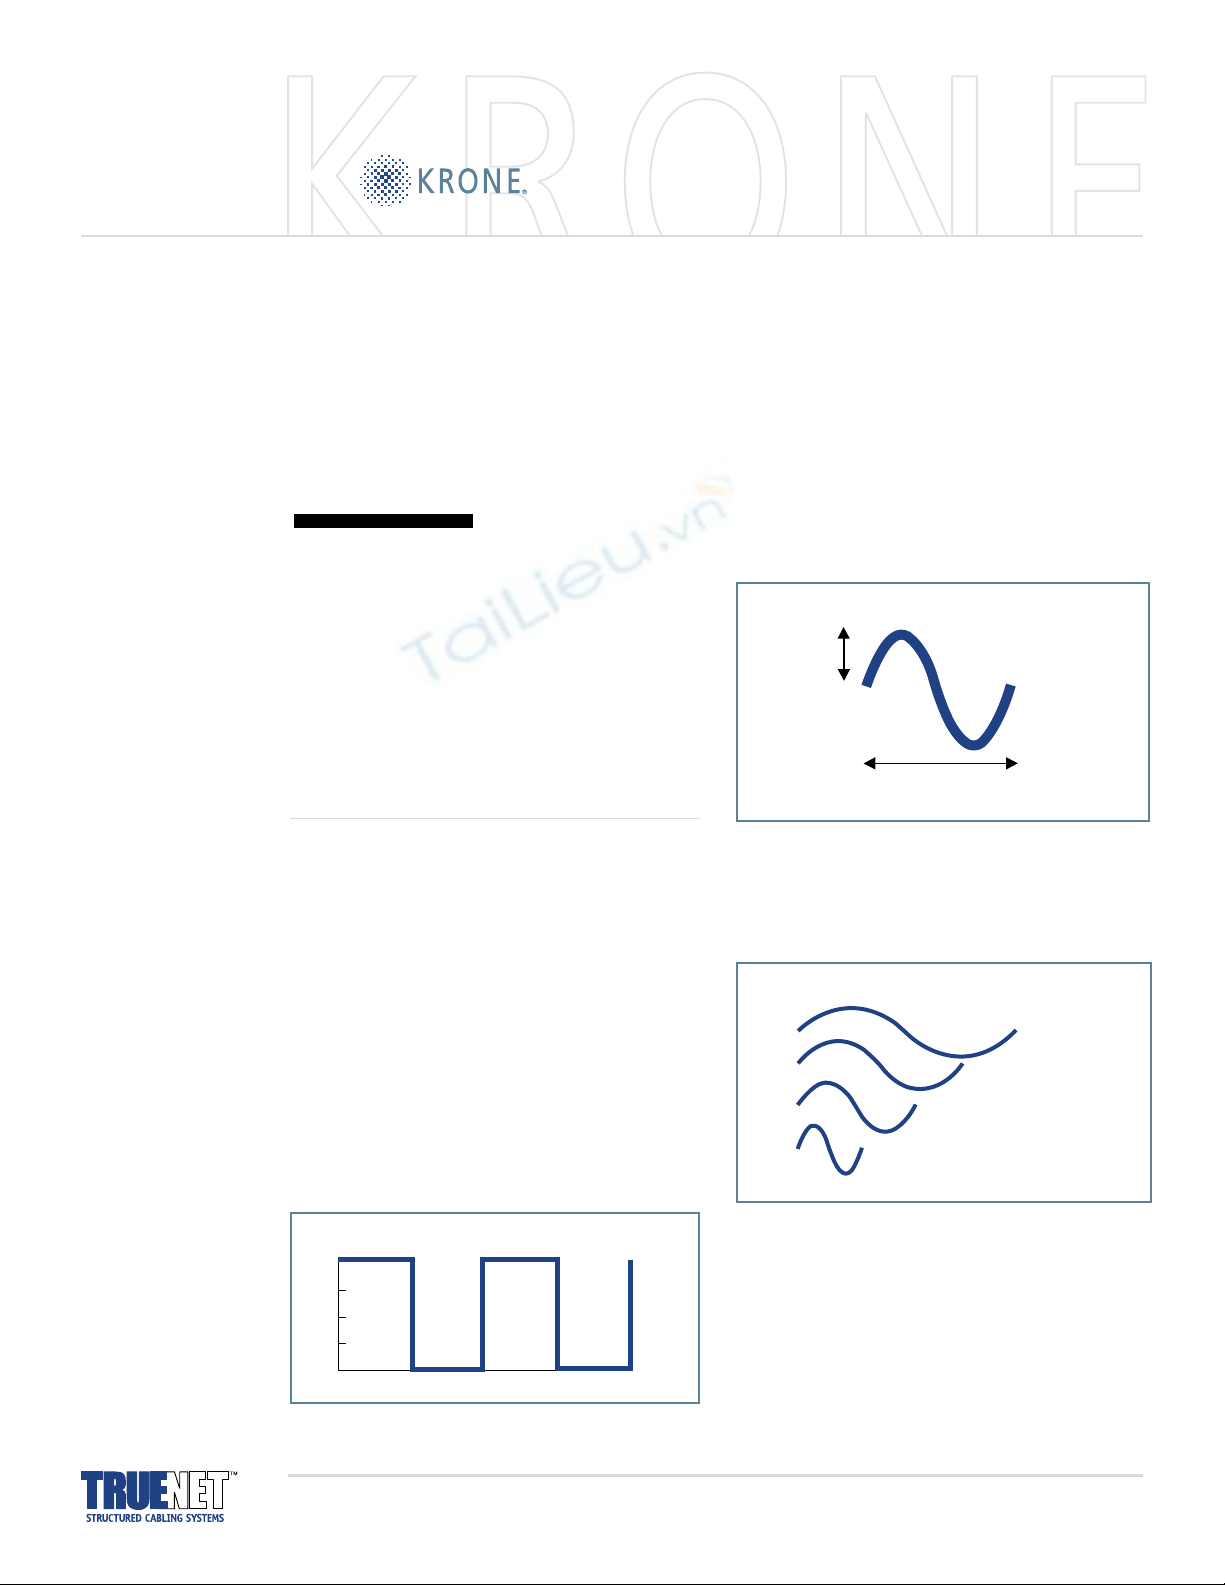
create a square wave, seen below (Figure 1), where the
instantaneous changes up and down are used in indicate the
one or zero. Using electrons to create a signal that looks like
a square wave is somewhat tricky, but here is the basic idea:
An electrical impulse takes the shape of a sine wave. A wave
has two components: the amplitude and the frequency
(frequency can also be called wavelength). The amplitude is
the “height” of the wave. The frequency, or wavelength, is
the number of peaks in a given timeframe (see Figure 2).
The illustration below (Figure 3) shows four different
sine waves, each with the same amplitude, but having
varying frequencies.
In order to create a signal that looks like a square wave,
you need to create a signal which combines many
frequencies together (see Figure 4).
The key component to remember is that the square wave
of an Ethernet signal is made of many different sine waves,
each important to creating the shape of the square wave.
Ethernet Signal Preservation
In Factory-Terminated Patch Cords for Local Area Networks.
OONNEE
KRONE: 800-775-KRONE www.kroneamericas.com www.truenet-system.com.
No part of this document may be reproduced without permission ©2000 KRONE, Inc.
Amplitude
Wavelength
Figure 2: Sine wave.
Figure 1: The square wave of an Ethernet signal.
Figure 3: Sine waves of varying frequencies.
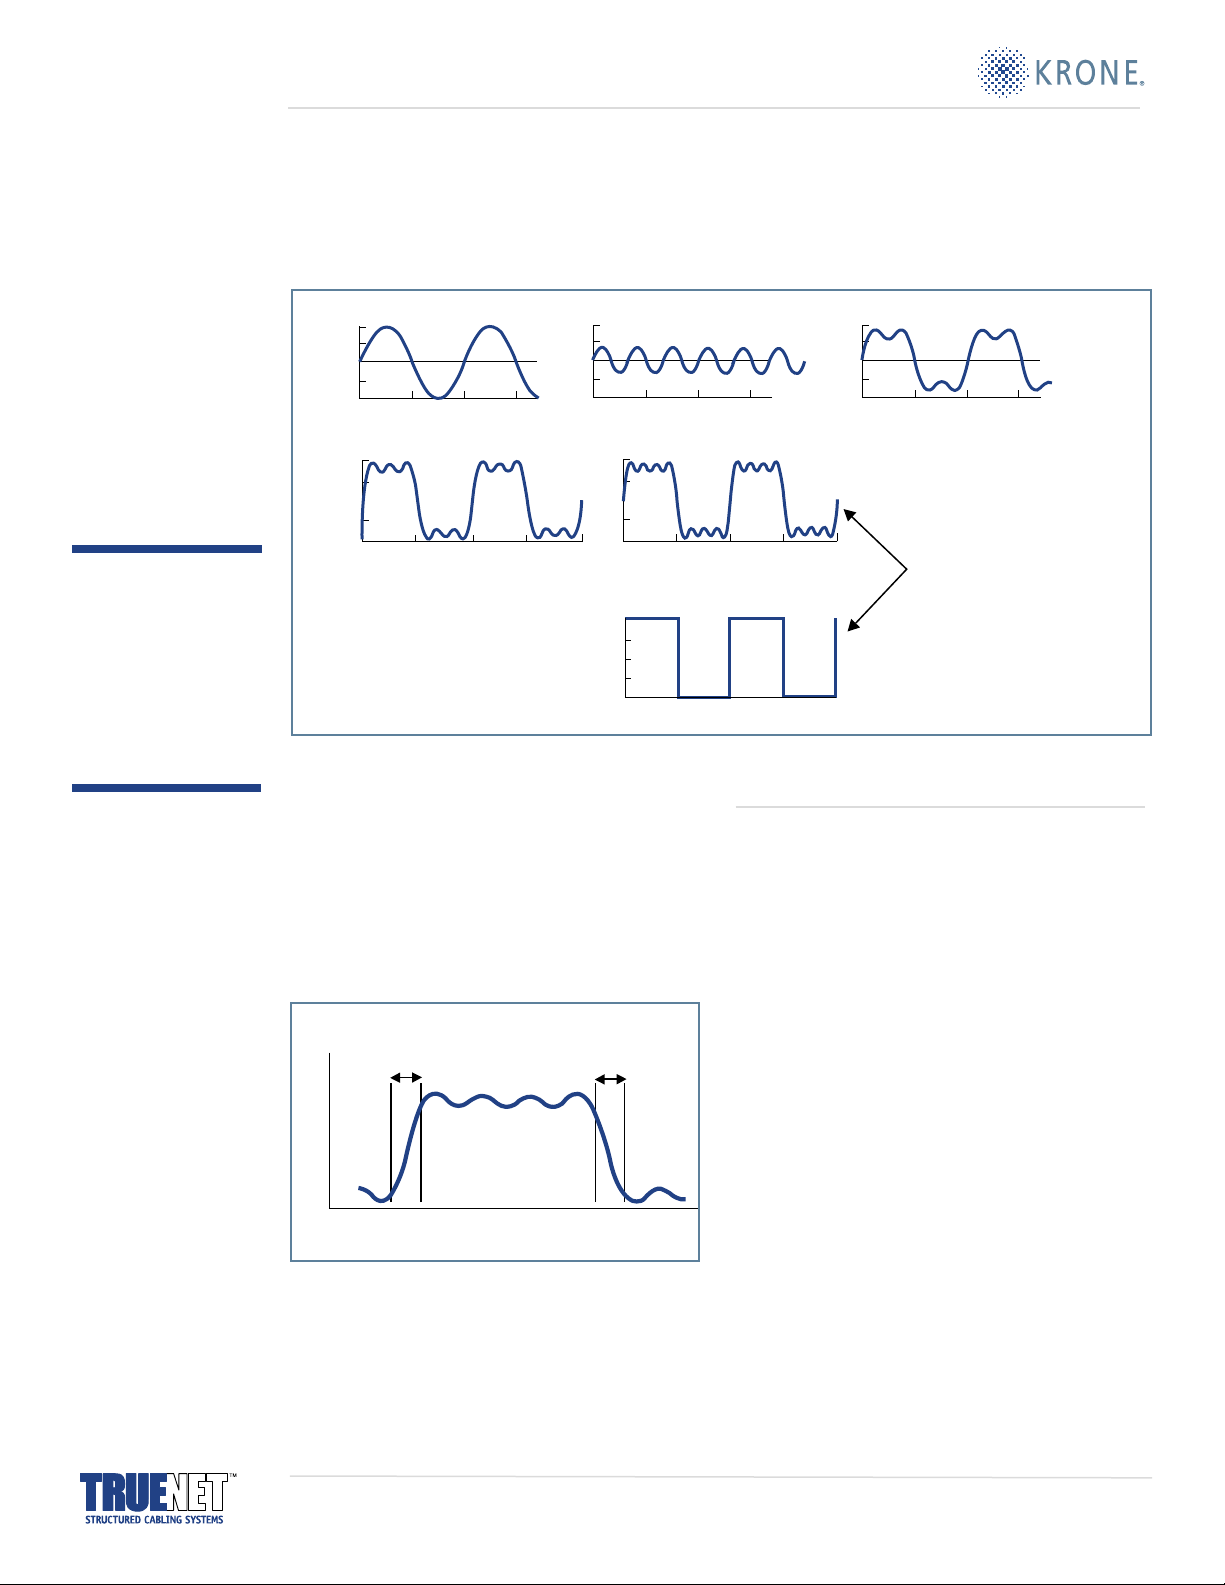
The next important thing to understand is that Ethernet
expects the size and shape of the square wave to fall within
a set of defined boundaries, so that the signal can be
properly interpreted. One example of these boundaries is the
rise and fall time, or the time that it takes to indicate a
change in state (see Figure 5). If either of these parameters
don’t fall within the prescribed limits, a “one”might be
misinterpreted as a“zero”(which would cause an error).
Now, “What does any of this have to do with patch cord
lengths?” To get to the answer, we have to go back
to the sine wave.
Ethernet signals and patch cords
We pointed out that an Ethernet square wave is made up of
the sum of many sine waves. If anything should happen to
the energy in one or more of those sine waves as they travel
down the wire, the shape of the square wave can change.
To look at it another way, if you remove any one sine wave
from the square wave, the shape changes. Therefore, it is
critical to ensure that signal energy is preserved as a signal
travels along a wire, so the shape of the wave stays consistent.
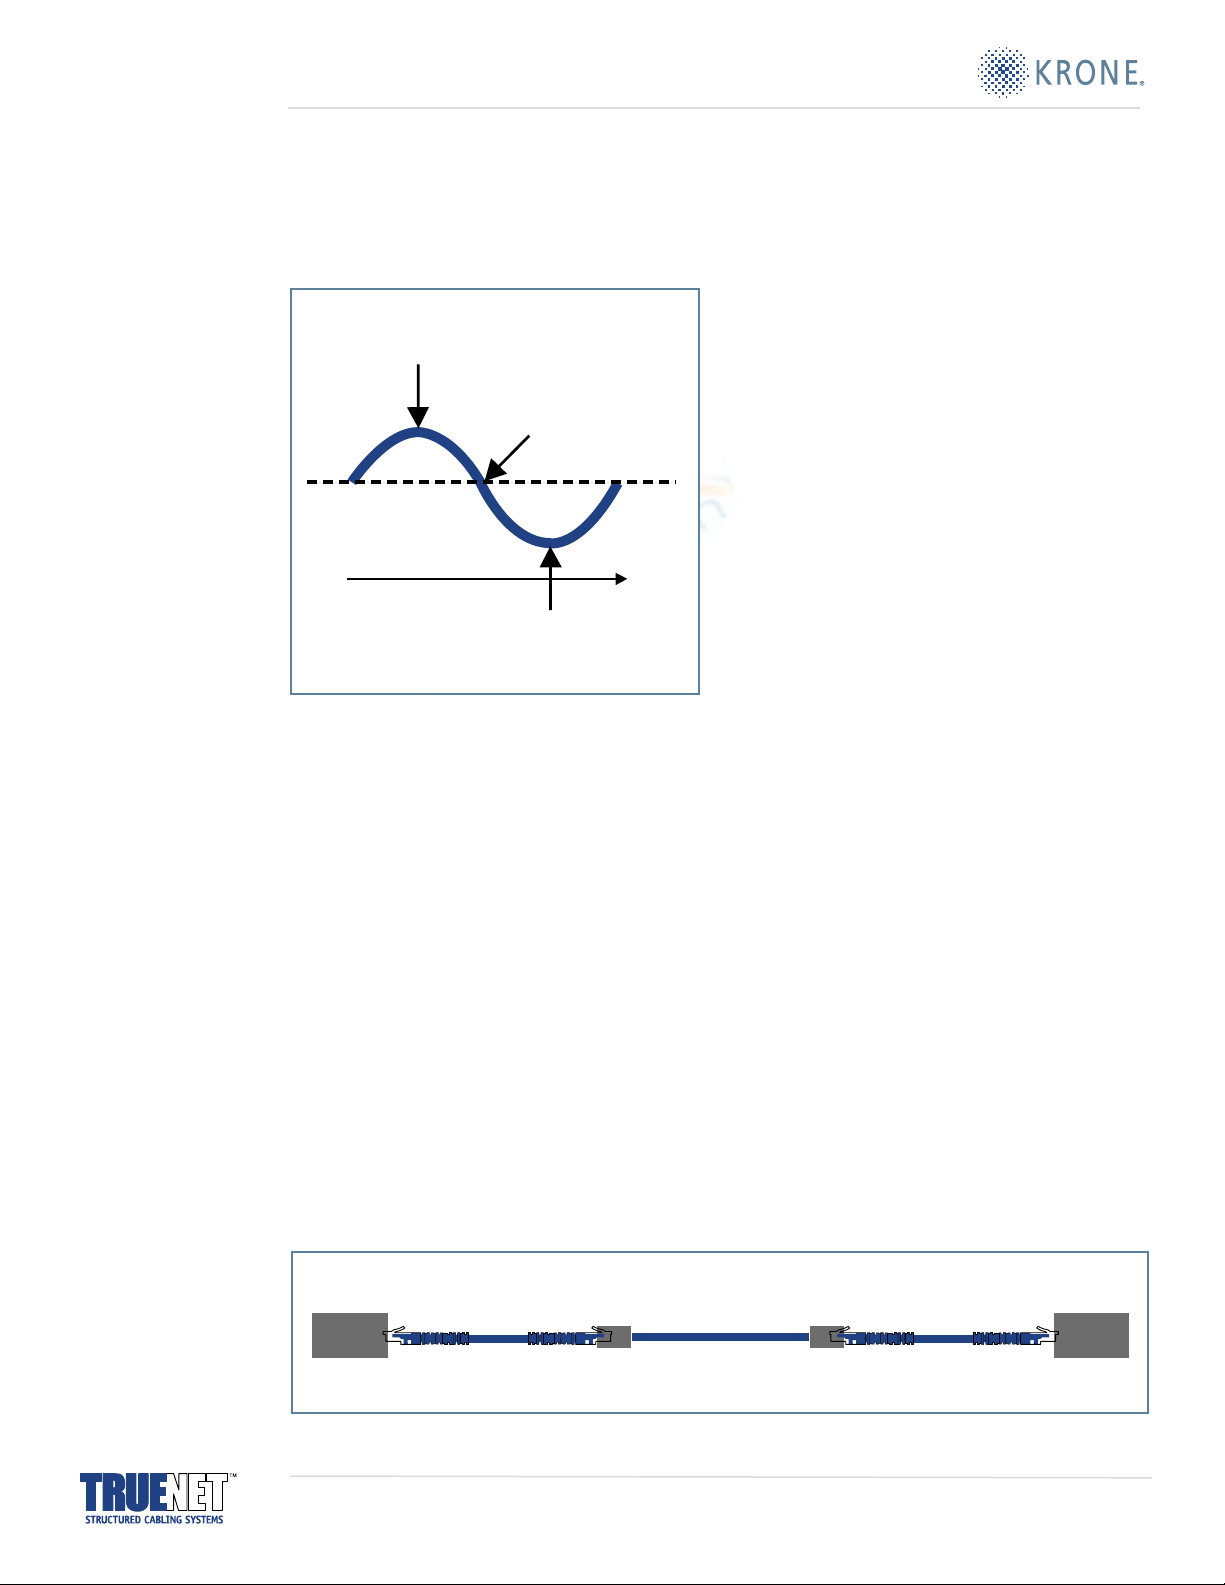
As a sine wave is generated, the greatest amount of energy
is released at peaks of the cycle (since a sine wave oscillates
around a zero line, peak energy occurs at the “peak” and
“valley” of each cycle) (see Figure 6). If anything happens to
disrupt the wave at these points, the signal strength of that
wave is severely compromised. As it turns out, the most
disruptive elements to signal strength in a network node are
the connection points. Remember that any node in a
network consists of a number of connections between the
signal-generating ends (the NIC and the hub/switch). Patch
cords are plugged into the station outlet, patch panels, etc.
The reason that connection points are disruptive is two-fold.
First, it represents a transition of physical materials and
geometry which occurs in the path of the signal. This
disruption is further exacerbated when the connected
KRONE: 800-775-KRONE www.kroneamericas.com www.truenet-system.com.
No part of this document may be reproduced without permission ©2000 KRONE, Inc.
Voltage
Rise Time
Nanoseconds
Fall Time
Figure 5: Rise and fall time is the length of time, in nanoseconds,
that it takes for a signal to rise or fall from one state to another,
signaling a “one.”
+=
Add sine waves of different frequencies together...
Add even more frequencies...
And it starts to
look like a
square wave!
Figure 4: The square wave of an Ethernet signal is made of many different sine waves combined together.
The key component
to remember is that
the square wave of
an Ethernet signal
is made of many
different sine waves,
each important
to creating the shape
of the square wave.
elements are not electrically matched well. The second
reason is that the connection points are usually very close to
one of the active sending elements of the network (NIC or
hub), where signal strength is the strongest, and has the
most energy. The first connection point is obviously the
patch cord. Therefore, the integrity of patch cords is critical
(see Figure 7).
When the sine waves hit the connection point, if any
wave is at its point of maximum energy, one of two
things can happen:
1. The energy can be reflected back toward the source.
2. The energy can be dissipated and lost.
In either case, the shape of the sine wave is distorted,
which then can distort the square wave.
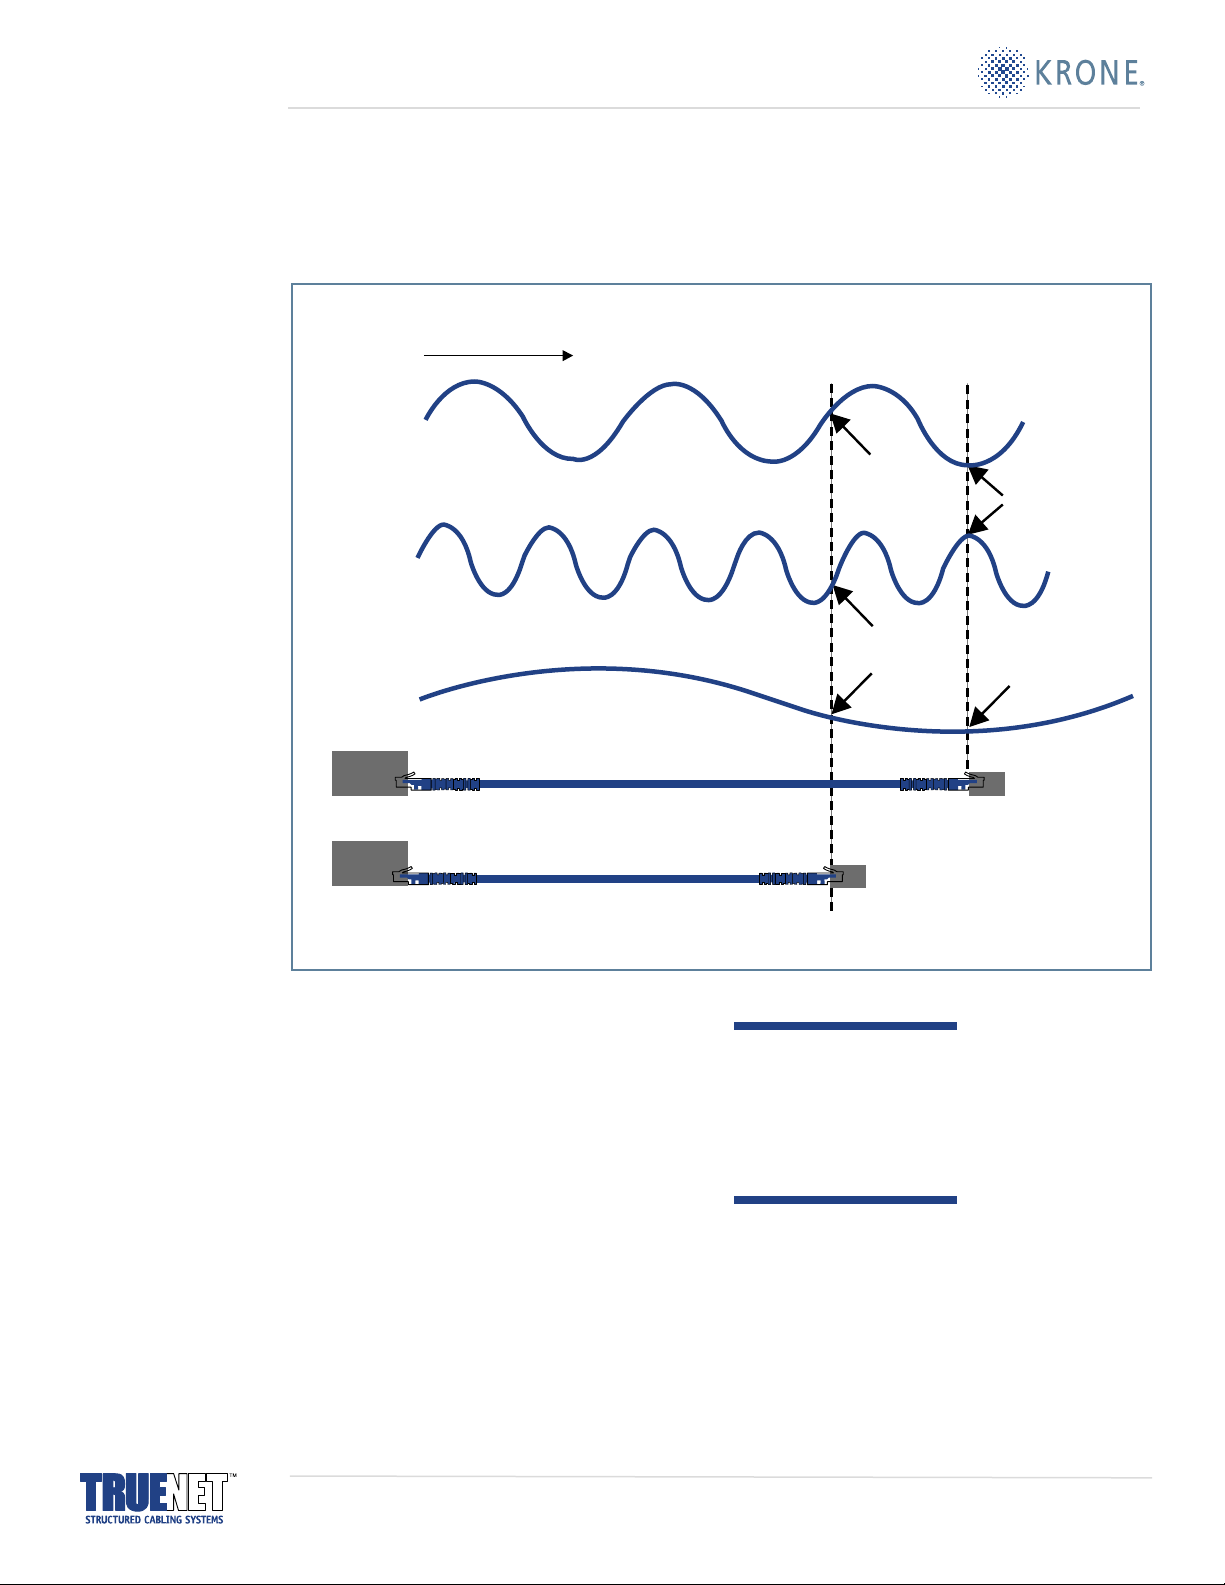
Since the wavelength of a sine wave actually corresponds to
a physical length in meters, it is possible to determine the
physical distances where the peaks and valleys of the wave
occur. It is therefore possible to determine the optimal
length of a patch cord so as to position the first connection
point at a physical distance where minimum energy
is occurring (see Figure 8).
The most important thing to do is to minimize the energy
reflection at the sine wave frequencies that are most critical
to the shape of the square wave. For 10/100Base-T Ethernet,
the frequencies of greatest concern are the approximate
window between 10 MHz and 31 MHz.
Patch cord lengths which do not take this distortion effect
into account can allow maximum energy at the critical
frequencies to be present at the connection point, which
has the effect of distorting the square wave, and causing
bit errors in Ethernet.
The technique of using specific patch cord lengths to reduce
errors has been confirmed with active network analysis of
bit error generation in otherwise identical patch cords
plugged into the same channel. Patch cords of the proper
length generated no errors, while patch cords of the
incorrect length returned error after error. De-embedded
electrical testing also confirms this result, in the form of
excessive return loss on the resonance producing lengths.
Consequently, the decision was made with the launch of the
TrueNet patch cord line to only include lengths which are
“safe” for use in Ethernet systems. These lengths are 4, 7, 10
and 15 feet, respectively. Other lengths from 1 to 20 feet
can produce unacceptable error generation under normal use.
All TrueNet cords are 100% performance tested and
factory terminated to the proper lengths to ensure
optimum performance.
KRONE: 800-775-KRONE www.kroneamericas.com www.truenet-system.com.
No part of this document may be reproduced without permission ©2000 KRONE, Inc.
NIC Patch Cord Connector Connector
Horizontal Cable
Patch Cord HUB
Figure 7: The patch cord represents the first, and most critical, connection point in the network.
Zero
Energy
Maximum
Energy
Maximum
Energy
Wavelength
Figure 6: As a sine wave is generated, the greatest amount of
energy is released at peaks of the cycle.
The philosophy of the TrueNet system is to eliminate the
root causes of poor throughput in structured cabling
systems. Fortunately, the benefits of patch cords that do not
have error-causing lengths is demonstrable in any cabling
system, even if no other TrueNet components are used.
Bottom line — certain lengths of patch cords generate
errors, others do not. KRONE is committed to providing only
the best possible data transmission solutions to the
marketplace. KRONE’s TrueNet patch cords have been
designed from the ground up to preserve the integrity of
Ethernet signals.
KRONE: 800-775-KRONE www.kroneamericas.com www.truenet-system.com.
No part of this document may be reproduced without permission ©2000 KRONE, Inc.
KRONE, Inc.
North America Headquarters
6950 South Tucson Way
Englewood, CO 80112-3922
Telephone: (303) 790.2619
Toll-Free: (800) 775.KRONE
Facsimile: (303) 790.2117
www.kroneamericas.com
www.truenet-system.com
Wavelength
Zero
Energy Maximum
Energy
Maximum
Energy
Resonance Producing Length
Non-Resonance Producing Length
Zero
Energy
NIC
NIC
Figure 8: TrueNet patch cords are available only in lengths “safe” for Ethernet systems.
All TrueNet cords
are 100% performance
tested and factory
terminated to the proper
lengths to ensure
optimum performance.


![Bài giảng Cáp mạng, vật tải truyền - GV. Lê Bá Thi [Chuẩn SEO]](https://cdn.tailieu.vn/images/document/thumbnail/2016/20160409/o0tchya0o/135x160/4531460212639.jpg)


![Bài giảng Tổ chức - Cấu trúc Máy tính II Đại học Công nghệ Thông tin (2022) [Mới Nhất]](https://cdn.tailieu.vn/images/document/thumbnail/2025/20250515/hoatrongguong03/135x160/8531747304537.jpg)