
EPJ Nuclear Sci. Technol. 6, 47 (2020)
c
K. Samuelsson et al., published by EDP Sciences, 2020
https://doi.org/10.1051/epjn/2020008
Nuclear
Sciences
& Technologies
Available online at:
https://www.epj-n.org
REGULAR ARTICLE
An improved method to evaluate the “Joint Oxyde-Gaine”
formation in (U,Pu)O2irradiated fuels using the GERMINAL V2
code coupled to Calphad thermodynamic computations
Karl Samuelsson1,∗,Jean-Christophe Dumas2,∗∗,Bo Sundman3, and Marc Lainet2
1KTH Royal Institute of Technology, Nuclear Engineering, 106 91 Stockholm, Sweden
2CEA, DEN, DEC, Centre de Cadarache, 13108, Saint-Paul-lez-Durance, France
3OPENCALPHAD, 9 All´
ee de l’Acerma, 91190 Gif-sur-Yvette, France
Received: 20 September 2019 / Received in final form: 2 December 2019 / Accepted: 21 February 2020
Abstract. In this work, two different thermodynamic softwares, ANGE using the TBASE database, and
OPENCALPHAD using the TAF-ID (Thermodynamics of Advanced Fuels – International Database), have been
integrated into the GERMINAL V2 fuel performance code (of the PLEIADES platform) in order to evaluate the
chemical state of (U,Pu)O2fuel and fission products in sodium cooled fast reactors. A model to calculate the
composition and the thickness of the “Joint-Oxyde Gaine” (JOG) fission product layer in the fuel-clad gap has
been developed. Five fuel pins with a final burnup ranging between 3.8 and 13.4% FIMA (Fissions per Initial
Metal Atom) have been simulated, and the calculated width of the fission product layer have been compared
with post irradiation examinations. The two different thermodynamic softwares have been compared in terms
of computation time and predicted fuel-to-clad gap chemistry. The main elements and phases encountered
in the fission productlayer have been identified, and the impact of the changing oxygen potential has been
explored.
1 Introduction
When oxide fuel pins are irradiated in a fast breeder
reactor (FBR), it has been observed that certain fission
products (FP) migrate down the temperature gradient
and form a layer between the fuel and the stainless steel
cladding. This layer of fission product compounds is com-
monly called JOG (for “Joint Oxyde-Gaine” in French)
[1], and the fact that its presence affects both heat trans-
fer and corrosion rates [2,3] has warranted attempts to
understand and predict its formation. Internal corrosion
weakens the cladding and increases the probability of fuel
failure, especially at high burnup [4]. As described in ref-
erence [1], JOG was first proposed as an explanation for
an inconsistency found in these PIE: if the large fuel-to-
clad gap that appears at high burnup had only been filled
with gas, it would certainly have caused fuel melting (due
to the poor heat conductivity of the gas). However, if the
gap was to be partly filled with fission product compounds
with higher thermal conductivity compared with the gas
plenum, the maximum fuel temperature would fall below
the melting point of the fuel. These FP would need to be
∗e-mail: karlsam@kth.se
∗∗ e-mail: jean-christophe.dumas@cea.fr
transported through the fuel towards the periphery due to
the effect of the thermal gradient. This could later be con-
firmed by experimental observations and measurements.
Inoue et al. [2] concludes, after studying irradiated MOX
fuel pins in the fast neutron JOYO reactor, that JOG evo-
lution is dependent on burnup, temperature, initial fuel
microstructure, and fission gas release. These variables
are of course not independent of one another. The exact
composition of this JOG layer has never been determined,
and the term itself can be seen as an umbrella term for any
FP that has deposited in the fuel-to-clad gap. While it is
believed to be rich in Mo and Cs oxides, the distribution
of phases is likely heterogeneous [5].
The GERMINAL V2 [6] fuel performance code, developed
by the CEA (French Alternative Energies and Atomic
Energy Commission) within the PLEIADES simulation plat-
form [7], is used to simulate the thermo-mechanical and
the physico-chemical behavior of (U,Pu)O2fuel during
irradiation in a fast neutron spectrum. In its current ver-
sion, the prediction of JOG thickness is described by a
model involving the amount of volatile FP (mainly cae-
sium) based on a correlation to the kinetics of the release
of the stable fission gases [6,8]. A threshold in burnup
as well as a thermal activation term are respectively
This is an Open Access article distributed under the terms of the Creative Commons Attribution License (https://creativecommons.org/licenses/by/4.0),
which permits unrestricted use, distribution, and reproduction in any medium, provided the original work is properly cited.
2 K. Samuelsson et al.: EPJ Nuclear Sci. Technol. 6, 47 (2020)
Table 1. Data for the simulated fuel pins. Predicted FGR fraction refers to the value predicted by GERMINAL V2. Both
this parameter and burnup are taken at the peak power node.
Name of Maximum Predicted FGR Initial ratio
Ph´
enix experiment burnup [%FIMA] fraction O/M Pu/M
Hadix-1 3.8 0.60 1.986 0.1979
Boitix-1 7.0 0.75 1.978 0.1945
Coucou-1 9.0 0.71 1.987 0.2022
Sphinx-1 11.2 0.82 1.983 0.2068
Nestor-3 13.4 0.90 1.975 0.2246
O-Oxygen, Pu-Plutonium, M-Metal, FGR-Fission Gas Release
used to reproduce the post-irradiation observations show-
ing no JOG formation at low burn-up and at low linear
power.
In the past years, several groups have worked on
implementing thermodynamic calculations inside fuel per-
formance codes in order to improve predictive abilities.
Baurens et al. [9] and later Konarski et al. [10] have cou-
pled ANGE together with the ALCYONE (also in the PLEIADES
simulation platform) in order to simulate, respectively,
stress corrosion cracking and oxygen thermodiffusion.
Simunovic et al. [11] have coupled THERMOCHIMICA [12] to
the mass and heat transport models of the BISON [13] fuel
performance code. Both these examples have been focus-
ing on the simulation of light water reactor fuel. Uwaba et
al. [14] at the Japan Atomic Energy Agency have recently
coupled the MLCYONE [15,16] caesium behavior simulation
code to the CEDAR [17] fast reactor fuel performance code.
This has allowed for predictions on the JOG chemistry
and geometry.
In this work, two different thermodynamic softwares,
both based on the Calphad method [18,19], have been
integrated into GERMINAL V2 in order to calculate the
chemical state of the fuel. Full in-pile simulations have
been performed on five fuel pins with different burnup
ranging between 3.8 and 13.4 %FIMA burnup. JOG thick-
ness has then been estimated on the basis of the predicted
chemical composition of the gap and the known molar
volumes of the involved phases. The two different thermo-
dynamic solvers, ANGE [20] and OPENCALPHAD [21,22], and
their respective databases have been compared in terms
time and prediction of JOG thickness and its composi-
tion. When available, results have been compared with
experimental results. In a separate set of stand-alone
calculations, the thermodynamic codes have also been
evaluated and compared in terms of computational cost.
2 Experiments
The operation of the Ph´
enix reactor between 1973 and
2010 associated with numerous post irradiation examina-
tions (PIE) by the CEA resulted in an extensive database
of fuel pin behavior under irradiation in a fast neutron
spectrum.
In this work, five fuel pins from the Ph´
enix fast breeder
reactor irradiated to different burnup (3.8, 7.0, 9.0, 11.2,
and 13.4 %FIMA at the maximum flux plane) have been
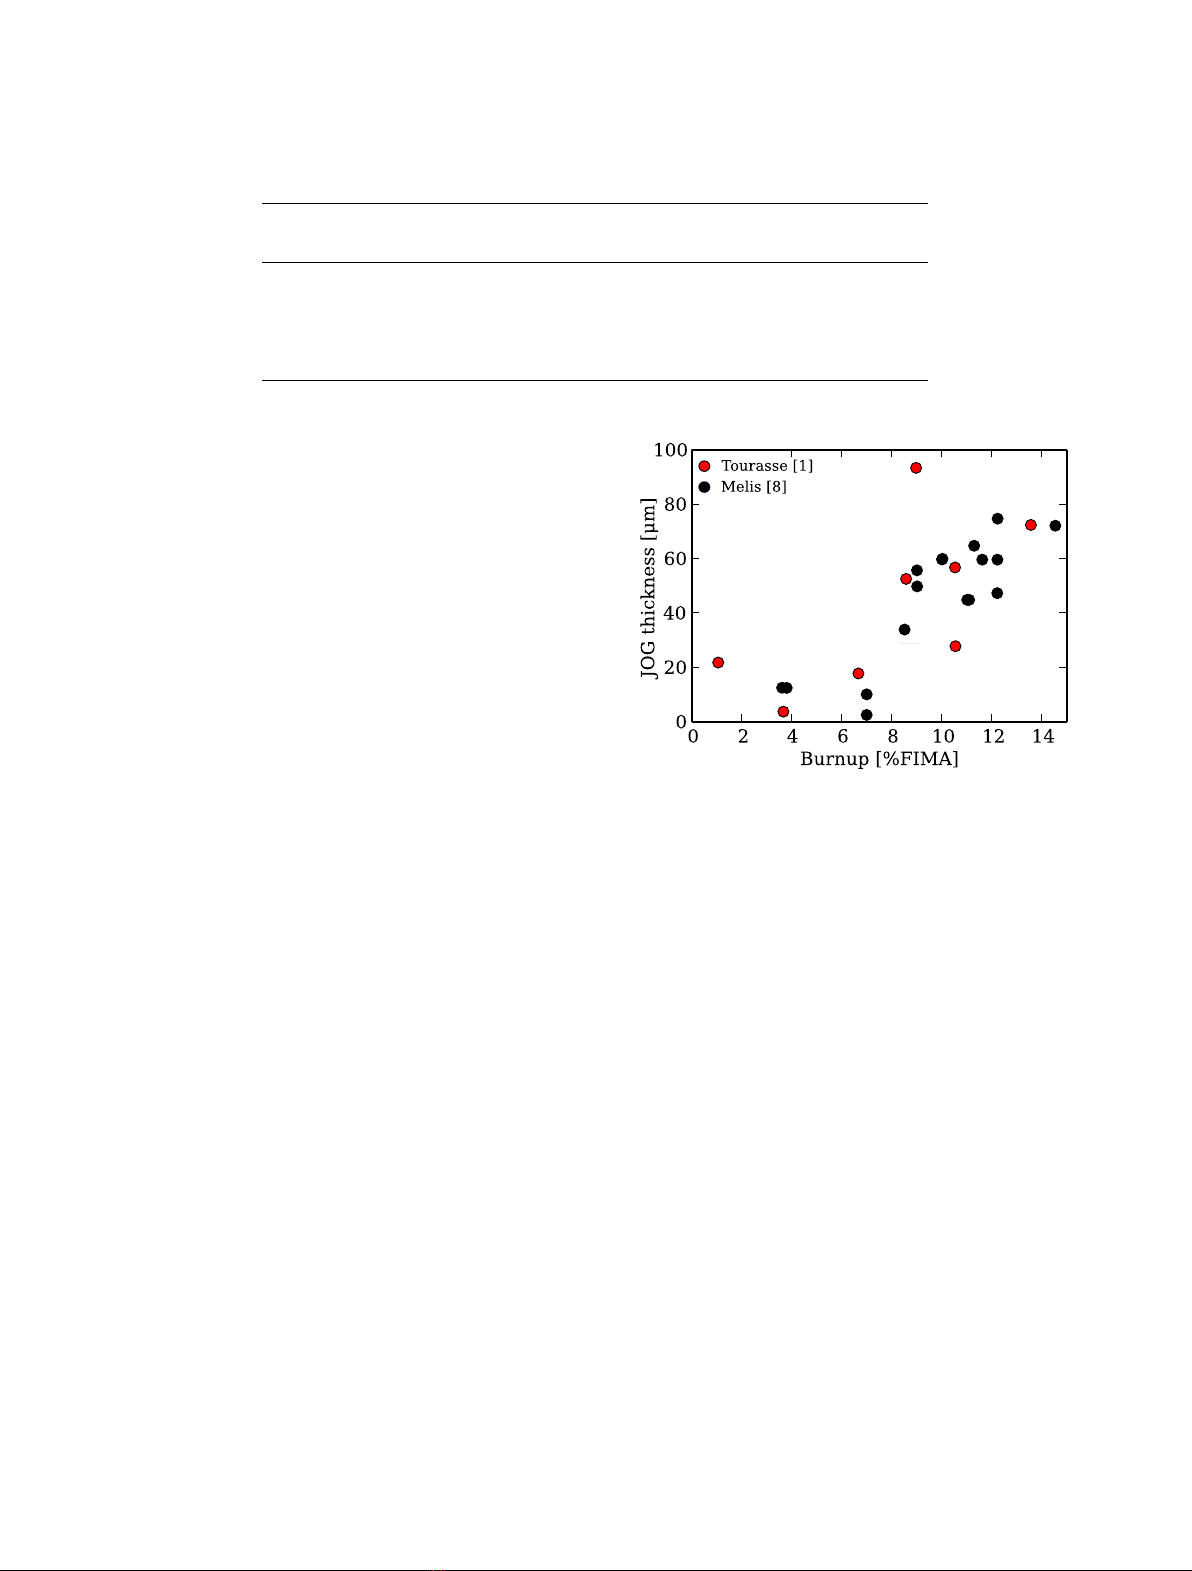
Fig. 1. Measured JOG thickness versus final burnup in some
SFR fuel pins irradiated in the Ph´
enix reactor. For reference [1],
the burnup values refer to the local burnup at which the
JOG was measured. For reference [8], the burnup refers to the
maximum burnup reached in the fuel pin.
simulated with GERMINAL V2. More information concerning
the fuel pins can be found in Table 1. Previous PIE have
given experimental values for measured JOG thickness of
fuel pins irradiated in the Ph´
enix reactor, see Figure 1. It
should be noted that these experimental values are mea-
surements of the fuel-to-clad gap, and are only assumed to
be equal to JOG thickness for reasons mentioned above.
The fuel pins were generating between 350 and 400 W/cm
and the highest temperatures reached at the peak power
nodes were, depending on the fuel pin between 2200 and
2400 K (based on the GERMINAL V2 simulations).
3 Method
3.1 Thermodynamic software and databases
For the calculations, two different software-database com-
binations have been used and compared:
– ANGE (Advanced Numeric Gibbs Energy minimizer)
[20], co-developed by CEA and EDF (Electricit´
e de
France), based on the SOLGASMIX [23–25] software.

K. Samuelsson et al.: EPJ Nuclear Sci. Technol. 6, 47 (2020) 3
– OPENCALPHAD open source software [21,22] using the
TAF-ID [26,27] database which is the result of the
merging of several databases (including TBASE).
The main advantage of OPENCALPHAD is its ability to
utilize better thermodynamic models in the newer (and
still growing) TAF-ID database, but comes at the price
of increased computational time as will be discussed in
Section 3.2. The purpose of the TAF-ID project, coor-
dinated by the Organization for Economic Co-operative
Development Nuclear Energy Agency (OECD/NEA), is
to provide a comprehensive thermodynamic database
on nuclear fuel materials to perform a wide range of
thermodynamic calculations for different applications of
nuclear reactors. This database can be seen as a synthe-
sis of different databases (including TBASE) developed
independently in different countries and has been pro-
gressively extended for five years by introducing either
models coming from research and/or databases of the
participants of the project, or coming from the open
literature. It has been decided to adopt a full Calphad
modeling approach for this database in order to provide
both phase diagram and thermodynamic data calcula-
tions. Here, the description of the (U,Pu,Ln)O2±xphase
is based on the Compound Energy Formalism (CEF) [28]
model of Gu´
eneau et al. [29]. This phase, made up by
three sublattices, can be written as (Ba2+, Ce3+, Ce4+,
Gd3+, La3+, Pu3+, Pu4+, U3+, U4+, U5+, Zr2+, Zr4+)1
(O2−,Va)2(O2−,Va)1where Va indicates a vacancy.
For the liquid phases, the two sublattice ionic model
[30,31] was chosen. To present the possible constituents it
may be expressed as: (Ba2+,Ce3+,Cs+,Gd3+,La3+,Mo4+,
Pd2+,Pu3+,Ru4+,U4+, Zr4+)P(I−, MoO2−
4, O2−, VaQ−,
CeO2, CsO2, Cs2Te, I2, MoO3, O, Te, PuO2, TeO2)Q.
The TAF-ID describes the main metallic phase (also
called “white phase”) encountered in examinations of spent
fuel [32] as an HCP structure with two sublattices: (Ba,
Ce, Cs, Gd, Mo, Pd, Pu, Ru, U, Zr)1(O, Va)0.5.
One of the main oxide phases encountered is the
perovskite structured BaZrO3[32]. This phase is some-
times referred to as the “gray phase”, and in the
TAF-ID it is expressed (within the CEF) as: (Ba2+)1
(Ba2+,U4+,U6+,Zr4+)1(O2−)3. Other fission product
phases such as CsI, Cs2Te, Cs2MoO4, and BaMoO4are
treated as stoichiometric compounds, which means that
their compositions are fixed and their Gibbs energy func-
tions depend only on temperature and pressure. Up to
now, the TAF-ID can be directly used with THERMO-
CALC [33] or OPENCALPHAD codes and a thermodynamic
database converter has recently been developed in order
to be able to use it with FACTSAGE (in CHEMSAGE format).
Parts of the TAF-ID was converted to this format for
use in the THERMOCHIMICA-BISON coupling mentioned in the
introduction [34].
TBASE [35,36], on its side, is a thermodynamic
database elaborated at ECN Petten (Netherlands) in
the 1990’s which contains mainly stoichiometric com-
pounds from reference [37]. This is the case for most solid
phases, and all liquid phases. The two notable excep-
tions concern the fluorite fuel phase and the metallic
“white phase”. The thermodynamic description of the
fuel phase is represented by the variable stoichiometry
species model of Lindemer & Besmann [38–40]. It can be
written as a solution between the following constituents:
UO2, U2O4.5, U3O7, MoO2, MoO3, Cs2O, Cs2O2, CsO2,
Gd4
/3O2, UGd2O6, La4
/3O2, ZrO2, BaUO4, BaO, U1
/3,
U1
/3Pu4
/3O2, CeO2, Ce4
/3O2, Pu4
/3O2, and PuO2. The
metallic phase is defined as an ideal solution between Mo,
Ru, and Pd. It can be noted that in all definitions above,
only the elements used in this work has been included
in the expression of the phases. Moreover, the TAF-ID,
unlike the TBASE description, includes heat capacity data
for most phases. While heat capacity data is not required
to perform the calculations presented in this work, a future
improvement of the GERMINAL V2 code could be to couple
the results of the thermodynamic model to the heat trans-
fer model. If this were to be done, the heat capacity data
for the involved phases would be necessary.
3.2 Computation times
A complete fuel pin simulation with GERMINAL V2 can
require millions of equilibrium calculations, implying a
huge computational cost associated to the thermodynamic
software.
A number of test equilibrium calculations were per-
formed by OPENCALPHAD and ANGE over a temperature
range of 500–2500 K, with a composition corresponding
to a (U0.78,Pu0.22)O1.975 fuel pin irradiated to 13.4 %FIMA
burnup. Here, in order to facilitate the performance eval-
uation, both solvers were used in their stand-alone mode,
i.e., not coupled to GERMINAL V2. The composition was
taken from previous calculations performed by the ERANSO
code [41] using nuclear data from the JEFF-3.1 [42]
project library. As can be seen in Table 2, 15 element
groups representative of the FP, the actinides, and the
oxygen were considered in the equilibria.
3.3 GERMINAL V2 fuel performance code
The GERMINAL V2 fuel performance code is being developed
by the CEA, and works under the PLEIADES simulation
platform [7]. The code implements a 11
/2-D approach for
the discretization of the fuel pin geometry. This means
that the pin is divided into axial cells, and each axial cell
is then divided into radial cells by assuming cylindrical
symmetry. Here, one radial cell may represent either the
fuel itself, the gap, or the cladding. One simulation is then
divided into different timesteps.
In reality, the relevant physical phenomena, e.g.
swelling, temperature distribution, cracking, actinide and
oxygen redistribution etc. are all coupled to one another.
In order to describe all these phenomena, GERMINAL V2
uses a scheme of nested convergence loops. In practice
this means that one timestep consists of one loop over
the axial cells, and within the evaluation of each axial
cell another convergence loop solves the necessary equa-
tions within each radial cell. The modeling of the thermal
and mechanical behavior is treated by the finite element

4 K. Samuelsson et al.: EPJ Nuclear Sci. Technol. 6, 47 (2020)
Table 2. Composition of equilibrium calculation used to
evaluate time requirements of the different codes. The
composition corresponds to (U0.78,Pu0.22)O1.975 fuel pin
irradiated to a burnup of 13.4 %FIMA.
Element Amount [mole]
Ba (+Sr) 1.6870 ×10⁻²
Ce (+Pr) 2.0673 ×10⁻²
Cs (+Rb) 2.4239 ×10⁻²
Gd (+Nd +Pm +
Sm +Eu) 3.0816 ×10⁻²
He (+Kr +Xe) 3.4776 ×10⁻²
I (+Br) 2.3253 ×10⁻³
La (+Y) 1.0105 ×10⁻²
Mo 2.9302 ×10⁻²
O1.9750
Pd (+Ag +Cd +
In +Sn +Sb) 2.5383 ×10⁻²
Pu (+Am +Cm +Np) 1.8737 ×10⁻¹
Ru (+Tc +Rh) 4.1675 ×10⁻²
Te (+Se) 5.3815 ×10⁻³
U6.7757 ×10−1
Zr (+Nb) 2.7160 ×10⁻²
solver CASTEM2000 [43]. The description of clad mechan-
ical behavior (irradiation and thermal-activated creep,
irradiation-induced swelling, plasticity in transient con-
ditions) allows to account for clad deformation when
evaluating the fuel-to-clad gap width. The chemical com-
position at each radial node of the fuel is obtained from
a simplified neutronic module implementing an isolated
resolution of the Bateman equations.
The coupling of GERMINAL V2 with a thermodynamic
software (ANGE or OPENCALPHAD) elaborated in the frame
of this work allows the thermodynamic equilibrium cal-
culation at each node of the fuel pellet, and based on
the amount of gas and liquid that is found, along with
the fission gas release fraction, a corresponding amount
is released into the fuel-to-clad gap. The volatile release
fraction is taken to be equal to that of the inert fission
gases, which is an assumption with some experimental jus-
tification [44]. The model used to calculate the fission gas
release is described in reference [6].
This kind of thermodynamic calculation is used to find
the equilibrium state of the chemical system defined by
its composition, temperature, and pressure. It does not
give information regarding the kinetics of the chemical
reactions. For the calculations performed inside the fuel
performance code in this work, the equilibrium state
is assumed to occur instantaneously due to the high
temperature.
Currently, the fuel equilibrium calculations involve 15
representative elements listed in Table 2, where the
elements that have been regarded as identical to its rep-
resentative element are shown in the parenthesis. For
example, Ba (+Sr) means that the molar amount of Sr has
been added to the amount of its representative element
Ba.
– Ba and Sr were grouped together since they are both
believed to be (mainly) found in the Ba(Zr,U)O3and
Sr(Zr,U)O3[45,46]. Their binary phase diagram shows
a large degree of mutual solubility [47].
– Ce and Pr are both expected to be found in solution
with the fuel matrix [45].
– Cs and Rb are both alkali metals and are expected to
behave similarly [45].
– Gd, Nd, Pm, Sm, and Eu are all rare earth metals
and are expected to be found in solution with the fuel
matrix [32,45].
– He, Kr, and Xe are noble gases and do not react
chemically with the fuel [32].
– I and Br are both halogens, easily volatilized, and
grouped together in Ref. [45]. Br itself is not described
by the TAF-ID.
– La and Y are believed to stay in the fuel matrix, both
with valency +3 [45].
– Pd, Ag, Cd, In, Sn, and Sb are all chemically repre-
sented by Pd. They have been found in solution with
each other [32]. These elements are expected to form
metallic precipitates.
– Pu, Am, Cm, and Np are all represented by Pu since
they are expected to stay in the fuel matrix. These ele-
ments form fluorite structure dioxides, all with similar
lattice parameters [48].
– Ru, Rh, and Tc are all expected to form metallic pre-
cipitates together with the Pd-group and Mo [49]. They
are grouped together and represented by Ru.
– Te and Se both belong to the chalcogen group in the
periodic table, and have fairly similar chemical prop-
erties [50,51], and are represented by Te since it is the
more abundant and well studied element of the two [32].
– Zr and Nb are commonly grouped together [45]. While
this has been done in this work as well, it is of little
consequence due to the low fission yield of Nb.
The decision to make groups of representative elements
was made due to the demand to keep computational cost,
complexity, and failure rates sufficiently low while still
describing a chemical system as close as possible to the
real one. In addition, elements needed to be grouped
when they were not described in both databases, since
the comparison required that the same input was used in
all cases.
Among the main parameters for fuel chemistry simula-
tion is the radial oxygen redistribution, and in GERMINAL
V2 it is based on the work of Aitken [52]. At each axial
cell, the average O/M ratio is calculated by a correlation
based on the burnup, and then, depending on the radial
temperature profile, the O/M radial redistribution is cal-
culated, fixing for each radial cell its local O/M ratio. Here
O/M refers the ratio between oxygen atoms and metallic
atoms in the fluorite phase. An equilibrium calculation in
each radial cell will tell the code how much of each element
is found in a volatile phase.
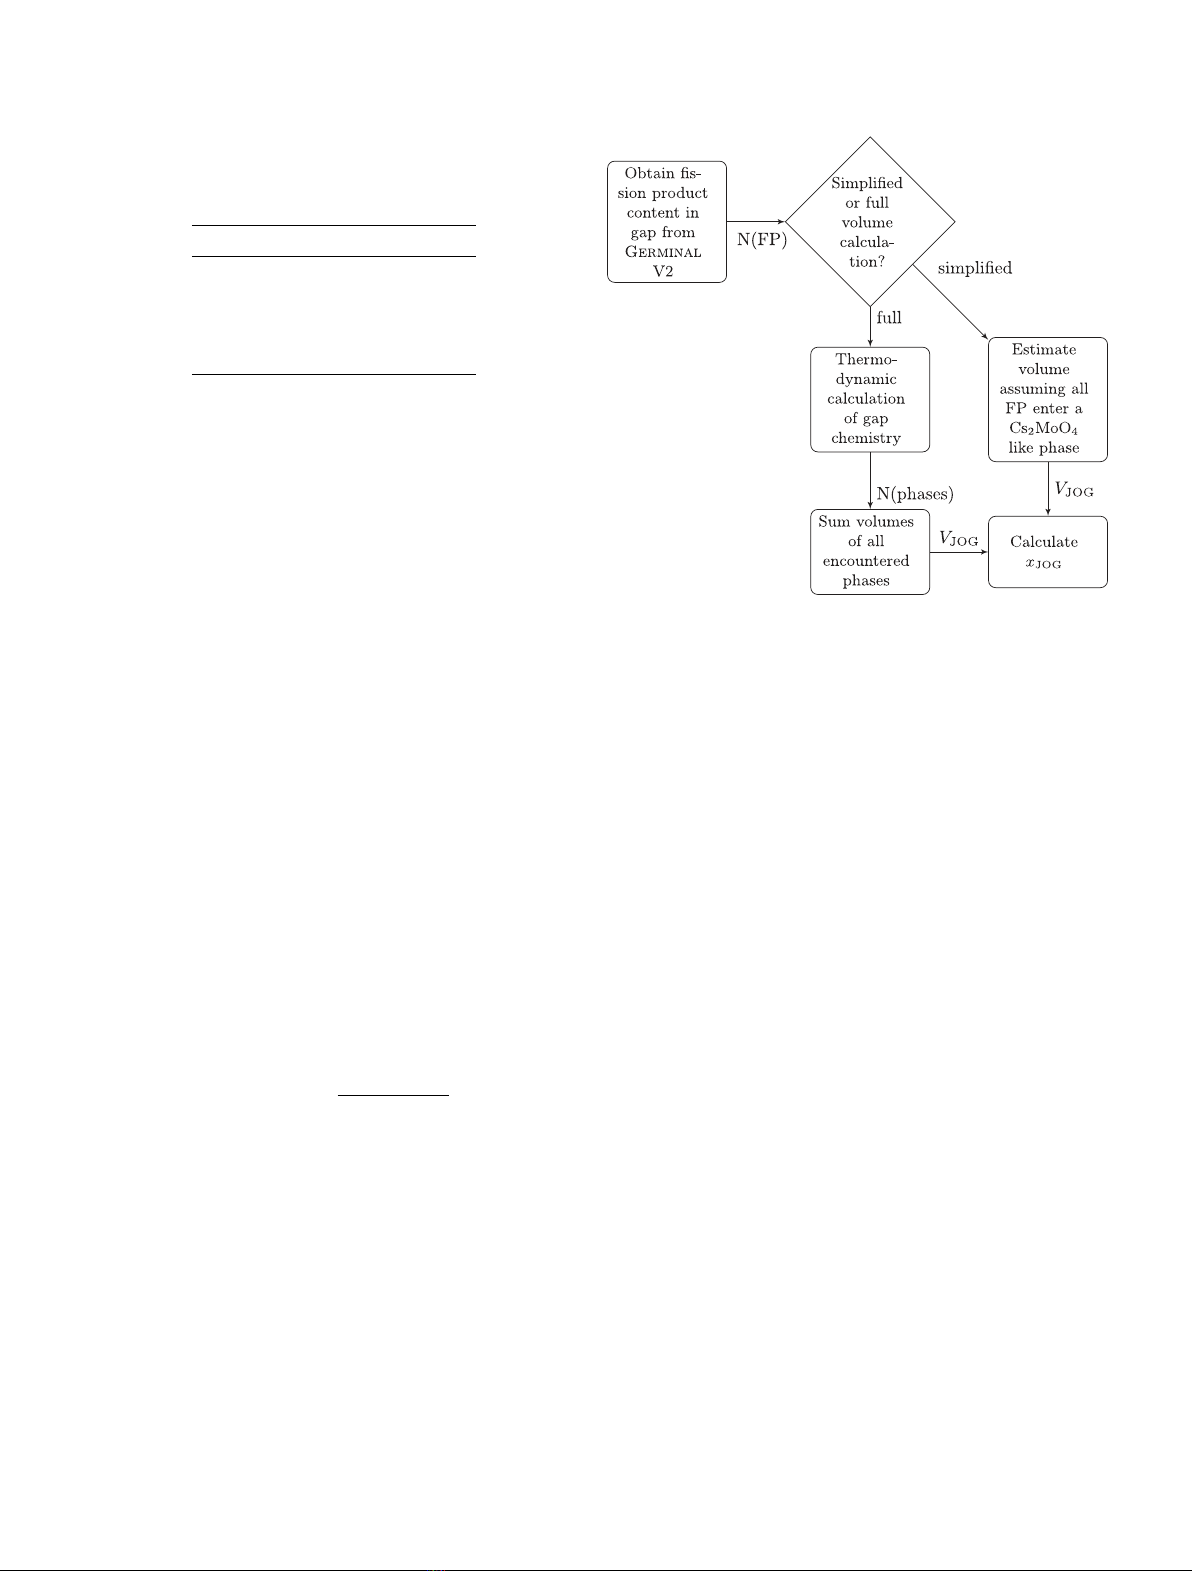
Once the amount of released FP has been calculated,
the JOG thickness calculation can be summarized into the
following steps:
K. Samuelsson et al.: EPJ Nuclear Sci. Technol. 6, 47 (2020) 5
Table 3. Data used for calculations described in
Section 3.3. In all cases, the solid density has been used
for both the solid and liquid phases.
Compound ρ[g/cm3] Ref.
Cs2UO46.6 [57]
Cs2Te 4.25 [58]
CsI 4.53 [59]
Cs2MoO44.38 [60]
BaUO37.58 [61]
– Obtain the molar quantity of each phase in the gap
by performing a thermodynamic calculation with the
released element quantities as input data.
– Estimate the molar volume of each phase found in
the gap by thermodynamic calculation based on their
density (see Tab. 3) and molar mass.
– Calculate the total JOG volume by summing the vol-
ume contribution of each phase. Alternatively, in a
simplified approach, the JOG volume can be approx-
imated by omitting the thermodynamic evaluation of
the gap, and assuming that all released FP will enter
an imaginary phase with a molar volume equal to that
of Cs2MoO4, as it is believed to be the main JOG com-
ponent [1,53,54]. Since oxygen is not included in the
transport model, one mole of volatile fission products
produces one third of a mole of this Cs2MoO4like imag-
inary phase (two moles of volatile Cs and one mole of
volatile Mo makes one mole of Cs2MoO4). The amount
of available oxygen is assumed to be sufficient to oxidize
with all the released FP. From a more general point
of view, choosing a Cs2MoO4like phase to represent
all of the JOG is practical for the simulation of heat
transfer in GERMINAL V2 since its thermal conductivity
is relatively well studied [55,56].
– Regardless of how the JOG volume is obtained, by
assuming that the JOG layer is uniform in thickness
within each axial slice, JOG thickness, xJOG, can be
calculated by the equation:
xJOG =VJOG
2hπrfuel-outer
(1)
where VJOG is the JOG volume, his the height of the
axial slice, rfuel-outer is the outer radius of the fuel.
The process can be summarized into the flowchart
presented in Figure 2.
In the chemical simulation of the fuel, the 15 families
of elements from Table 2 are considered for both soft-
wares, and in the computational model, the following FP
were considered volatile and thus to be potential compo-
nents of the JOG: barium, caesium, iodine, molybdenum,
palladium, and tellurium. In addition to the volatile fis-
sion products, the thermodynamic evaluation of the gap
included uranium, plutonium, and oxygen. Here, uranium
and plutonium were added to allow the gap components
to react with the outer wall of fuel.
Fig. 2. Flowchart presenting the scheme for calculating the JOG
width based on the predicted elements found in the gap.
Molybdenum and caesium were included since
Cs2MoO4is commonly believed to be the main JOG
component [1], while barium, tellurium, palladium, and
iodine may vaporize at the relevant fuel temperatures and
are considered as volatile fission products [3]. In the PIE
of one of the fuel pins mentioned in Section 2, all the
considered elements had elevated concentrations in the
fuel-to-clad gap.
At room temperature, where the JOG width measure-
ments were performed, there is no stable liquid phase.
This is not the case for the in-pile conditions, where tem-
perature can reach around 1000 K in the gap. Thus, when
calculating the JOG thickness using the method above,
there may be liquid phases present. Whether or not these
liquids contribute to the JOG thickness is unclear, since it
is not known to what extent they migrate axially. In any
case, it is not expected to occur at the same rate as the
radial migration since the temperature gradient is at least
three orders of magnitude smaller. Available oxygen in the
gap is another factor which complicates the JOG width
calculations. While it is obvious that oxygen should be
included in the thermodynamic evaluation of the gap, the
true amount is not known. In this work, (U0.8,Pu0.2)O2±x
was added to the equilibrium to allow the gap components
to react with the fuel. Using this method, it was possible
to adjust the oxygen content so that the impact of oxy-
gen potential could be explored. This analysis was only
done on the fuel pin with highest burnup, and was carried
out by including slightly hypo- and hyper-stoichiometric
fuel to the JOG composition. The oxygen redistribution
that occurs due to the thermal gradient tends to keep the
peripheral O/M ratio close to 2, both before and after the
increasing burnup causes the global O/M ratio to reach or
even surpass 2 [5,62]. The purpose of these calculations
was to investigate how the JOG composition changes at


![Đề ôn tập cuối kỳ môn Kỹ thuật nhiệt - Nhiệt động học [mới nhất]](https://cdn.tailieu.vn/images/document/thumbnail/2026/20260310/hoaphuong0906/135x160/60681773197823.jpg)

![Bài giảng thang máy và thang cuốn: Tổng hợp kiến thức [chuẩn nhất]](https://cdn.tailieu.vn/images/document/thumbnail/2026/20260310/hoaphuong0906/135x160/41471773283876.jpg)
