Genome-wide analysis of clustering patterns and flanking characteristics for plant microRNA genes Meng Zhou1,*, Jie Sun1,*, Qiang-Hu Wang1,*, Li-Qun Song2, Guang Zhao1, Hong-Zhi Wang2, Hai-Xiu Yang1 and Xia Li1
1 College of Bioinformatics Science and Technology, Harbin Medical University, Harbin, China 2 Department of Internal Medicine, Affiliated Hospital of Heilongjiang University of Chinese Medicine, Harbin, China
Keywords clustering patterns; flanking regions; motif; plant microRNA gene; sequence characteristics
Correspondence Xia Li, College of Bioinformatics Science and Technology, Harbin Medical University, Harbin 150081, China. Fax: +86 045186615922 Tel: +86 045186669617 E-mail: lixia@hrbmu.edu.cn
*These authors contributed equally to this work
(Received 11 October 2010, revised 7 December 2010, accepted 7 January 2011)
doi:10.1111/j.1742-4658.2011.08008.x
MicroRNAs (miRNAs) have been proven to play important roles at the post-transcriptional level in animals and plants. To investigate clustering patterns and specific sequence characteristics in the flanking regions of plant miRNA genes, we performed genome-wide analyses of Arabidopsis thaliana, Populus trichocarpa, Oryza sativa and Sorghum bicolor. Our results showed that miRNA pair distances were significantly higher than would have been expected to occur at random and that the number of miRNA gene pairs separated by very short distances of < 1 kb was higher than of protein-coding gene pairs. Analysis of the promoter architecture of different miRNA genes in plants revealed significant differences in the number and distribution of core promoters between intergenic miRNAs and intragenic miRNAs, and between highly conserved miRNAs and low conserved or nonconserved miRNAs. We applied two motif-finding algo- rithms to search for over-represented, statistically significant sequence motifs, and discovered six species-specific motifs across the four plant spe- cies studied. Moreover, we also identified, for the first time, several signifi- cantly over-represented motifs that were associated with conserved miRNAs, and these motifs may be useful for understanding the mechanism of origin of new plant miRNAs. The results presented provide a new insight into the transcriptional regulation and processing of plant miRNAs.
Introduction
nucleotides
(miRNAs), (cid:2)21–24
excised from pre-miRNAs
MicroRNAs in length, are a large class of endogenous, noncoding small RNA molecules that regulate gene expression at the post-transcriptional level in animals and plants [1–4]. The first microRNA – lin-4 – was discovered in 1993 in Caenorhabditis elegans through forward genetic screens [5]. The first plant miRNA was dis- covered in Arabidopsis thaliana in 2002 [6,7]. Plant miRNA genes are mostly transcribed into primary miRNA transcripts (pri-miRNAs) by RNA polymer-
ase II (Pol II). The pri-miRNAs are processed by DICER-LIKE 1 (DCL1) into stem–loop pre-miRNAs in the nucleus. Then, pre-miRNAs are processed by DCL1 in the nucleus and exported to the cytoplasm, possibly through the action of the plant exportin 5 or- thologue HASTY and other unknown factors. Mature (miR- RNA duplexes NA ⁄ miRNA*, where miRNA is the guide strand and miRNA* is the degraded strand) are methylated by HEN1. The guide miRNA strand is then incorporated
FEBS Journal 278 (2011) 929–940 ª 2011 The Authors Journal compilation ª 2011 FEBS
929
Abbreviations miRNA, microRNA; Pol II, RNA polymerase II; pri-miRNAs, primary miRNA transcripts; TSSs, transcription start sites.
M. Zhou et al. Clustering and flanking characteristics for plant miRNAs
Results and Discussion
into AGO proteins to carry out the silencing reactions [1,2].
Analysis of clustering patterns of miRNA genes in four plant genomes
II promoters
In plants, Xie et al. [8] identified transcription start sites (TSSs) for 63 miRNA primary transcripts in A. thaliana and found the TATA box motif in their core promoter regions. Unlike animal miRNAs, the vast majority of plant miRNAs are intergenic but not intronic [2,9]. Several studies have characterized the upstream sequences of intergenic miRNAs in model organisms and found the same type of promoters as in the intergenic the protein-coding genes of most of miRNAs [10–12]. Furthermore, Zhou et al. [11] also discovered some interesting sequence motifs that are specific to intergenic miRNAs in four different model species. For all other miRNAs located within the introns of protein-coding genes, little is known about their transcriptional regulatory element. These intra- genic miRNAs are possibly transcribed with, or inde- pendently of, the host genes. Recently, Heikkinen et al. [13] examined the upstream sequences of miR- NAs in C. elegans and Caenorhabditis briggsae, and discovered a sequence motif – GANNNNGA – com- mon to all miRNAs, including intragenic miRNAs. In rice (Oryza sativa), some intragenic miRNAs were found to contain class in upstream sequences [10]. However, the complex transcriptional regulation mechanisms of plant miRNAs still remain largely unknown.
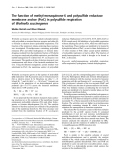
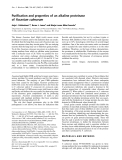
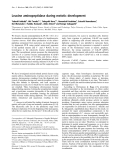
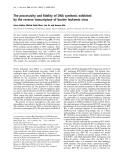
Many previous studies have shown that miRNA genes tend to be present as clusters within a region of several kilobases in animal genomes [17–20]. In contrast, plant miRNA genes are rarely arranged in tandem [1]. To further explore the clustering patterns of miRNAs in plant genomes, we computed the distances between same-strand consecutive miRNA genes of four plant species to analyze the distance distribution of miRNA genes in different plant species based on reported miR- Base coordinates. The cumulative distance distribution of the miRNA gene pairs is presented in Fig. 1 and shows that 17.71%, 26.94% and 29.07% of the miR- NA gene pairs are separated by regions of < 1, 10 and 100 kb, respectively, which are much smaller than the regions separating animal miRNA gene pairs. Fur- thermore, we compared the distance distribution of the miRNA gene pairs with the distance distribution of protein-coding genes in four plant genomes (Fig. 1). We found that more miRNA gene pairs than protein- coding gene pairs were separated by very short dis- tances of < 1 kb. To evaluate the statistical signifi- cance of the clustering patterns of miRNA genes in the four plant species studied, we also compared the distances of the miRNA gene pairs with random dis- tances, as described in the Materials and methods, and found that the miRNA gene pair distances were statis- tically significantly higher than expected at random (P < 0.001). To identify more characteristics of miR- NA clusters in plant genomes, we defined 10 kb as the maximum inter-miRNA distance for two miRNA genes to be considered as clustered because 26.94% of the miRNA gene-pair distances were < 10 kb and extending the threshold to 100 kb added relatively few miRNA gene pairs. Furthermore, the relatively small distance prevented overestimation of the number of clusters and made our analysis more stringent. Accord- ing to this definition, we examined the characteristics of potential clusters within maximum inter-miRNA distance of 2-,5- and 10-kb (Table 1). Our study revealed that the number of members in miRNA clus- ters at very short gene-pair distances in O. sativa and Sorghum bicolor was significantly larger than in A. tha- liana and Populus trichocarpa (P < 0.01; two-sample t-test). This may suggest that miRNA clusters in monocots are larger than those in eudicots. This spe- cific clustering pattern of miRNAs may be indicative the miRNA cluster in of
functional divergence of
Although many efforts have been directed towards examining clustering patterns and the sequence charac- teristics of the upstream sequences of miRNA genes in animals in an attempt to understand transcriptional regulation [11,13–16], similar analyses have been per- formed only for a relatively small number of miRNAs in plants, and these were limited to A. thaliana and O. sativa. Recently, increasing numbers of plant miRNAs have been identified through forward genet- ics, direct cloning and computational prediction. An increasing number of plant miRNAs provide a good opportunity to uncover complex transcriptional regu- lation mechanisms for plant miRNAs. In our study, we performed computational approaches, based on genome-wide analyses, to examine the clustering pat- terns of plant miRNAs. In addition, we analyzed regions, up to 2 kb upstream and up to 1 kb down- stream, of miRNA stem–loop sequences in four plant species, to identify characteristic sequence motifs. We hope that the present results can improve the current understanding of transcriptional regulation and pro- cessing of plant miRNAs and provide useful knowledge for understanding the mechanism of the origin and computational identification of new miRNAs in plants.
FEBS Journal 278 (2011) 929–940 ª 2011 The Authors Journal compilation ª 2011 FEBS
930
M. Zhou et al. Clustering and flanking characteristics for plant miRNAs
Fig. 1. Cumulative distance distribution of miRNA genes and protein-coding genes in four plant species. The neighbour distances between every two same-strand miRNA genes or protein-coding genes in the same chromosome were calculated. The distance is drawn on a loga- rithmic scale.
clusters for plants may be involved in gene dosage effect.
Analysis of the core promoter of the class II promoter in plant miRNA genes
if
the pairwise distance of
II promoters
miRNA-mediated gene regulation between monocots and eudicots. Furthermore, miRNA clusters in plants are frequently found to have smaller size of cluster compared with miRNA clusters in animals (P < 0.01; two-sample t-test). In animals, a large proportion of known miRNAs are arranged in clusters. For example, 48% of human miRNAs appear as clusters within a maximum inter-miRNA distance of 10 kb [21] and 50% of miRNAs appear as clusters within a maximum inter-miRNA distance of 3 kb in the zebrafish genome [22]. In contrast to patterns of clustering found in ani- mal miRNAs, only a small proportion of plant miR- NAs (25.35% in A. thaliana, 17.09% in P. trichocarpa, 22.29% in O. sativa and 21.62% in S. bicolor) were found to be clustered within a 10-kb region in our study. It has been demonstrated that miRNA families are preferentially expressed in eudicots relative to monocots [23]. Our analysis further indicated that most plant miRNA clusters are composed of family members and are located in intergenic regions, which is consistent with previous studies in plants [10,24,25]. Our results imply that the size of the miRNA cluster may contribute to preferential expression in eudicots relative to monocots. Li et al. [25] suggested that the co-transcription of similar or identical miRNAs in
miRNA genes were determined to be part of the poly- cistronic transcript two miRNAs on the same chromosome was < 10 kb. For miRNAs in polycistronic transcripts, only sequences upstream of the 5¢ pre-miRNAs and downstream of the 3¢ pre-miRNAs were chosen to represent the poly- cistronic transcript. As described in the Materials and methods, we used the TSSP-TCM program to initially search for the putative core promoter of the class II promoter occurring in 2-kb upstream sequences of miRNAs in the four plant species studied. We identi- fied 130 (77.8%) miRNAs in A. thaliana, 145 (89%) miRNAs in P. trichocarpa, 233 (71.5%) miRNAs in O. sativa and 102 (81.6%) miRNAs in S. bicolor to contain the core promoter of the class II promoter, suggesting that a significant proportion of plant in miRNA genes have resident Pol upstream regions. It is generally accepted that miRNA genes located in the intronic regions as part of the host
FEBS Journal 278 (2011) 929–940 ª 2011 The Authors Journal compilation ª 2011 FEBS
931
i
A N R m
f o
e g a t n e c r e P
M. Zhou et al. Clustering and flanking characteristics for plant miRNAs
r e b m u n
i
s e c n a t s D
2 8 . 1
9 6 . 2
1 1 . 3
6 8 . 1
e g a r e v a
l
e h T
e g a r e v A
2 1 . 3
7 5 . 2
5 3 . 2
7 6 . 2
. s r e t s u c
d
n
i
l
4 5
0 4
2 3
d e t a c o
l
. s r e t s u c
s r e b m e M
3 0 1
n
i
b k
s e n e g
l
r e t s u C
1 2
7 1
3 3
2 1
0 1
d e t a c o
l
i
A N R m
f o
s e n e g
e g a t n e c r e P
% 9 2 . 2 2 % 5 3 . 5 2 % 9 0 . 7 1 % 2 6 . 1 2
i
A N R m
f o
e g a t n e c r e p
i
0 4 . 1
3 3 . 2
8 0 . 1
s e c n a t s D
4 1 . 1
e h T
f
r e b m u n
l
e h T
7 4 . 2
6 3 . 2
1 2 . 3
7 . 2
e g a r e v A
. r e t s u c
c
a
n
i
l
. s r e t s u c
2 4
3 3
0 9
7 2
s r e b m e M
s e n e g
i
b k
i
l
7 1
4 1
8 2
0 1
r e t s u C
5
d e t c d e r p
f
A N R m o w
f o
t
% 2 7 . 9 1 % 8 4 . 9 1 % 1 . 4 1 % 4 2 . 8 1
r e b m u n
e g a t n e c r e P
n e e w t e b
e h T
% 9 6 . 7 % 2 0 . 5 1 % 2 0 . 6 1 % 6 1 . 2 1
from their own promoter. However,
b
i
i
e c n a t s d
i
i
. s e c e p s
7 6 . 0
5 4 . 0
8 4 . 0
6 3 . 0
e s e c n a t s D
. s e c e p s
l
t n a p
e g a r e v a
l
t n a p
r u o f
2
3
3 1 . 2
5 8 . 2
d e g a r e v A
e h T
n
i
e
r u o f
n
i
i
l
i
s r e t s u c
. s e c e p s
8 1
8 1
2 3
4 7
c s r e b m e M
d e d u t s
l
i
t n a p
A N R m
b k
l
9
6
f o
r u o f
s e n e g
5 1
6 2
b r e t s u C
2
e h t
i
r o f
A N R m
i
3 1 2
4 3 2
2 6 4
8 4 1
a s A N R m
f o
l
r e t s u c
nonconserved miRNAs
and
n o i t a z i r e t c a r a h C
a
n
a n a
l
i
. 1
r e b m u n
i l
i
i
a v i t a s
a h t
a p r a c o h c i r t
r o o c b
.
e h T
.
.
.
s e n e g
P
O
S
A
s e c e p S
a
e l b a T
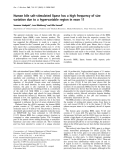
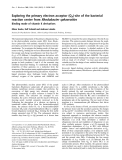
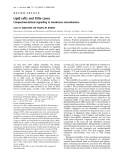
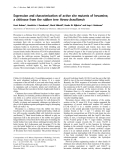
gene are expressed from the host gene promoters [26,27]. However, a recent study on intergenic ⁄ intronic and conserved ⁄ nonconserved miRNA genes in rice revealed that several intronic miRNA genes in rice have a class II promoter, and rice miRNAs with more than one promoter appear to be conserved [10], thus implying that different sequence characteristics may be presented in upstream regions of different miRNA genes in plants. To further explore the promoter archi- tecture of different miRNAs in plants and the relation- ship between the number of Pol II promoters and the degree of conservation of miRNAs, we classified four plant miRNA genes into two types (intergenic miR- NAs and intragenic miRNAs) based on their genomic locations. Then, the miRNAs from the four plant spe- cies studied were divided into three groups (based on evolutionary conservation across all plant species, as described in the Materials and methods): highly con- served miRNAs, low conserved miRNAs and noncon- served miRNAs. The results are summarized in Fig. 2. As shown in Fig. 2A, we found a significant difference between intergenic miRNAs and intragenic miRNAs in the numbers of class II promoters in the upstream regions (P < 0.001; two-sample t-test). The miRNAs lying between protein-coding genes usually contained more class II promoters in their upstream sequences (on average 1.4 per miRNA) than those miRNAs lying within the introns (on average 0.7 per miRNA) in the four plant species studied. These results strongly indi- cate that most intergenic miRNAs are transcribed by RNA polymerase II in plants, and provide additional evidence that a significant proportion of intragenic miRNAs have Pol II promoters. It suggests that these intragenic miRNAs may be transcribed as an indepen- dent unit in plants, a small number of miRNAs with no class II promoter may be transcribed through other transcrip- tional mechanisms, such as the host gene promoter. Further studies carried out to explore whether there is a relationship between the number of Pol II promoters and the degree of miRNA conservation revealed that the number of Pol II promoters in the upstream sequences of highly conserved miRNAs was signifi- cantly higher than in low conserved (P < 0.001; two- sample t-test) and in nonconserved (P < 0.001; two- sample t-test) miRNAs. As shown in Fig. 2B, only 13.67% of highly conserved miRNAs had no Pol II promoter, which is significantly lower than in low con- served miRNAs (31.14%) (P < 0.01; Fisher’s exact test) (26.76%) in (P < 0.05; Fisher’s exact test). On the contrary, 50.13% of highly conserved miRNAs have at least two Pol II promoters, whereas only 27.38% of low con-
FEBS Journal 278 (2011) 929–940 ª 2011 The Authors Journal compilation ª 2011 FEBS
932
M. Zhou et al. Clustering and flanking characteristics for plant miRNAs
S. bicolor
O. sativa
A
50%
Intragenic
Intragenic
Intergenic
Intergenic
50%
40%
40%
30%
30%
20%
20%
10%
10%
0%
0%
0
1
2
0
1
2
≥3
≥3
The number of core promoter
The number of core promoter
P. trichocarpa
A. thaliana
50%
Intragenic
Intragenic
60%
Intergenic
Intergenic
50%
40%
40%
30%
30%
20%
20%
10%
10%
0%
0%
0
1
2
0
1
2
≥3
≥3
The number of core promoter
The number of core promoter
B 100%
80%
Non-conserved
60%
Low conserved
Highly conserved
40%
20%
0%
1
2
0 ≥3 The number of core promoter
Fig. 2. Distribution of miRNA genes with the same number of putative core promot- ers. (A) The percentage of miRNA genes occurring between protein-coding genes or within the introns in four plant species. (B) The percentage of miRNA genes with different degrees of conservation.
than low conserved and nonconserved miRNAs (on average 1.13 and 1.05 per miRNA, respectively) in plants. It has been demonstrated that the highly con- served miRNAs are likely to be central regulators and are highly expressed [28,29]. The results of one study suggested that less conserved miRNAs rarely had obvi- ous effects on plant morphology [30]. Therefore, we speculate that the increased number of Pol II promot- ers located in the upstream regions of highly conserved miRNAs may have an important effect on the high levels of expression of highly conserved miRNAs.
served miRNAs (P < 0.001; Fisher’s exact test) and 23.94% of nonconserved miRNAs (P < 0.0001; Fish- er’s exact test) have at least two Pol II promoters. However, there was no significant difference in the number of Pol II promoters in upstream sequences between low conserved and nonconserved miRNAs in plants. Taken together with the findings of the study performed by Cui et al. [10], our results provide a more comprehensive understanding of the relationship between the number of Pol II promoters and the degree of miRNA conservation in plant genomes. Highly conserved miRNAs may be associated with more Pol II promoters (on average 1.72 per miRNA)
To further characterize the putative core promoter of the Pol II promoter in the upstream sequences of
FEBS Journal 278 (2011) 929–940 ª 2011 The Authors Journal compilation ª 2011 FEBS
933
S. bicolor
M. Zhou et al. Clustering and flanking characteristics for plant miRNAs
A 50%
O. sativa
in three plant
40%
A. thaliana
P. trichocarpa
30%
20%
10%
0%
–0.4 kb –0.8 kb –1.2 kb –1.6 kb
–2 kb
Highly conserved
B 40%
Low conserved
Non-conserved
30%
20%
10%
0%
–0.4 kb –0.8 kb –1.2 kb –1.6 kb
–2 kb
suggest
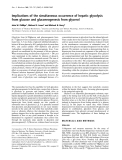
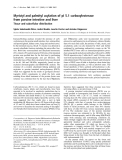
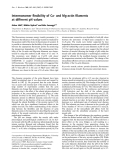
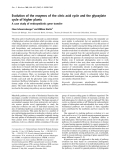
significant number of putative core promoters of the Pol II promoter were found to be located within the 400-bp upstream regions species, although the putative promoters in O. sativa were dis- tributed mainly from 0 to 0.4 kb and from 1.6 to 2 kb. Together, these results indicate that this distribution pattern of putative core promoters seems to be con- served in the 2-kb region upstream of miRNAs in dif- ferent plant species, and provide additional evidence that the core promoter regions of most miRNAs are close to pre-miRNA hairpins in plants. Fig. 3B shows the distribution of the core promoter in upstream sequences in view of the evolutionary conservation of plant miRNAs. We found that the distribution pattern of the core promoter in upstream regions was different between highly conserved miRNAs and low conserved or nonconserved miRNAs. Highly conserved miRNAs tend to contain more core promoters within the 400- bp region upstream of the miRNA. However, core promoters are distributed mainly in the 0 to )0.4 kb, )0.8 to )1.2 kb and )1.6 to )2 kb regions upstream of low conserved miRNAs, and, in contrast, core pro- moters are evenly distributed in upstream regions of nonconserved miRNAs. These results that there is a relationship between the distribution pattern of core promoters and the degree of miRNA conserva- tion in plants. Based on these observations, we pro- pose that the core promoter of Pol II promoters in the close proximal promoter region of miRNAs may play a more effective, or even a greater, role for efficient transcription initiation.
Fig. 3. Histograms of distances between putative core promoters and miRNA stem–loop sequences. The horizontal axis shows the positions of putative core promoters with respect to the corre- sponding miRNA stem–loop sequences, and the vertical axis shows the percentage of putative core promoters at the specified posi- tions. (A) Percentage of putative core promoters at the specified positions in different plant species. (B) Percentage of putative core promoters at the specified positions for miRNAs with a different degree of conservation.
Analysis of specific sequence motifs in four plant species
plant miRNAs, we examined the distribution of the putative core promoter in 2-kb upstream regions of miRNAs in the four species of plant studied. In these four plant species, the vast majority of the predicted core promoters of the Pol II promoters were found to lie within a 900-bp region upstream of the miRNAs. Distribution analysis of core promoter localization in 2-kb regions upstream of the miRNAs from the four species of plants studied showed that 50.4% of the putative core promoters of the Pol II promoter were located within 0–1 kb, 26.8% were located within 1– 1.5 kb and 22.8% were located within 1.5–2 kb, respectively of the miRNA. A recent study on rice (O. sativa) suggested that the majority of TSSs and TATA-boxes are found within 0–400 bp upstream of the miRNA [10]. Here, we found a similar distribution of the putative core promoter in upstream regions of miRNAs in four plant species. As shown in Fig. 3A, a
To further identify specific characteristic motifs in the flanking regions of miRNAs in four plant species, we performed motif analysis to search for over-repre- sented and statistically significant motifs in the flank- ing regions up to 2 kb upstream and 1 kb downstream from the miRNA stem–loop sequences. First of all, we used RepeatMasker with default settings to mask repeats in all upstream and downstream sequences, and then used two motif-finding tools – MEME and MotifSampler – to identify over-represented motifs. Finally, we carried out whole-genome Monte Carlo simulation analysis to assess the specificity and signifi- cance of motifs identified, as described in the Materials and methods. Motifs whose Z-scores were > 2.0 were considered as over-represented and statistically signifi- cant motifs. Several significantly over-represented spe- cies-specific motifs were identified in the flanking regions of four plant species. All the species-specific
FEBS Journal 278 (2011) 929–940 ª 2011 The Authors Journal compilation ª 2011 FEBS
934
M. Zhou et al. Clustering and flanking characteristics for plant miRNAs
[34,35].
In contrast
species-specific motifs
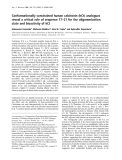
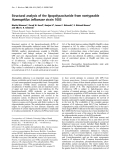
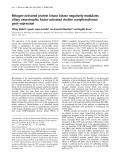
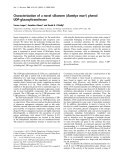
motifs found in the four plant species studied are shown in Table 2. The motif M2, represented by the consensus sequence TTAGGGTTTC, has also been found in A. thaliana by Zhou et al. [11]. Moreover, we also discovered a novel motif – M1 – with a Z-score value of 10.62 that is specific to A. thaliana. In order to gain a deeper insight into the function of these spe- cies-specific motifs, we compared our species-specific motifs against known transcription factors in plants from the PlantCARE database [31]. Only one motif (M5) was already a known transcription factor in plant promoters. We found that M5, with the consen- is an RY cis-acting sus sequence GCATGCATGC, regulatory element involved in seed-specific regulation in both monocot and eudicot species of plants [32,33]. Although the functions of other species-specific motifs are still unknown, we found that some motifs have repeat sequences in their consensus. M5 has two copies
of GCAT, and M3, which can be considered as GCA- repeats. Palindromic patterns have been found in the binding sites of some transcription factors in plants to A. thaliana, and animals P. trichocarpa and S. bicolor, we could not detect any significant in the flanking regions of miRNAs in O. sativa, although a previous study has identified three specific motifs in the promot- ers of miRNAs in O. sativa [11]. Our analysis suggests that these species-specific motifs are associated with different specific functions, and may play an important role in species-specific transcriptional regulation net- works of miRNA genes or contribute to the formation of species-specific miRNAs in plants. However, their functions need to be investigated in further studies. Furthermore, these species-specific motifs will be useful identification of species-specific in the computational miRNAs in plants.
Table 2. Significantly over-represented species-specific sequence motifs identified in the flanking regions of the three plant species studied.
Species Index Consensus sequencea Motif logob E-valuec Z-scored
A. thaliana M1 GGCCTGAGCC 1.4e-008 10.62
M2 TTAGGGTTTC 2.4e-009 4.31
P. trichocarpa M3 GCAGCAGAAG 7.2e-006 6.21
M4 CGGGTCAAAC 3.6e-016 4.45
S. bicolor M5 GCATGCATGC 2.7e-030 5.86
a The consensus sequence represents a sequence of the most frequent base at each position. b The motif logos show the information con- tent present at each position in the sequence. c The expected frequencies of motifs in a random database of the same size. d The Z-score value was obtained by whole-genome Monte Carlo simulation analysis.
FEBS Journal 278 (2011) 929–940 ª 2011 The Authors Journal compilation ª 2011 FEBS
935
M6 GAACTAAACA 2.1e-019 3.53
M. Zhou et al. Clustering and flanking characteristics for plant miRNAs
of
the
control
transcriptional
been shown that the duplication events for miRNA gene evolution in plants not only involve the region that is transcribed but also the miRNA promoter regions [41,42]. This might indicate that these signifi- cantly over-represented sequence motifs in highly con- served and low conserved miRNAs are evolutionarily related elements that play important functional roles in evolutionarily conserved regulatory systems in plants or are associated with duplication events for miRNA gene evolution in plants, although the functionality of these computationally identified conserved motifs remains to be experimentally validated.
Conclusions
In this study, we concentrated our efforts on clustering patterns and flanking characteristics that might be involved in the transcriptional regulation and process- ing of plant miRNAs, including the miRNAs located in the intergenic area and in the protein-coding area whose possible sequence characteristics were not stud- ied earlier. Previous studies have revealed that miR- NAs located in close genomic proximity to each other are co-transcribed as polycistronic units [24,43,44]. Therefore, we performed genome-wide analysis to examine the clustering patterns of the miRNAs in four species of plant. The pairwise distance analysis results of same-strand consecutive miRNAs suggested that the distances between the four plant miRNAs are statisti- cally significantly higher than expected at random (P < 0.001). Comparison of the miRNA pair distances with the pair distances of protein-coding genes revealed that plant miRNAs are more clustered than
The mechanism by which new plant miRNAs origi- nate is not fully understood. It is believed that the ori- gin of new plant miRNAs is dependent on duplication and inversion events [36–38]. However, several lines of evidence have also suggested that new plant miRNA genes can arise from foldback sequences, which are under regulatory sequences [39,40]. In order to determine whether some significantly over-represented sequence motifs are related to the degree of conservation of miRNA genes in plants, we classified the miRNA genes of four plant species into highly conserved miRNAs, low conserved miRNAs and nonconserved miRNAs, as described in the Materials and methods. We then examined the upstream sequences and downstream sequences of these miRNA genes to reveal characteristic sequence motifs. Several significantly over-represented motifs associated with the degree of miRNA conservation are identified and listed in Table 3. Two motifs (CAT- GCATGCA and CTAGCTAGCT; M1 and M2, respectively), which have repetitive and palindromic patterns in their consensus sequences, were found to be significantly over-represented in highly conserved plant miRNAs and therefore these motifs can be con- sidered as CATG repeats and CTAG repeats, respec- tively. However, we did not find any significantly over- represented sequence motifs in the flanking sequences of nonconserved miRNAs in the four plant species. In contrast to nonconserved miRNA genes that have a single copy, conserved miRNA genes are usually multi- copy [25]. miRNAs that are highly conserved across plant species must have originated a long time ago and experienced many genome-duplication events. It has
Table 3. Significantly over-represented sequence motifs related to the conservation of miRNAs.
Conservation Index Consensus sequencea Motif logob E-valuec Z-scored
Highly M1 CATGCATGCA 3.6e-019 7.82
M2 CTAGCTAGCT 1.6e-024 5.76
a The consensus sequence represents a sequence of the most frequent base at each position. b The motif logos show the information con- tent present at each position in the sequence. c The expected frequencies of motifs in a random database of the same size. d The Z-score value obtained by whole-genome Monte Carlo simulation analysis.
FEBS Journal 278 (2011) 929–940 ª 2011 The Authors Journal compilation ª 2011 FEBS
936
Low M3 TGGCGGGAAA 24e-014 4.32
M. Zhou et al. Clustering and flanking characteristics for plant miRNAs
Materials and methods
Data sets
sequence motifs
protein-coding genes in the very short pairwise dis- tances of < 1 kb. Then, we characterized the putative core promoter of Pol II promoters in plant miRNA upstream sequences. Our results suggest that most plant miRNAs contain the core promoter of Pol II promoters that are close to pre-miRNA hairpins. Analysis of promoter architecture for different miRNA genes in plants reveals significant differences in the number and distribution of core promoters between intergenic miRNAs and intragenic miRNAs, and between highly conserved miRNAs and low or non- conserved miRNAs. We applied two motif-finding tools to search for over-represented, statistically signifi- cant in the flanking regions of miRNAs in different plant species. Six motifs were found to be species-specific motifs in three plant species and included some previously known species- specific motifs and some novel species-specific motifs. We also identified three specific motifs associated with the degree of miRNA conservation.
(http://www.phytozome.net/poplar)
(version_6.0)
[46],
To obtain the upstream and downstream sequences of plant miRNA genes, we chose four species of plant (A. thaliana, P. trichocarpa, O. sativa and S. bicolor) to study clustering patterns and sequence characteristics in the flanking regions of plant miRNA genes because the number of miRNA genes in these four plant species is relatively large and the genome sequences are relatively complete. All known miRNAs and genome coordinates in these four plant spe- cies were downloaded from the miRBase Sequence Data- base, release 16 (http://www.mirbase.org/) [45]. The genome sequences and the protein-coding genes of A. thaliana and S. bicolor were downloaded from MapViewer in National Center for Biotechnology Information (http://www.ncbi. nlm.nih.gov/). The genome sequences of P. trichocarpa and O. sativa and the protein-coding genes were downloaded from the Poplar site on Phytozome v6.0 (P. trichocarpa v2.0) [23] and TIGR respectively. Oryza Pseudomolecules Then, we extracted sequences up to 2 kb upstream and up to 1 kb downstream from all available miRNA precursors in the four plant species. A detailed description of the data set used in our study is shown in Table 4.
Conservation analysis of miRNA in the four plant species studied
To determine the degree of conservation of miRNA in the four plant species, we performed a sequence-based homol- ogy search for known miRNAs from the four plants to detect both closely related and distantly related homo- logues. First, known miRNA hairpin sequences from the four plants were aligned against all known miRNA hairpin sequences in monocots and eudicots using standalone BLAST (blastn, version 2.2.27). The hairpin sequences were considered as homologues when they exhibited a minimum sequence identity of 85% over an alignment length of at least 90%. Second, ClustalW [47] was used to compare mature miRNA sequences for a search of homologues. We adopted mature miRNA sequences matching at least 18 nucleotides and left 0–3 nucleotides for possible sequence
Compared with previous studies, our study system- atically explored clustering patterns and the character- istics of flanking regions up to 2 kb upstream and 1 kb downstream of miRNA stem–loop sequences, and extended the results on a small number of miRNAs in A. thaliana and in O. sativa to all known miRNAs in four plant species. It remains largely unknown whether there are some motifs related to the degree of conser- vation of miRNAs. In order to dissect this question, the four plant we classified the miRNA genes of species studied into three groups, according to their conservation, and examined characteristic sequence motifs in the flanking sequences of these miRNA genes. Several significant motifs appeared to be related to the degree of miRNA conservation. We hope that our results can contribute to gaining a better under- standing of transcriptional regulation and process- ing of miRNAs and provide useful data for further computational identification of miRNAs in plants. Also, we anticipate that these motifs related to the degree of miRNA conservation may be useful for understanding the mechanism of the origin of new plant miRNAs.
Table 4. Detailed description of the data set in our study.
Species Version of genome annotation No. of miRNAs No. of polycistronic transcripts No. of upstream sequences No. of downstream sequences
FEBS Journal 278 (2011) 929–940 ª 2011 The Authors Journal compilation ª 2011 FEBS
937
A. thaliana P. trichocarpa O. sativa S. bicolor TAIR9 JGI_Poptr2.0 MSU6.0 JGI_sbi1 213 234 462 148 21 17 33 12 167 163 326 125 167 163 326 125
variations [19]. Finally, we divided the miRNAs of the four plant species into three groups: the miRNAs whose homo- logues were found simultaneously in monocots and eudicots were considered as highly conserved miRNAs; those found only in monocots or eudicots were considered as low con- served miRNAs; and those found only in one species were considered as nonconserved miRNAs.
M. Zhou et al. Clustering and flanking characteristics for plant miRNAs
Analysis of clustering patterns
width of 10 bp. All other options were left as default. Furthermore, we also applied MotifSampler, which is based on Gibbs sampling [50], to find over-represented motifs. MotifSampler is a stochastic algorithm and the results may vary for different runs. Therefore, we carried out 50 repeated runs of MotifSampler for each analysis. The number of different motifs was set to 10 and the width of the motifs was set to 10. All other options were set at a variety of arguably sensible settings. The results of these two programs were integrated to identify motifs that are frequently reported to have a low E-value among these settings and among both motif-finding tools in the flanking regions of the microRNA genes from the four plant spe- cies. Sequence logos for all motifs found by these two pro- grams were created using WebLogo Version 2.8.2 (http:// weblogo.berkeley.edu) [51].
To study the clustering patterns of miRNA genes in differ- ent plant species, we computed the neighbour distances between every two same-strand consecutive miRNA genes the in the same chromosome. The average distance of neighbour miRNA pairs was calculated across all chromo- somes in the four plant species studied. To evaluate the sta- tistical significance of miRNA clustering patterns in the four plant species, we performed a sampling approach to evaluate significance. First, we selected random positions whose number was equal to the number of miRNA genes on each chromosome. Then we computed the neighbour distances between consecutive random points and the aver- age. By random shuffling 1000 times, we set the P value as the fraction of times for which the random averages were smaller (or larger) than the average distances of miRNA pairs to evaluate the statistical significance for clustering patterns in the four plant species.
Prediction of the core promoter of the plant miRNA gene
In order to determine whether a motif is statistically sig- nificant in the flanking regions of plant miRNA genes, whole-genome Monte Carlo simulation, resulting in a Z-score, was used to take into account the specificity and significance of a motif, as previously described by Zhou et al. [11]. For a given motif, we first obtained the average number of occurrences per target sequence, denoted as Nt, and then randomly generated the same number of ref- erence sets from protein-coding genes and an intergenic sequence, far upstream of the miRNA, as an appropriate background. Next, the MEME motifs were individually aligned using the MAST program with default values [52] to the reference sets to compute the average number of occur- rences of a motif, Nr, and its standard deviation, rr, over the reference sets. The Z-score was computed as Z = (Nt ⁄ Nr) = rr, which measures the normalized difference between the average occurrence of the motif in the target set and the sample mean in the reference sets [11].
Acknowledgements
The core promoter of the class II promoter, including the TSS and the TATA-box, in the upstream sequences of plant miRNA genes were detected using the TSSP-TCM program (http://mendel.cs.rhul.ac.uk/mendel.php?topic=fgen) with its default parameters; this program is well established and is the most commonly used plant promoter prediction software [48].
Motif analysis
This work was supported in part by the National Natural Science Foundation of China (grant nos the National 30871394, 30600367 and 30571034), High Tech Development Project of China, the 863 Program (grant nos 2007AA02Z329), the National Basic Research Program of China, the 973 Program (grant nos 2008CB517302) and the National Science Foundation of Heilongjiang Province (grant nos ZJG0501, 1055HG009, GB03C602-4, JC2007H and BMFH060044).
References
1 Voinnet O (2009) Origin, biogenesis, and activity of
plant microRNAs. Cell 136, 669–687.
2 Chen X (2008) MicroRNA metabolism in plants. Curr
To identify characteristic motifs in the flanking regions for microRNA genes in the four plant species, we first used RepeatMasker (version 3.2.9; http://www.repeatmasker.org) with default settings to mask repeats in all upstream and downstream sequences. Then we applied the MEME Suite software (version 4.3.0; http://meme.sdsc.edu/), which is a probabilistic local alignment tool [49]. The significance of a detected motif was represented by the E-value, which refers to the expected number of motifs of equal width with the same or higher likelihood in a random sequence set with the same size and nucleotide composition as the considered set of sequences. Here, MEME was used to identify 10 top-ranking motifs for each species with a
Top Microbiol Immunol 320, 117–136.
FEBS Journal 278 (2011) 929–940 ª 2011 The Authors Journal compilation ª 2011 FEBS
938
3 Ambros V (2004) The functions of animal microRNAs.
Nature 431, 350–355.
4 Singh SK, Pal Bhadra M, Girschick HJ & Bhadra U
19 Sunkar R & Jagadeeswaran G (2008) In silico identifi- cation of conserved microRNAs in large number of diverse plant species. BMC Plant Biol 8, 37.
(2008) MicroRNAs–micro in size but macro in function. Febs J 275, 4929–4944.
5 Lee RC, Feinbaum RL & Ambros V (1993) The
20 Lagos-Quintana M, Rauhut R, Meyer J, Borkhardt A & Tuschl T (2003) New microRNAs from mouse and human. RNA 9, 175–179.
21 Altuvia Y, Landgraf P, Lithwick G, Elefant N,
C. elegans heterochronic gene lin-4 encodes small RNAs with antisense complementarity to lin-14. Cell 75, 843– 854.
6 Park W, Li J, Song R, Messing J & Chen X (2002)
Pfeffer S, Aravin A, Brownstein MJ, Tuschl T & Margalit H (2005) Clustering and conservation patterns of human microRNAs. Nucleic Acids Res 33, 2697– 2706.
22 Thatcher EJ, Bond J, Paydar I & Patton JG (2008)
CARPEL FACTORY, a Dicer homolog, and HEN1, a novel protein, act in microRNA metabolism in Arabidopsis thaliana. Curr Biol 12, 1484–1495.
Genomic organization of zebrafish microRNAs. BMC Genomics 9, 253.
7 Reinhart BJ, Weinstein EG, Rhoades MW, Bartel B & Bartel DP (2002) MicroRNAs in plants. Genes Dev 16, 1616–1626.
8 Xie Z, Allen E, Fahlgren N, Calamar A, Givan SA &
23 Tuskan GA, Difazio S, Jansson S, Bohlmann J, Grigo- riev I, Hellsten U, Putnam N, Ralph S, Rombauts S, Salamov A et al. (2006) The genome of black cotton- wood, Populus trichocarpa (Torr. & Gray). Science 313, 1596–1604.
Carrington JC (2005) Expression of Arabidopsis MIRNA genes. Plant Physiol 138, 2145–2154.
24 Zhang B, Pan X, Cannon CH, Cobb GP &
9 Bartel DP (2004) MicroRNAs: genomics, biogenesis,
mechanism, and function. Cell 116, 281–297.
10 Cui X, Xu SM, Mu DS & Yang ZM (2009) Genomic
Anderson TA (2006) Conservation and divergence of plant microRNA genes. Plant J 46, 243–259.
25 Li A & Mao L (2007) Evolution of plant microRNA
gene families. Cell Res 17, 212–218.
analysis of rice microRNA promoters and clusters. Gene 431, 61–66.
11 Zhou X, Ruan J, Wang G & Zhang W (2007)
26 Baskerville S & Bartel DP (2005) Microarray profiling of microRNAs reveals frequent coexpression with neighboring miRNAs and host genes. RNA 11, 241–247.
Characterization and identification of microRNA core promoters in four model species. PLoS Comput Biol 3, e37.
27 Kim YK & Kim VN (2007) Processing of intronic
microRNAs. EMBO J 26, 775–783.
28 Lindow M & Krogh A (2005) Computational evidence
for hundreds of non-conserved plant microRNAs. BMC Genomics 6, 119.
29 Hofmann NR (2010) MicroRNA evolution in the genus
Arabidopsis. Plant Cell 22, 994.
12 Megraw M, Baev V, Rusinov V, Jensen ST, Kalantidis K & Hatzigeorgiou AG (2006) MicroRNA promoter element discovery in Arabidopsis. RNA 12, 1612–1619. 13 Heikkinen L, Asikainen S & Wong G (2008) Identifica- tion of phylogenetically conserved sequence motifs in microRNA 5¢ flanking sites from C. elegans and C. briggsae. BMC Mol Biol 9, 105.
30 Todesco M, Rubio-Somoza I, Paz-Ares J & Weigel D (2010) A collection of target mimics for comprehensive analysis of microRNA function in Arabidopsis thaliana. PLoS Genet 6, e1001031.
14 Inouchi A, Shinohara S, Inoue H, Kita K & Itakura M (2007) Identification of specific sequence motifs in the upstream region of 242 human miRNA genes. Comput Biol Chem 31, 207–214.
31 Lescot M, Dehais P, Thijs G, Marchal K, Moreau Y,
15 Ohler U, Yekta S, Lim LP, Bartel DP & Burge CB
(2004) Patterns of flanking sequence conservation and a characteristic upstream motif for microRNA gene iden- tification. RNA 10, 1309–1322.
16 Fujita S & Iba H (2008) Putative promoter regions of miRNA genes involved in evolutionarily conserved regulatory systems among vertebrates. Bioinformatics 24, 303–308.
Van de Peer Y, Rouze P & Rombauts S (2002) PlantCARE, a database of plant cis-acting regulatory elements and a portal to tools for in silico analysis of promoter sequences. Nucleic Acids Res 30, 325–327. 32 Baumlein H, Nagy I, Villarroel R, Inze D & Wobus U (1992) Cis-analysis of a seed protein gene promoter: the conservative RY repeat CATGCATG within the legu- min box is essential for tissue-specific expression of a legumin gene. Plant J 2, 233–239.
33 Fujiwara T & Beachy RN (1994) Tissue-specific and
17 Zhou M, Wang Q, Sun J, Li X, Xu L, Yang H, Shi H, Ning S, Chen L, Li Y et al. (2009) In silico detection and characteristics of novel microRNA genes in the Equus caballus genome using an integrated ab initio and comparative genomic approach. Genomics 94, 125–131.
temporal regulation of a beta-conglycinin gene: roles of the RY repeat and other cis-acting elements. Plant Mol Biol 24, 261–272.
34 Olefsky JM (2001) Nuclear receptor minireview series.
J Biol Chem 276, 36863–36864.
18 Yue J, Sheng Y & Orwig KE (2008) Identification of novel homologous microRNA genes in the rhesus macaque genome. BMC Genomics 9, 8.
FEBS Journal 278 (2011) 929–940 ª 2011 The Authors Journal compilation ª 2011 FEBS
939
M. Zhou et al. Clustering and flanking characteristics for plant miRNAs
lar evolution of the rice miR395 gene family. Cell Res 15, 631–638.
35 Krawczyk S, Thurow C, Niggeweg R & Gatz C (2002) Analysis of the spacing between the two palindromes of activation sequence-1 with respect to binding to differ- ent TGA factors and transcriptional activation poten- tial. Nucleic Acids Res 30, 775–781.
44 Allen E, Xie Z, Gustafson AM & Carrington JC (2005) microRNA-directed phasing during trans-acting siRNA biogenesis in plants. Cell 121, 207–221. 45 Griffiths-Jones S, Saini HK, van Dongen S
& Enright AJ (2008) miRBase: tools for microRNA genomics. Nucleic Acids Res 36, D154–158.
46 Ouyang S, Zhu W, Hamilton J, Lin H, Campbell M,
36 Fahlgren N, Howell MD, Kasschau KD, Chapman EJ, Sullivan CM, Cumbie JS, Givan SA, Law TF, Grant SR, Dangl JL et al. (2007) High-throughput sequencing of Arabidopsis microRNAs: evidence for frequent birth and death of MIRNA genes. PLoS ONE 2, e219. 37 Rajagopalan R, Vaucheret H, Trejo J & Bartel DP
(2006) A diverse and evolutionarily fluid set of microR- NAs in Arabidopsis thaliana. Genes Dev 20, 3407–3425.
Childs K, Thibaud-Nissen F, Malek RL, Lee Y, Zheng L et al. (2007) The TIGR Rice Genome Annotation Resource: improvements and new features. Nucleic Acids Res 35, D883–887.
47 Chenna R, Sugawara H, Koike T, Lopez R, Gibson TJ, Higgins DG & Thompson JD (2003) Multiple sequence alignment with the Clustal series of programs. Nucleic Acids Res 31, 3497–3500.
48 Shahmuradov IA, Solovyev VV & Gammerman AJ (2005) Plant promoter prediction with confidence estimation. Nucleic Acids Res 33, 1069–1076.
38 Allen E, Xie Z, Gustafson AM, Sung GH, Spatafora JW & Carrington JC (2004) Evolution of microRNA genes by inverted duplication of target gene sequences in Arabidopsis thaliana. Nat Genet 36, 1282–1290. 39 Felippes FF, Schneeberger K, Dezulian T, Huson DH & Weigel D (2008) Evolution of Arabidopsis thaliana microRNAs from random sequences. RNA 14, 2455– 2459.
49 Bailey TL & Elkan C (1994) Fitting a mixture model by expectation maximization to discover motifs in biopoly- mers. Proc Int Conf Intell Syst Mol Biol 2, 28–36. 50 Thijs G, Lescot M, Marchal K, Rombauts S, De Moor
40 Axtell MJ (2008) Evolution of microRNAs and their targets: are all microRNAs biologically relevant? Biochim Biophys Acta 1779, 725–734.
41 Haberer G, Hindemitt T, Meyers BC & Mayer KF
(2004) Transcriptional similarities, dissimilarities, and conservation of cis-elements in duplicated genes of Arabidopsis. Plant Physiol 136, 3009–3022.
B, Rouze P & Moreau Y (2001) A higher-order background model improves the detection of promoter regulatory elements by Gibbs sampling. Bioinformatics 17, 1113–1122.
51 Crooks GE, Hon G, Chandonia JM & Brenner SE
(2004) WebLogo: a sequence logo generator. Genome Res 14, 1188–1190.
42 Wang Y, Hindemitt T & Mayer KF (2006) Significant sequence similarities in promoters and precursors of Arabidopsis thaliana non-conserved microRNAs. Bioinformatics 22, 2585–2589.
43 Guddeti S, Zhang DC, Li AL, Leseberg CH, Kang H, Li XG, Zhai WX, Johns MA & Mao L (2005) Molecu-
52 Bailey TL & Gribskov M (1998) Combining evidence using p-values: application to sequence homology searches. Bioinformatics 14, 48–54.
FEBS Journal 278 (2011) 929–940 ª 2011 The Authors Journal compilation ª 2011 FEBS
940
M. Zhou et al. Clustering and flanking characteristics for plant miRNAs