
RUSSIA'S INVASION
OF UKRAINE
Implications for
Energy Markets and Activity
SPECIAL FOCUS 2


S P ECI A L F O CU S 2 G L O B A L E C O N O M I C P R O S P E C T S | J U NE 2 0 2 2 81
The Russian Federation’s invasion of Ukraine has disrupted global energy markets and damaged the global
economy. Compared to what took place in the 1970s, the shock has led to a surge in prices across a broader set of
energy-related commodities. In energy-importing economies, higher prices will reduce real disposable incomes,
raise production costs, tighten financial conditions, and constrain policy space. Some energy exporters may bene-
fit from improved terms of trade and higher commodities production. However, on net, model-based estimates
suggest that the war-driven surge in energy prices could reduce global output by 0.8 percent after two years. The
experience of previous oil price shocks has shown that these shocks can provide an important catalyst for policies
to encourage demand reduction, substitution to other fuels, and development of new sources of energy supply.
Introduction
Volatility in energy markets, driven by a strong
demand recovery from the pandemic and
numerous pandemic-related supply constraints, is
being exacerbated by Russia’s invasion of Ukraine.
The invasion has led to significant disruptions to
the trade and production of energy commodities
as Russia is the world’s largest exporter of natural
gas and accounts for a significant share of global
coal and crude oil exports (figure SF2.1.A).
However, the ultimate impact of these disruptions
will depend on their magnitude, the availability of
inventories, the development of other supplies or a
ramping up of production in other countries, and
the extent to which demand can be reduced.
Already, the United States and the European
Union (EU) have announced plans to ban or
phase out fossil fuel imports from Russia, and
Russia has cut off direct natural gas exports to
Bulgaria, Finland, the Netherlands, and Poland
(World Bank 2022a). The United States and other
International Energy Agency members announced
the release of 180 million and 60 million barrels of
oil, respectively, from April to October 2022. And
in any event, tighter financial conditions, reduced
investment, and restricted access to technology are
likely to have a longer-term impact on Russia’s
energy production.
Reflecting these developments, coal and oil prices
have risen sharply, European natural gas prices
have reached record highs, and the World Bank’s
energy price index increased by 34 percent
between January and March 2022, on top of a 50
percent increase between January 2020 and
December 2021 (figures SF2.1.B-D). Based on
current projections, energy prices are expected to
rise by 50 percent in 2022, reflecting an 81
percent increase in coal prices, a 74 percent rise in
natural gas prices (average of the European, Japan,
and U.S. benchmarks), and a 42 percent increase
in the price of oil. Relative to January projections,
the prices of energy commodities are now
expected to be 46 percent higher on average in
2023.1
Supply disruptions of key energy commodities
could severely affect a wide range of industries,
including food, construction, petrochemicals,
transport, and firm-level effects (Lafrogne-Joussier
et al. 2022). Concerns about energy security have
already prompted public policies aimed at
bolstering national self-sufficiency and reducing
energy prices for consumers; however, lessons
from previous energy price shocks show that these
policies are often costly and ineffective, compared
with steps to encourage consumers to reduce
demand, to substitute for other forms of energy,
and to develop alternative energy sources.
The increase in energy prices is likely to weigh on
global economic activity. Higher energy prices will
reduce activity in energy-importing economies by
lowering real incomes, raising production costs,
tightening financial conditions, and constraining
macroeconomic policy. Stronger activity in some
energy-exporting emerging market and developing
economies—supported by more favorable terms of
trade, expanded production, and stronger
investment—will only provide a partial offset to
the drag on global growth.
Note: This Special Focus was prepared by Justin-Damien
Guénette and Jeetendra Khadan with contributions from Peter
Stephen Oliver Nagle, John Baffes, and Garima Vasishtha.
1 On average over 2022-23, oil, natural gas, and coal prices are
now expected to be 87 percent, 40 percent, and 69 percent higher
than in January.
S P EC I A L F O CU S 2 G L O B A L E C O N O M I C P R O S P E C T S | J U NE 2 0 2 2
82
implying less opportunity for substitution toward
cheaper fuels. At the same time, however, the
energy intensity of GDP now is much lower than
in the 1970s, so consumers may be less sensitive to
relative price changes, at least in the short term.
And in the current episode, policy responses have
tended to focus on adjustments to fuel subsidies
and taxes to mitigate the effects on consumer
prices, rather than on measures to address
underlying supply/demand imbalances.
Prices. Crude oil prices have increased by 350
percent (in nominal terms) from their pandemic
low in April 2020 to April 2022, making it the
largest increase for any equivalent two-year period
since the 1970s.2 Also, all energy prices rose
sharply in 2022, in contrast to earlier episodes
where oil prices rose much more sharply than
those for coal and gas. In nominal terms, coal and
gas prices have all reached historic highs.
However, in real terms, only the European natural
gas price has reached an all-time high (and it is
substantially above its previous peak in 2008).
Coal prices are close to their 2008 peak, while oil
prices remain some way below. With all energy
prices elevated, there is less opportunity to
substitute for cheaper fuel in the current energy
shock. In addition, the increase in prices of some
energy commodities is also driving up prices of
other commodities. For example, higher natural
gas prices have already pushed fertilizer prices to
their highest level since 2010.
Smaller energy intensity of GDP. The oil
intensity of GDP has fallen considerably since the
1970s. Similarly, prior to the price shock,
consumer spending on energy as a share of total
spending is also lower, especially in advanced
economies, which means that consumers may
respond less to energy price changes, at least in the
short term, than in the 1970s.
Different policy focus. Many countries have
responded to the current shock by prioritizing
energy subsidies and tax breaks with fewer policies
Against this background, this Special Focus
addresses the following questions:
• How does the latest energy price shock
compare with previous major shocks?
• What are the lessons from previous energy
price shocks?
• What are the likely implications of the current
energy price shock for global activity?
Comparison with previous
energy shocks
The current energy shock differs from previous oil
price spikes to the extent that the current episode
has had a broader impact on energy commodities,
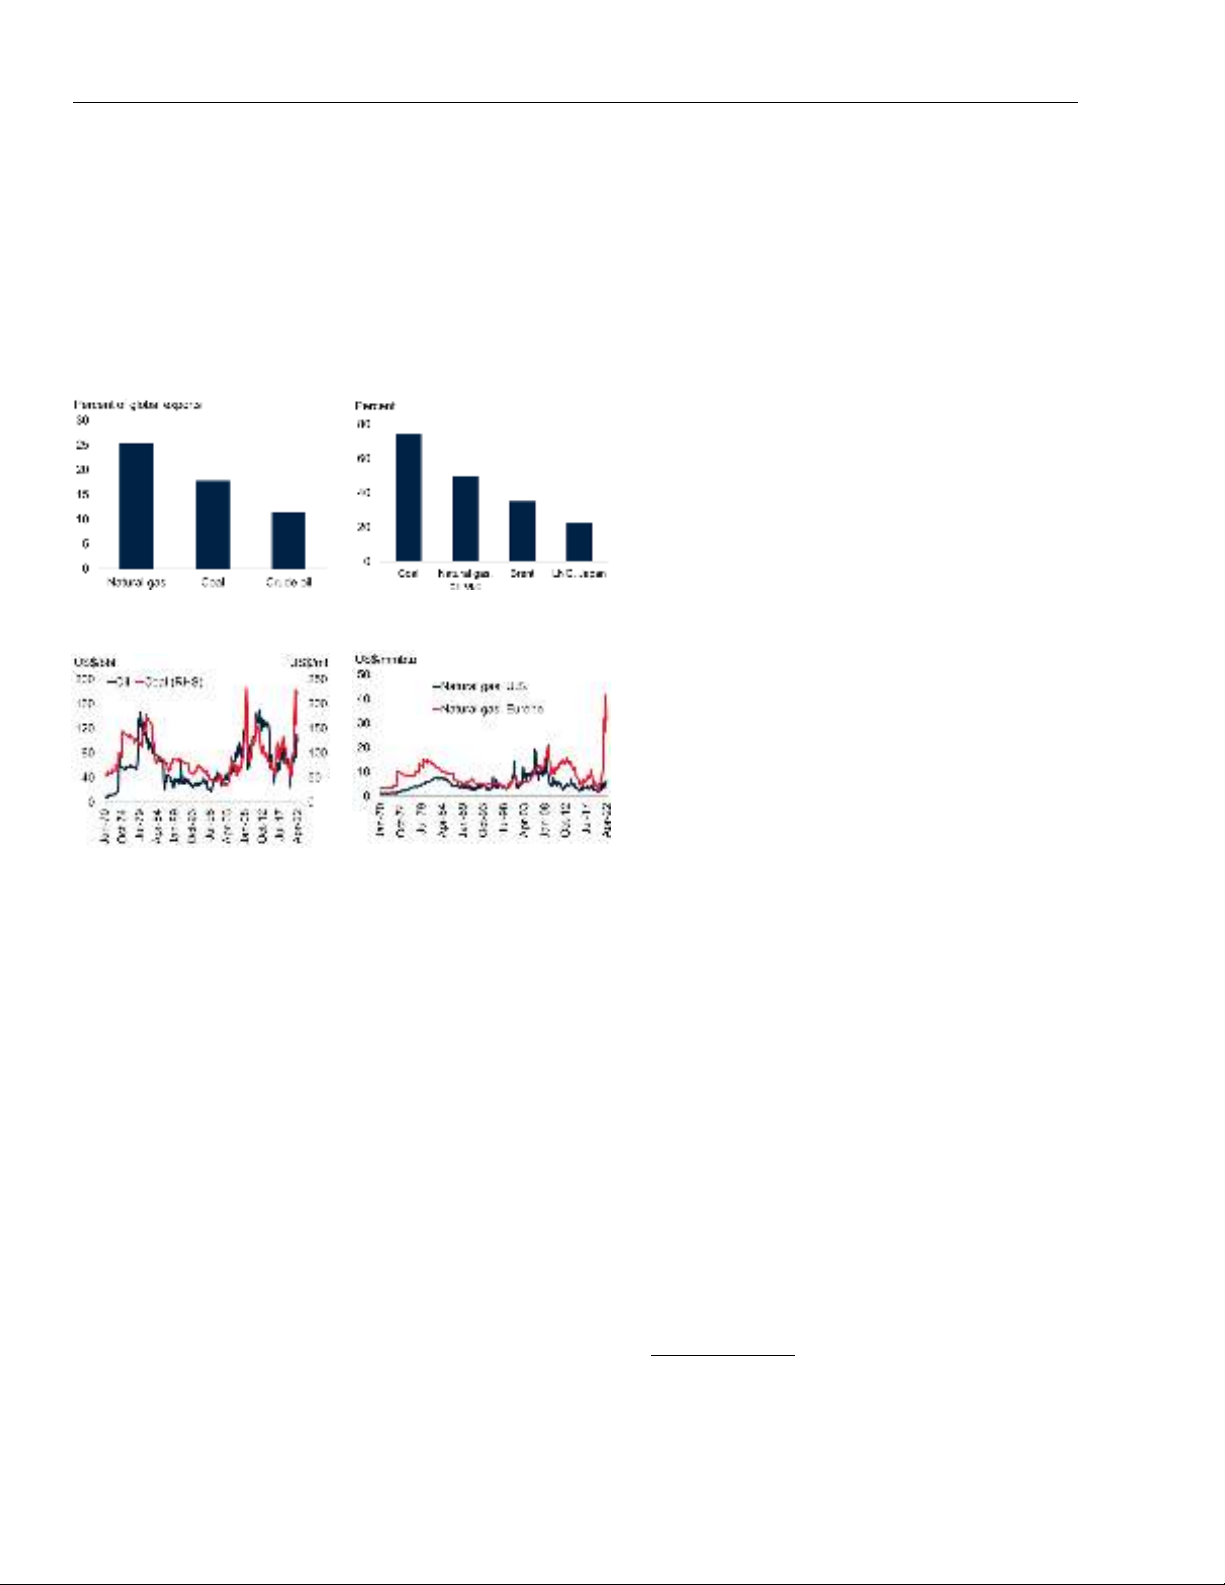
FIGURE SF2.1 Commodity dependence and energy
prices
The Russian Federation is a major exporter of energy commodities. All coal
and natural gas prices have reached historic highs in nominal terms.
However, in real terms, only the European natural gas price has reached
an all-time high, and it is substantially above its previous peak in 2008.
Real coal prices are close to their 2008 peak, while real oil prices remain
some distance below.
Sources: BP Statistical Review; Eurostat; Haver Analytics; Comtrade (database); World Bank.
A. Data for energy are trade volumes. Data are for 2020.
B. Three-month change in commodity prices through end-March 2022. LNG stands for liquefied
natural gas.
C.-D. Monthly data from 1970 to April 2022. Prices deflated by the U.S. Consumer Price Index.
A. The Russian Federation’s share of
global energy exports
B. Commodity price changes in 2022
C. Coal and oil prices (real) D. Natural gas prices (real)
2 Another shock took place during the early 2000s in a more
gradual fashion as a result of strong demand growth in emerging
market and developing economies, especially in China and India
(Baffes et al. 2018). At their peak, in July 2008, nominal oil prices
exceeded $130/bbl (or $172/bbl in inflation-adjusted 2022 terms).

S P EC I A L F O CU S 2 G L O B A L E C O N O M I C P R O S P E C T S | J U NE 2 0 2 2 83
designed to tackle the underlying imbalance
between supply and demand. However, several
countries have announced plans to increase
production of fossil fuels (coal and LNG), while
others have announced faster increases in fuel
efficiency requirements to reduce energy demand.
By comparison, policy responses to previous oil
price shocks were focused on establishing
institutions, such as the creation of the
International Energy Agency in 1974, to safeguard
oil supplies and promote common policy making.
Key policy decisions included the requirement to
create national oil reserves equal to 60 days of
imports (later expanded to 90 days) and a ban on
building new oil-powered electricity plants with a
directive to switch to coal (enacted in 1977; Scott
1994). Measures were also implemented to address
the underlying demand and supply imbalance
(Ilkenberry 1988; Shibata 1982; U.S. Congress
1975). For example, the United States adopted
policies to reduce demand and boost production
after the steady increase in prices in the 2000s
(EPA 2007). Demand-side measures included
fiscal incentives to improve energy efficiency in
vehicles and housing. Supply-side measures
included a mandate to sharply increase the use of
biofuels; establishing renewable fuel standards;
providing energy-related tax incentives for fossil
fuels, nuclear, and renewable energy sources; and
providing loan guarantees for zero-carbon
technologies. The EU and many EMDEs adopted
similar policies.
Lessons from previous
energy shocks
The experience of the past 50 years suggests that
there are three channels through which market
mechanisms respond to energy price shocks and
associated policies: demand reduction,
substitution, and supply responses (Baffes and
Nagle 2022).
Demand reduction. Between 1979 and 1983,
global oil demand fell by 11 percent, or 6 million
barrels per day (mb/d). While the drop in oil
demand was partly a result of the global recession
in 1982, energy efficiency and policies to
encourage a substitution from oil implemented by
oil-importing countries contributed to a
permanent reduction in underlying demand.
Changes in consumer preferences in response to
higher prices also played a role in reducing
demand, for example, the shift toward more fuel-
efficient vehicles in the United States (Cole 1981).
In the 2000s, there was less substitution to other
fuels as a much smaller amount of crude oil was
being used in electricity generation. After reaching
its peak in 2005, oil consumption in advanced
economies steadily declined and was 14 percent
lower by 2014. The decline in oil consumption
was largely due to a shift toward more fuel-
efficient automobiles, including hybrid electrics
(Hamilton 2009). Among EMDEs, oil demand
also decelerated in the 2010s.
Substitution. In the five years after the 1979 oil
price shock, the share of crude oil in the energy
mix in advanced economies fell by more than 7
percentage points, owing to the prohibition of the
construction of new oil-fired power stations and
their gradual replacement with nuclear and coal-
powered stations. Among EMDEs, the share of oil
in the energy mix fell by 4 percentage points and
was largely replaced by natural gas. In the years
following the 2008 oil price increase, the share of
natural gas and renewables in the energy mix rose,
reflecting the U.S. shale boom for natural gas, as
well as mandates and technological improvements
for renewables. However, substituting other
energy commodities for oil in its main current
uses—transport and petrochemicals—has proved
to be more difficult.
New sources of production. High oil prices in the
1970s induced investment in oil production by
non-OPEC countries, particularly for reserves
with a higher cost of production. These included
Prudhoe Bay in Alaska, the North Sea offshore
fields of the United Kingdom and Norway, the
Cantarell offshore field of Mexico, and oil sands in
Canada (figure SF2.2.A). High and stable prices in
the 2000s also facilitated the development of
alternative sources of crude oil. The most notable
of these was the development of U.S. shale oil
deposits, output from which rose from 0.6 mb/d
in 2008 to 7.8 mb/d in 2019, resulting in a
sustained expansion in total U.S. production
(figure SF2.2.B).


![Giáo trình Tính toán thiết kế hệ thống máy lạnh và điều hoà không khí (CĐ) - Trường Cao đẳng Công nghiệp Thanh Hóa [Mới nhất]](https://cdn.tailieu.vn/images/document/thumbnail/2026/20260511/hoabattu2026/135x160/70831778842526.jpg)


%20--%3e%3cdefs%3e%3cstyle%3e%20.st0%20{%20fill:%20%23fff;%20}%20.st1%20{%20fill:%20%237800fa;%20}%20%3c/style%3e%3c/defs%3e%3cpath%20class='st1'%20d='M117.78,12.18H43.11c2.9,3.47,4.65,7.94,4.65,12.82,0,5.6-2.3,10.66-6.01,14.29h76.02l7.22-13.56-7.22-13.56Z'/%3e%3cg%3e%3cpath%20class='st0'%20d='M53.58,26.17h-.59v-1.46h.59v-4.96h2.83c1.78,0,2.67.94,2.67,2.82v5.76c0,1.87-.89,2.81-2.67,2.81h-2.83v-4.96ZM55.36,21.37v3.34h1.1v1.46h-1.1v3.34h1.01c.61,0,.91-.37.91-1.1v-5.93c0-.74-.3-1.1-.91-1.1h-1.01Z'/%3e%3cpath%20class='st0'%20d='M65.99,31.14h-1.8l-.31-2.07h-2.19l-.31,2.07h-1.64l1.82-11.39h2.62l1.82,11.39ZM65.28,18.04c-.25.46-.51.77-.75.94-.21.15-.47.22-.79.22-.26,0-.57-.07-.92-.22l-.38-.15c-.14-.05-.26-.07-.37-.07-.3,0-.53.18-.71.54l-.91-.68c.25-.46.51-.77.75-.94.21-.14.48-.21.79-.21.26,0,.57.07.92.21l.38.15c.14.05.26.07.37.07.3,0,.53-.18.71-.54l.91.68ZM61.91,27.52h1.73l-.87-5.76-.87,5.76Z'/%3e%3cpath%20class='st0'%20d='M74.53,26.89v1.52c0,1.91-.89,2.86-2.67,2.86s-2.67-.95-2.67-2.86v-5.93c0-1.91.89-2.86,2.67-2.86s2.67.95,2.67,2.86v1.11h-1.69v-1.22c0-.75-.31-1.12-.93-1.12s-.93.37-.93,1.12v6.15c0,.74.31,1.11.93,1.11s.93-.37.93-1.11v-1.63h1.69Z'/%3e%3cpath%20class='st0'%20d='M81.4,31.14h-1.8l-.31-2.07h-2.19l-.31,2.07h-1.64l1.82-11.39h2.62l1.82,11.39ZM75.9,19.2l1.52-1.91h1.71l1.51,1.91h-1.61l-.76-.95-.75.95h-1.61ZM77.32,27.52h1.73l-.87-5.76-.87,5.76ZM83.1,15.99l-1.76,1.91h-1.26l1.17-1.91h1.86Z'/%3e%3cpath%20class='st0'%20d='M84.86,19.75c1.78,0,2.67.94,2.67,2.82v1.48c0,1.87-.89,2.81-2.67,2.81h-.85v4.28h-1.79v-11.39h2.64ZM84.01,21.37v3.86h.85c.58,0,.87-.36.87-1.08v-1.71c0-.71-.29-1.07-.87-1.07h-.85Z'/%3e%3cpath%20class='st0'%20d='M93.51,19.75c1.78,0,2.67.94,2.67,2.82v1.48c0,1.87-.89,2.81-2.67,2.81h-.85v4.28h-1.79v-11.39h2.64ZM92.66,21.37v3.86h.85c.58,0,.87-.36.87-1.08v-1.71c0-.71-.29-1.07-.87-1.07h-.85Z'/%3e%3cpath%20class='st0'%20d='M98.8,31.14h-1.79v-11.39h1.79v4.88h2.03v-4.88h1.83v11.39h-1.83v-4.88h-2.03v4.88Z'/%3e%3cpath%20class='st0'%20d='M105.36,24.55h2.46v1.62h-2.46v3.34h3.09v1.63h-4.88v-11.39h4.88v1.63h-3.09v3.18ZM108.17,17.29l-1.76,1.91h-1.26l1.17-1.91h1.86Z'/%3e%3cpath%20class='st0'%20d='M112.2,19.75c1.78,0,2.67.94,2.67,2.82v1.48c0,1.87-.89,2.81-2.67,2.81h-.85v4.28h-1.79v-11.39h2.64ZM111.35,21.37v3.86h.85c.58,0,.87-.36.87-1.08v-1.71c0-.71-.29-1.07-.87-1.07h-.85Z'/%3e%3c/g%3e%3ccircle%20class='st1'%20cx='25'%20cy='25'%20r='20'/%3e%3cpath%20class='st0'%20d='M32.78,19.27c2.92,0,4.43,2.55,5.28,5.33l.71,2.17c.14.38-.33.75-.71.75h-5.61c.19-.33.24-.71.09-1.08l-.75-2.45c-.43-1.32-.99-2.64-1.79-3.77.75-.57,1.65-.94,2.78-.94h0ZM25,18.38c3.25,0,4.9,2.78,5.89,5.89l.76,2.45c.14.42-.33.8-.8.8h-11.69c-.42,0-.94-.38-.8-.8l.75-2.45c.99-3.11,2.64-5.89,5.89-5.89h0ZM25,11.35c1.74,0,3.11,1.37,3.11,3.11s-1.37,3.11-3.11,3.11-3.11-1.41-3.11-3.11,1.41-3.11,3.11-3.11h0ZM17.27,19.27c1.08,0,1.98.38,2.73.94-.8,1.13-1.37,2.45-1.74,3.77l-.8,2.45c-.14.38-.05.75.09,1.08h-5.56c-.42,0-.9-.38-.75-.75l.71-2.17c.9-2.78,2.41-5.33,5.33-5.33h0ZM17.27,12.91c1.51,0,2.78,1.27,2.78,2.83s-1.27,2.83-2.78,2.83-2.83-1.27-2.83-2.83,1.27-2.83,2.83-2.83h0ZM32.78,12.91c1.56,0,2.78,1.27,2.78,2.83s-1.23,2.83-2.78,2.83-2.83-1.27-2.83-2.83,1.27-2.83,2.83-2.83h0ZM27.07,28.56v.09c0,.57-.24,1.08-.61,1.46h0v.05c-.38.33-.9.57-1.46.57s-1.08-.24-1.46-.61h0c-.38-.38-.61-.9-.61-1.46v-.09h1.41v.09c0,.19.05.38.19.47v.05c.09.09.28.19.47.19s.38-.09.47-.19v-.05c.14-.09.24-.28.24-.47t-.05-.09h1.41ZM30.99,28.56v.09c0,1.65-.66,3.16-1.74,4.24-1.08,1.08-2.59,1.79-4.24,1.79s-3.16-.71-4.24-1.79l-.05-.05c-1.04-1.08-1.7-2.55-1.7-4.2v-.09h1.41v.09c0,1.27.47,2.4,1.27,3.25h.05c.85.85,1.98,1.37,3.25,1.37s2.4-.52,3.25-1.37c.85-.8,1.37-1.98,1.37-3.25v-.09h1.37ZM34.99,28.56v.09c0,2.78-1.13,5.28-2.92,7.07-1.79,1.79-4.29,2.92-7.07,2.92s-5.23-1.13-7.07-2.92c-1.79-1.79-2.92-4.29-2.92-7.07v-.09h1.41v.09c0,2.4.94,4.53,2.5,6.08,1.56,1.56,3.72,2.5,6.08,2.5s4.52-.94,6.08-2.5c1.56-1.56,2.5-3.68,2.5-6.08v-.09h1.41Z'/%3e%3c/svg%3e)