REGULAR ARTICLE
Lithium and boron analysis by LA-ICP-MS results from a bowed
PWR rod with contact
Anders Puranen
1,*
, Pia Tejland
1
, Michael Granfors
1
, David Schrire
2
, Bertil Josefsson
2
, and Bernt Bengtsson
3
1
Studsvik Nuclear AB, 611 82 Nyköping, Sweden
2
Vattenfall Nuclear Fuel AB, 169 92 Stockholm, Sweden
3
Ringhals AB, 430 22 Väröbacka, Sweden
Received: 9 October 2015 / Accepted: 7 December 2016
Abstract. A previously published investigation of an irradiated fuel rod from the Ringhals 2 PWR, which was
bowed to contact with an adjacent rod, identied a signicant but highly localised thinning of the clad wall and
increased corrosion. Rod fretting was deemed unlikely due to the adhering oxide covering the surfaces. Local
overheating in itself was also deemed insufcient to account for the accelerated corrosion. Instead, an enhanced
concentration of lithium due to conditions of local boiling was hypothesised to explain the accelerated corrosion.
Studsvik has developed a hot cell coupled LA-ICP-MS (Laser Ablation Inductively Coupled Plasma Mass
Spectrometer) equipment that enables a exible means of isotopic analysis of irradiated fuel and other highly
active surfaces. In this work, the equipment was used to investigate the distribution of lithium (
7
Li) and boron
(
11
B) in the outer oxide at the bow contact area. Depth proling in the clad oxide at the opposite side of the rod to
the point of contact, which is considered to have experienced normal operating conditions and which has a
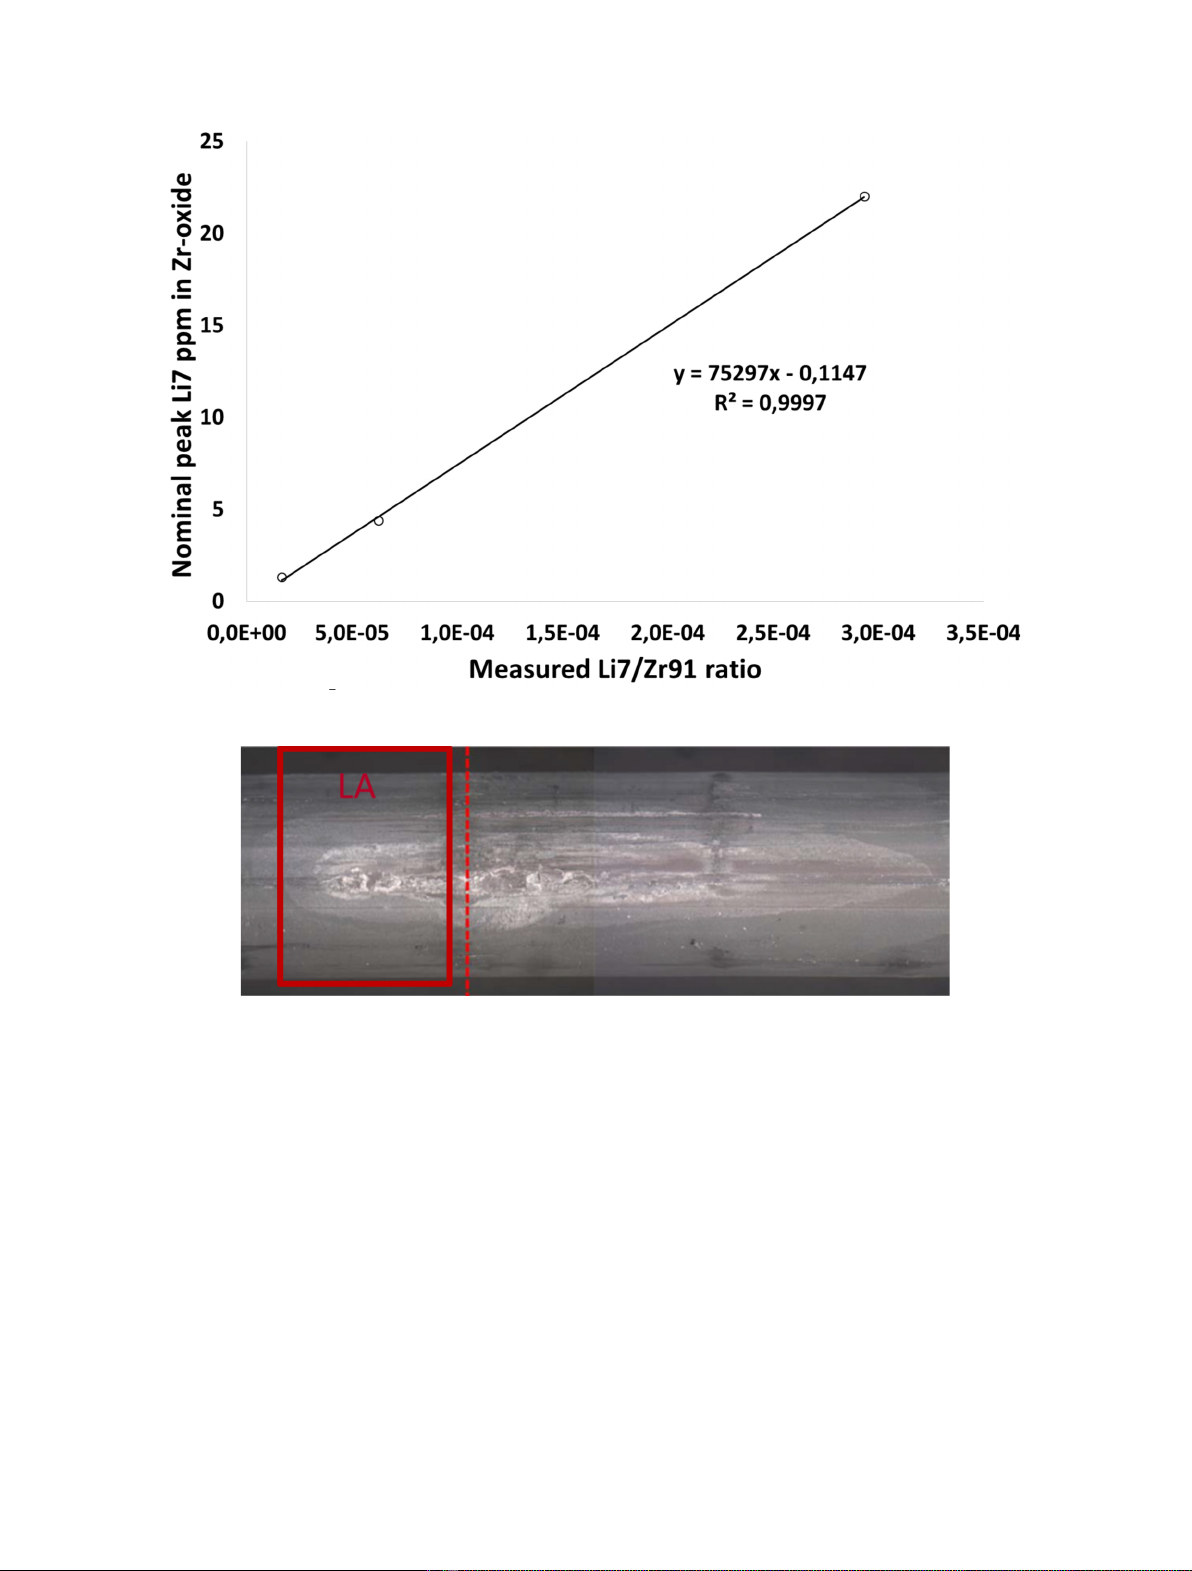
typical oxide thickness, evidenced levels of 1020 ppm
7
Li and a
11
B content reaching hundreds of ppm in the
outer parts of the oxide, largely in agreement with the expected range of Li and B clad oxide concentrations from
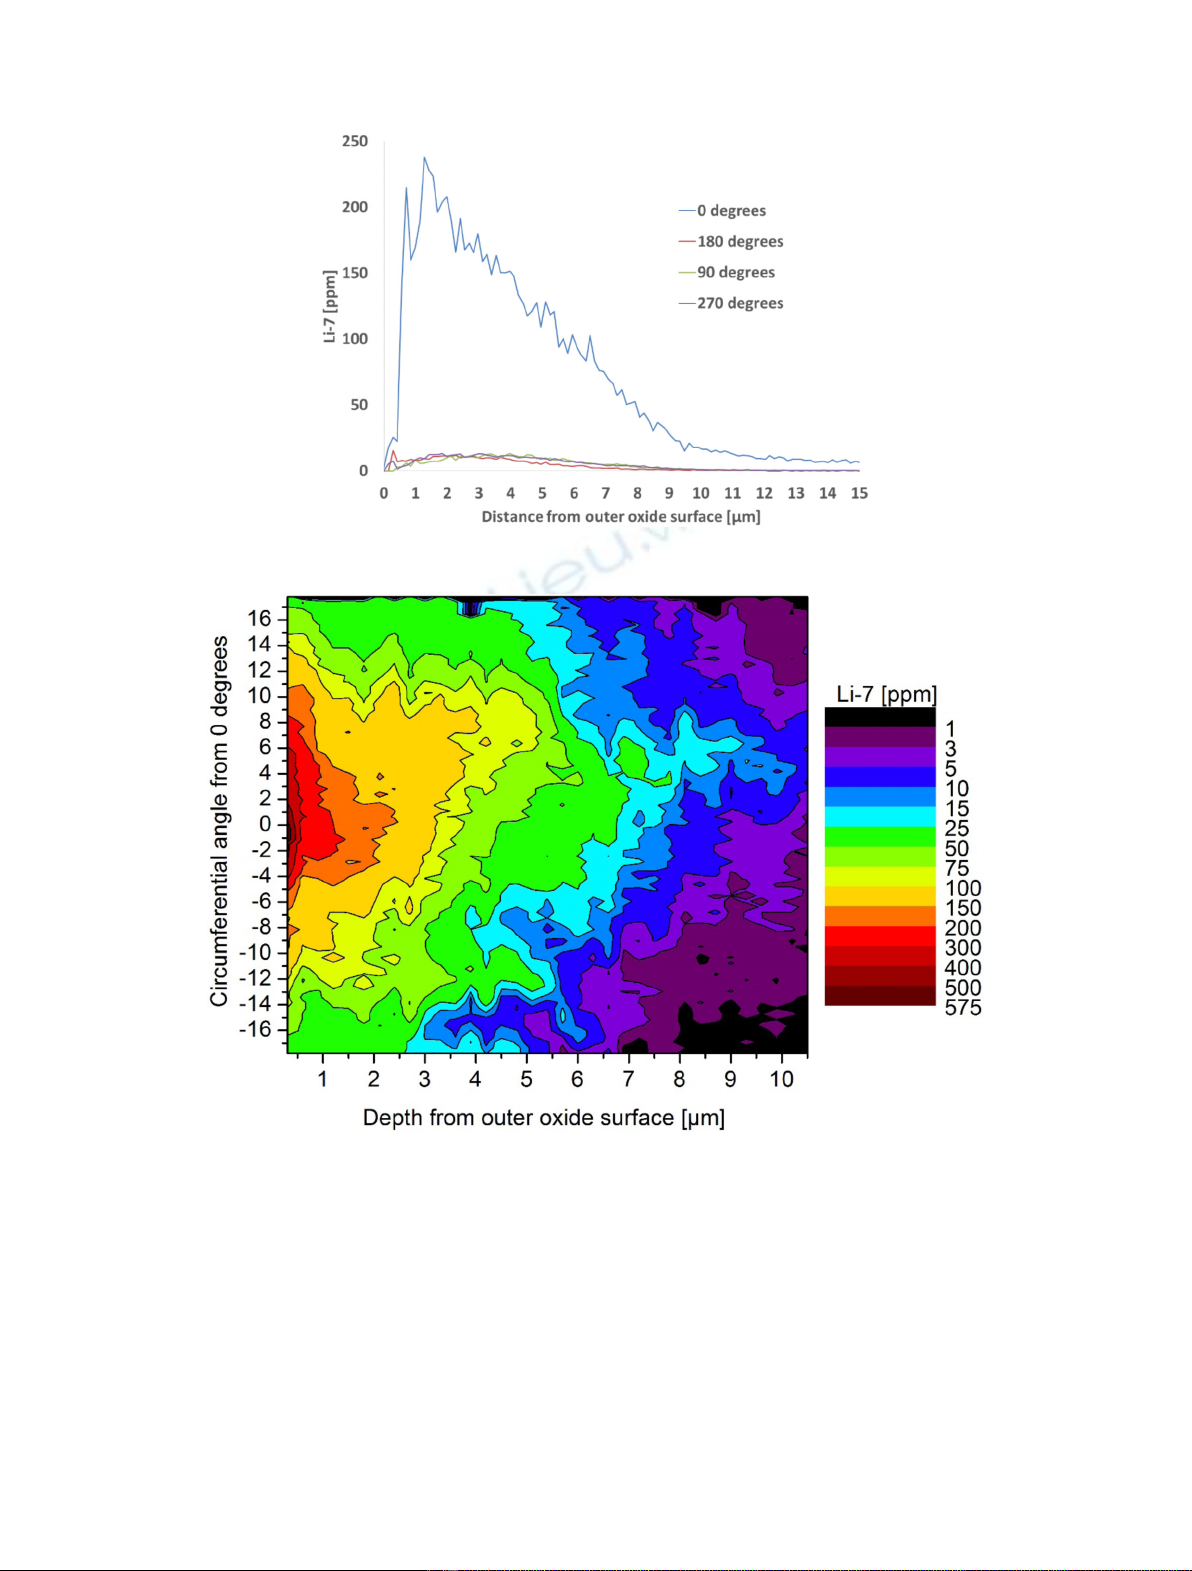
previous studies. In the contact area, the
11
B content was similar to the reference condition at the opposite side.
The
7
Li content in the outermost oxide closest to the contact was, however, found to be strongly elevated,
reaching several hundred ppm. The considerable and highly localised increase in lithium content at the area of
enhanced corrosion thus offers strong evidence for a case of lithium induced breakaway corrosion during power
operation, when rod-to-rod contact and high enough surface heat ux results in a very local increase in lithium
concentration.
1 Introduction
1.1 Background
Results presented at the 2014 WRFPM [1] concerned a
bowed fuel rod with rod-to-rod contact from the Ringhals 2
PWR in Sweden. The contact was identied in the
peripheral row of an assembly during routine inspection
at end of cycle unloading. Because poolside camera
inspection indicated possible increased local corrosion at
the contact area, it was decided to transport the rod to
Studsvik for hot cell post-irradiation examinations (PIE).
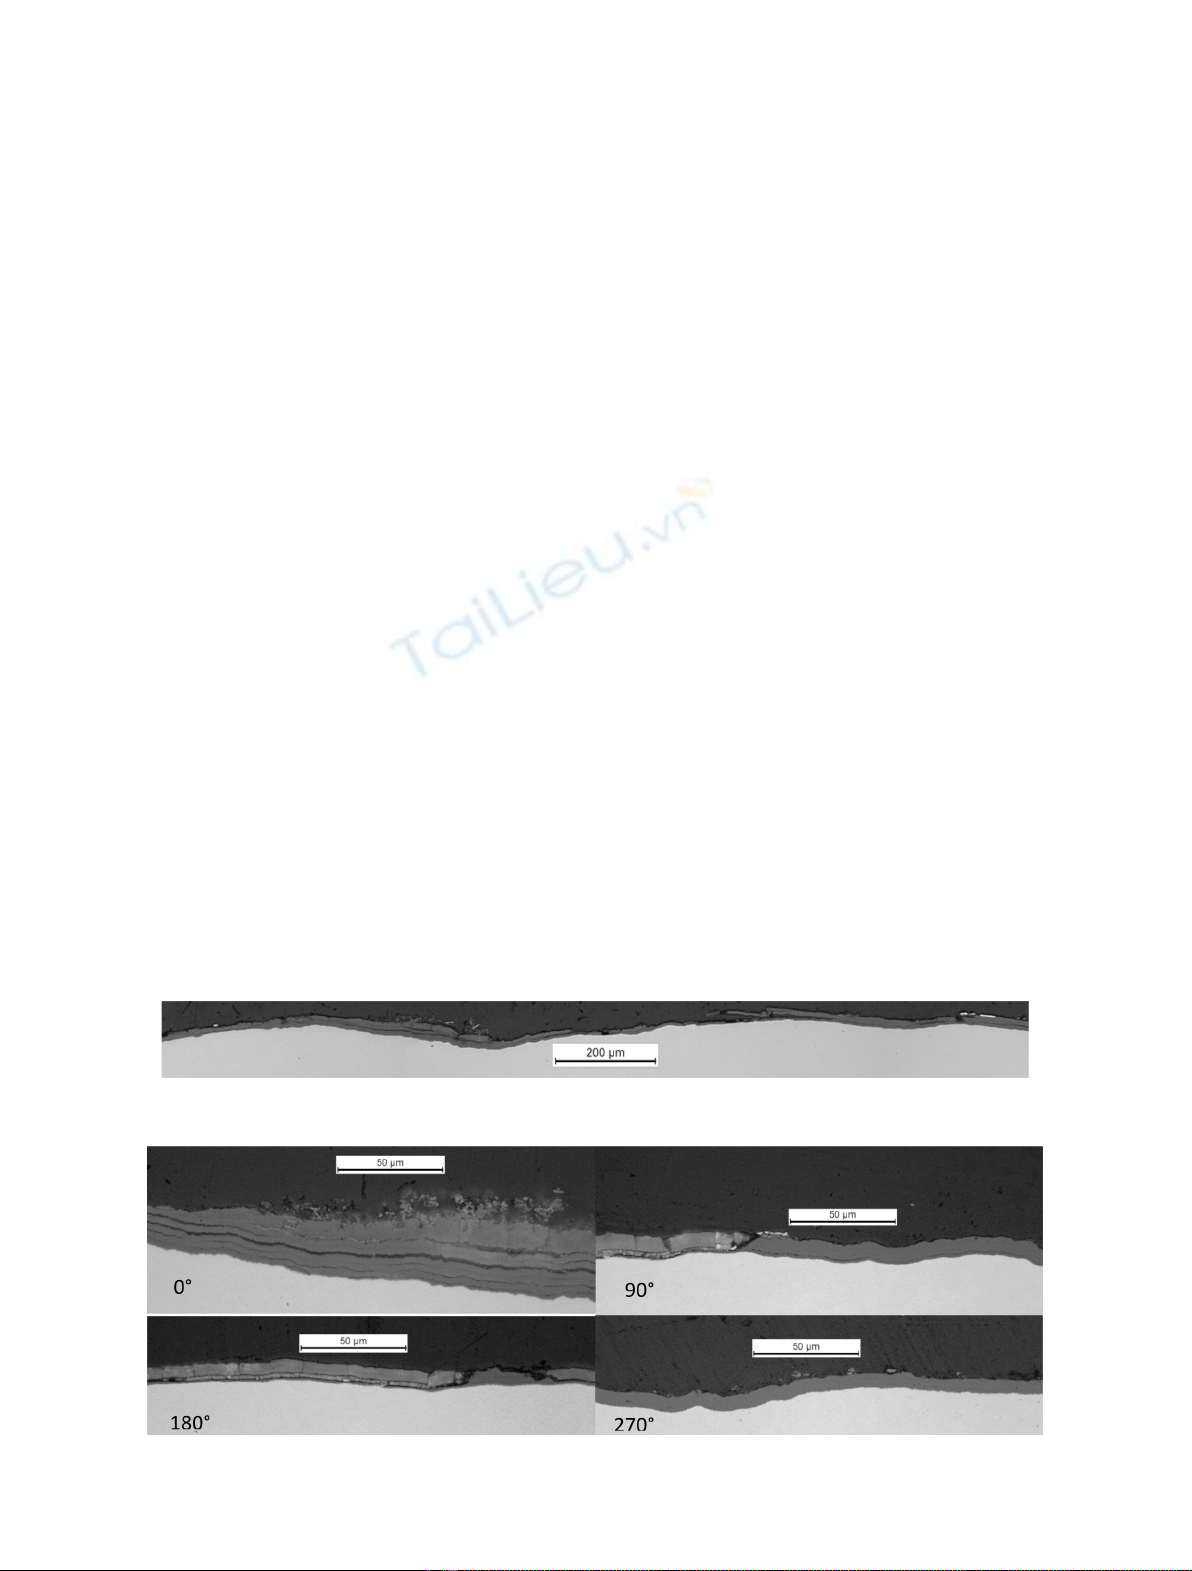
The previously presented PIE [1] identied a signicant
but highly localised thinning of the clad wall and increased
corrosion at the contact area. Rod fretting was deemed
unlikely due to the adhering oxide covering the surfaces. Local
overheating in itself was also deemed insufcient to account
for the accelerated corrosion. The increased clad oxidation
rate was, however, explainable by proposed Li induced
corrosion enhancement under local boiling [2,3]. Enhanced
concentrations of Li and B due to conditions of local boiling in
the crevice-like rod-to-rod contact area was thus hypothesised
to explain the accelerated corrosion. The potential role of
B might, however, also be of a benecial nature [4].
In this work, additional examinations to investigate the
distribution of lithium (
7
Li) and boron (
11
B) in the outer
oxide at the bow contact elevation are presented.
1.2 Fuel and operating history data
Key fuel and operating data are summarised below.
Additional data can be found in [1].
Rod position D15, 15 15, AFA-3G assembly design,
M5
TM
cladding.
Rod average burnup 53.1 MWd/kgU, accumulated
over four 12 month cycles.
Axial elevation of contact 1142 mm, in the relatively
long 2nd to 3rd spacer span.
* e-mail: anders.puranen@studsvik.se
EPJ Nuclear Sci. Technol. 3, 2 (2017)
©A. Puranen et al., published by EDP Sciences, 2017
DOI: 10.1051/epjn/2016042
Nuclear
Sciences
& Technologies
Available online at:
http://www.epj-n.org
This is an Open Access article distributed under the terms of the Creative Commons Attribution License (http://creativecommons.org/licenses/by/4.0),
which permits unrestricted use, distribution, and reproduction in any medium, provided the original work is properly cited.
The contact occurred during the last cycle, as evidenced
by video from the previous end of the cycle inspection.
Last cycle linear heat rate at contact elevation decreasing
from 19 to 13 kW/m during the cycle. No boiling is
expected at this elevation during normal operation.
Last cycle reactor
7
Li concentration 5 ppm, decreasing to
2 ppm.
1.3 Previous PIE results
Key ndings from the previous PIE [1] of the rod are
summarised below.
Peak Eddy Current (EC) oxide thickness at contact area
3550 mm, average oxide thickness away from contact
area 810 mm.
Contact region clad thinning up to 100 mm (transverse
optical microscopy).
Lost clad thickness corresponds to 170 mm of oxide
(assuming a Pilling-Bedworth ratio of 1.55). Signicant
oxide spalling probably occurred.
Reduced clad Vickers hardness in contact region, 215 HV
compared to 232 HV.
Peak outer oxide temperature at contact 360 °C
(calculated from HV and LHR).
Figure 1 shows an overview of the contact region at 0°at
1142 mm elevation (from previous PIE of the rod). Figure 2
shows views of the outer oxide at 0°,90°, 180°and 270°.
2 Additional post-irradiation examinations
2.1 Scope
The scope of investigation consisted of cutting of the
sample, 10 mm long near the rod-to-rod contact point
followed by LA-ICP-MS (Laser Ablation Inductively
Coupled Plasma Mass Spectrometry) investigation of the
7
Li and
11
B content in the outer oxide.
2.2 LA-ICP-MS method
The LA-ICP-MS technique consists of a pulsed laser that
ablates the material to be studied. A carrier gas transports
the created aerosol for analysis to an Inductively Coupled
Plasma Mass Spectrometer (ICP-MS).
The ablation equipment is a New-Wave UP-213 Nd:YAG
laser mounted on a motorized X-Y-Z stage, in connection to
an ablation chamber that is housed in a hot cell. The transport
gas from the ablation cell is injected into a PerkinElmer
Elan 6100 DRC II ICP-MS, coupled to a glove box. The
laser operates at a wavelength of 213 nm with a pulse length
of <4 ns. The ablated spot size can be varied between 5
and 160 mm with an ablation frequency of 120 Hz. The
equipment can be used for spot analysis (drilling) or for line
scans (typical traversing speed 10140 mm/s).
For the results presented in this paper, a laser spot size
of either 160 mm diameter (example in Fig. 3) or a square
95 mm line scanning beam was used (example in Fig. 4). An
ablation frequency of 5 Hz and 100% intensity was
employed. The carrier gas through the ablation chamber
was He (800 ml/min). A makeup ow of 700 ml/min of
Ar was added to the carrier gas prior to the ICP-MS. The
ICP-MS was optimised for the low mass range.
The laser is of the at beam type as can be seen in
Figures 3 and 4, which are examples from ablation on
inactive autoclave oxidised claddings during the calibra-
tion of the instrument. Figure 3 shows example SEM
images of the ablated craters after laser ablation on zirconium
oxide for 1, 3, 6 and 12 seconds (5 Hz, 160 mmspot).
Figure 4 shows a SEM image of the ablated track after
multiple passages with a square beam (95 mm side)
traversing between two pre-ablated spots, creating a
rectangular track.
An ablation depth rate of 0.5 mm/s was achieved for
the spot-wise analysis, alternatively a lateral depth
resolution of 300 nm per passage was obtained when
the beam was traversing the surface.
Fig. 1. Metallography overview of the contact region near 0°(1142 mm elevation).
Fig. 2. Detailed metallography views of the outer oxide at 0°,90°, 180°and 270°.
2 A. Puranen et al.: EPJ Nuclear Sci. Technol. 3, 2 (2017)
Calibration was performed by ablation on a set of
inactive standards obtained via PSI (Paul Scherrer
Institute, Switzerland). The standards consisted of pieces
of cladding with an outer oxide, grown by autoclave
exposure. The standards were implanted with
7
Li ions at
ETH (Swiss Federal Institute of Technology), and were of
the same kind as those used for
7
Li calibration of the SIMS
equipment at PSI. SIMS measurements and SRIM
calculations (Stopping and Range of Ions in Matter) of
the implanted depth prole showed a peak
7
Li content
2.1 mm inside the oxide. Reference [5] provides addi-
tional information on the SIMS analysis and on the use of
the same type of implanted reference materials. With the
above information and the implanted dose, the calculated
peak
7
Li oxide content was used for calibration. The
ablation depth rate was obtained by transforming the
ablation time from the rst rise in
91
Zr signal to the time to
reach the
7
Li peak in the implanted standards, resulting in
a depth rate of 0.5 mm/s (in good agreement with the SEM
results). The same laser and ICP-MS settings were used
for the standards and the samples within the analysis
campaign. Figure 5 shows the Zr-normalised
7
Li calibra-
tion plot.
The uncertainty of the
7
Li calibration is estimated
at ±10%, or ±0.5 ppm for the lower concentrations.
As a secondary objective, non-matrix matched
11
B
intensity calibration was estimated from ablation on NIST
610 and 612 (National Institute of Standards and
Technology, USA), standard reference material glasses,
using the averaged B concentrations reported by Jochum
et al. [6]. Non Zr-normalized
11
B calibration was performed
since the NIST glasses only contain minor amounts of Zr.
The different matrixes, glass vs. Zr/ZrO
2
in the samples as
well as variations in the ablated mass rate (geometry
effects, sample density, etc.) could signicantly affect the
validity of the comparison.
The
11
B calibration uncertainty is thus larger and is
estimated at ±100%.
2.3
7
Li and
11
B results
Cladding analysis of the irradiated fuel rod was performed
at a sample cut out in the lower area of the rod bow contact
(1131 to 1141 mm, marked by solid lines in Fig. 6),
directly below the transversal metallography cross section
at 1142 mm from the rod bottom end (marked by the
dashed line in Fig. 6). The sample was transported to the
laser ablation hot cell without any further preparation (no
defueling required).
Figure 7 shows spot wise laser ablation performed at a
rod elevation of ca. 1140 mm at four different rotations
angles, using the same zero angle as in the original PIE
work [1]. The 0°
7
Li depth prole shows the enormously
elevated
7
Li content in the direction of the contact (near
the area of maximum oxide thickness).
Figure 8 shows a contour plot with
7
Li results based on
multiple line scans at an axial position of 1141 mm in the
circumferential direction near 0°.
The line scans cover approximately ±18°of the
circumference around the 0°position. Each line pass
corresponds to a step of 300 nm into the oxide from the
oxide/coolant interface. Although it may appear that the
outer surfaces are at in the Li and B plots, it should be
pointed out that this is an effect of dening the x-axis as the
ablated depth from the outer oxide surface (from the rise in
Zr-signal during ablation). In reality, both the outer and
Fig. 4. Example SEM image of multiple ablation passes (5 Hz, 95 mm square beam).
Fig. 3. Example SEM images after 1, 3, 6, 12 seconds of ablation (5 Hz, 160 mm beam).
A. Puranen et al.: EPJ Nuclear Sci. Technol. 3, 2 (2017) 3
inner boundaries of the outer oxide (as well as the
thickness) are actually quite irregular (Figs. 1 and 2).
Since the sample is not rotated as the laser traverses the
sample in the circumferential direction, there is also a small
geometrical bias to overestimate the oxide thickness when
the beam is the furthest from the normal plane (0.5 mm
bias at the ±18°endpoints in Fig. 8).
Figure 9 shows a contour plot with
11
B results based on
multiple line scans at the axial position of 1141 mm in the
circumferential direction near 0°(same scan as the
7
Li
results in Fig. 8).
Figure 10 shows a contour plot with
7
Li results from
multiple line scans at the axial position of 1132 mm (a few
millimetres below the contact) in the circumferential
direction near 0°.
Figure 11 shows a contour plot with
11
B results based on
multiple line scans at the axial position of 1132 mm in the
circumferential direction near 0°(same scan as the
7
Li
results in Fig. 10).
Figure 12 shows a contour plot with
7
Li results based on
multiple line scans at the axial position of 1140 mm in the
circumferential direction near 180°.
Figure 13 shows a contour plot with
11
B results based on
multiple line scans at the axial position of 1140 mm in the
circumferential direction near 180°(same scan as in Fig. 12).
3 Discussion & summary
The results show that the
7
Li content in the oxide with a
normal thickness (10 mm) are in agreement with previous
results from irradiated M5
TM
claddings [7], showing a
maximum of 10 to 20 ppm
7
Li about 1to2mm inside the
oxide. This
7
Li oxide distribution is illustrated in Figure 14
(left), which is an alternative plot showing the same data as
in Figure 12.
Figure 14 (right), which is a
7
Li plot from the contact area
with the maximum oxide thickness near 0°, illustrates the
highly localised and strongly enhanced
7
Li content at that
Fig. 5.
7
Li calibration curve from ablation on the inactive standards.
Fig. 6. Overview of the laser ablation sample relative to the contact area.
4 A. Puranen et al.: EPJ Nuclear Sci. Technol. 3, 2 (2017)
location. The circumferential
7
Li concentration prole
appears to follow the oxide thickness prole with a maximum
7
Li concentration of almost 600 ppm on the surface of the oxide
close to the point of maximum oxide thickness (50 mm). This
peak Li value equates to 0.35 atom% Li, if the bulk of the
oxide is assumed to be ZrO
2
. One should point out that the
axial elevation of the sample (1140 mm fromthe bottom end
plug) is from a location with no or very limited conditions of
local boiling during normal operating conditions.
The maximum
7
Li gradient inside the oxide, in the
contact zone, is considerable, with
7
Li concentrations going
from >500 ppm at the surface of the contact to <10 ppm
approximately 10 mm inside the oxide (local oxide
thickness 3050 mm). The enhanced Li content thus seems
to be related to the outer surface of the oxide, and not to the
deeper parts of the oxide or the clad-oxide interface. These
results contrast with the atter Li oxide depth proles from
experiments on Li enhanced rapid corrosion of Zry-4 at
high local voids [2,4]. Keeping in mind that the cladding in
this study is the Nb containing M5
TM
alloy, the results do
however have similarities with Li and B proles from other
Li and B corrosion tests [8]. Interestingly, [8] tentatively
identies a benecial effect of a more compact (imperme-
able to Li) oxide close to the metal interface of Nb
containing Zr-alloys. A recent out-of-pile autoclave study
points in the same direction [9].
Fig. 8.
7
Li contour plot at 1141 mm with circumferential line scans near 0°(oxide thickness 3550 mm).
Fig. 7.
7
Li results at four circumferential angles with the rod contact at 0°.
A. Puranen et al.: EPJ Nuclear Sci. Technol. 3, 2 (2017) 5