REGULAR ARTICLE
A low power ADS for transmutation studies in fast systems
Fabio Panza
1,2,*
, Gabriele Firpo
3
, Guglielmo Lomonaco
1,4
, Mikhail Osipenko
1
, Giovanni Ricco
1,2
, Marco Ripani
1,2
,
Paolo Saracco
1
, and Carlo Maria Viberti
3
1
Istituto Nazionale di Fisica Nucleare Sezione di Genova, Via Dodecaneso33, 16146 Genova, Italy
2
Centro Fermi, Museo Storico della Fisica e, Centro Studi e Ricerche Enrico Fermi, Piazza del Viminale 1, 00184 Roma, Italy
3
Ansaldo Nucleare, Corso F.M. Perrone, 25, 16152 Genova, Italy
4
GeNERG DIME/TEC, University of Genova, Via. AllOpera Pia, 15/A, 16145 Genova, Italy
Received: 17 February 2017 / Received in nal form: 19 June 2017 / Accepted: 10 November 2017
Abstract. In this work, we report studies on a fast low power accelerator driven system model as a possible
experimental facility, focusing on its capabilities in terms of measurement of relevant integral nuclear quantities.
In particular, we performed Monte Carlo simulations of minor actinides and ssion products irradiation and
estimated the ssion rate within ssion chambers in the reactor core and the reector, in order to evaluate the
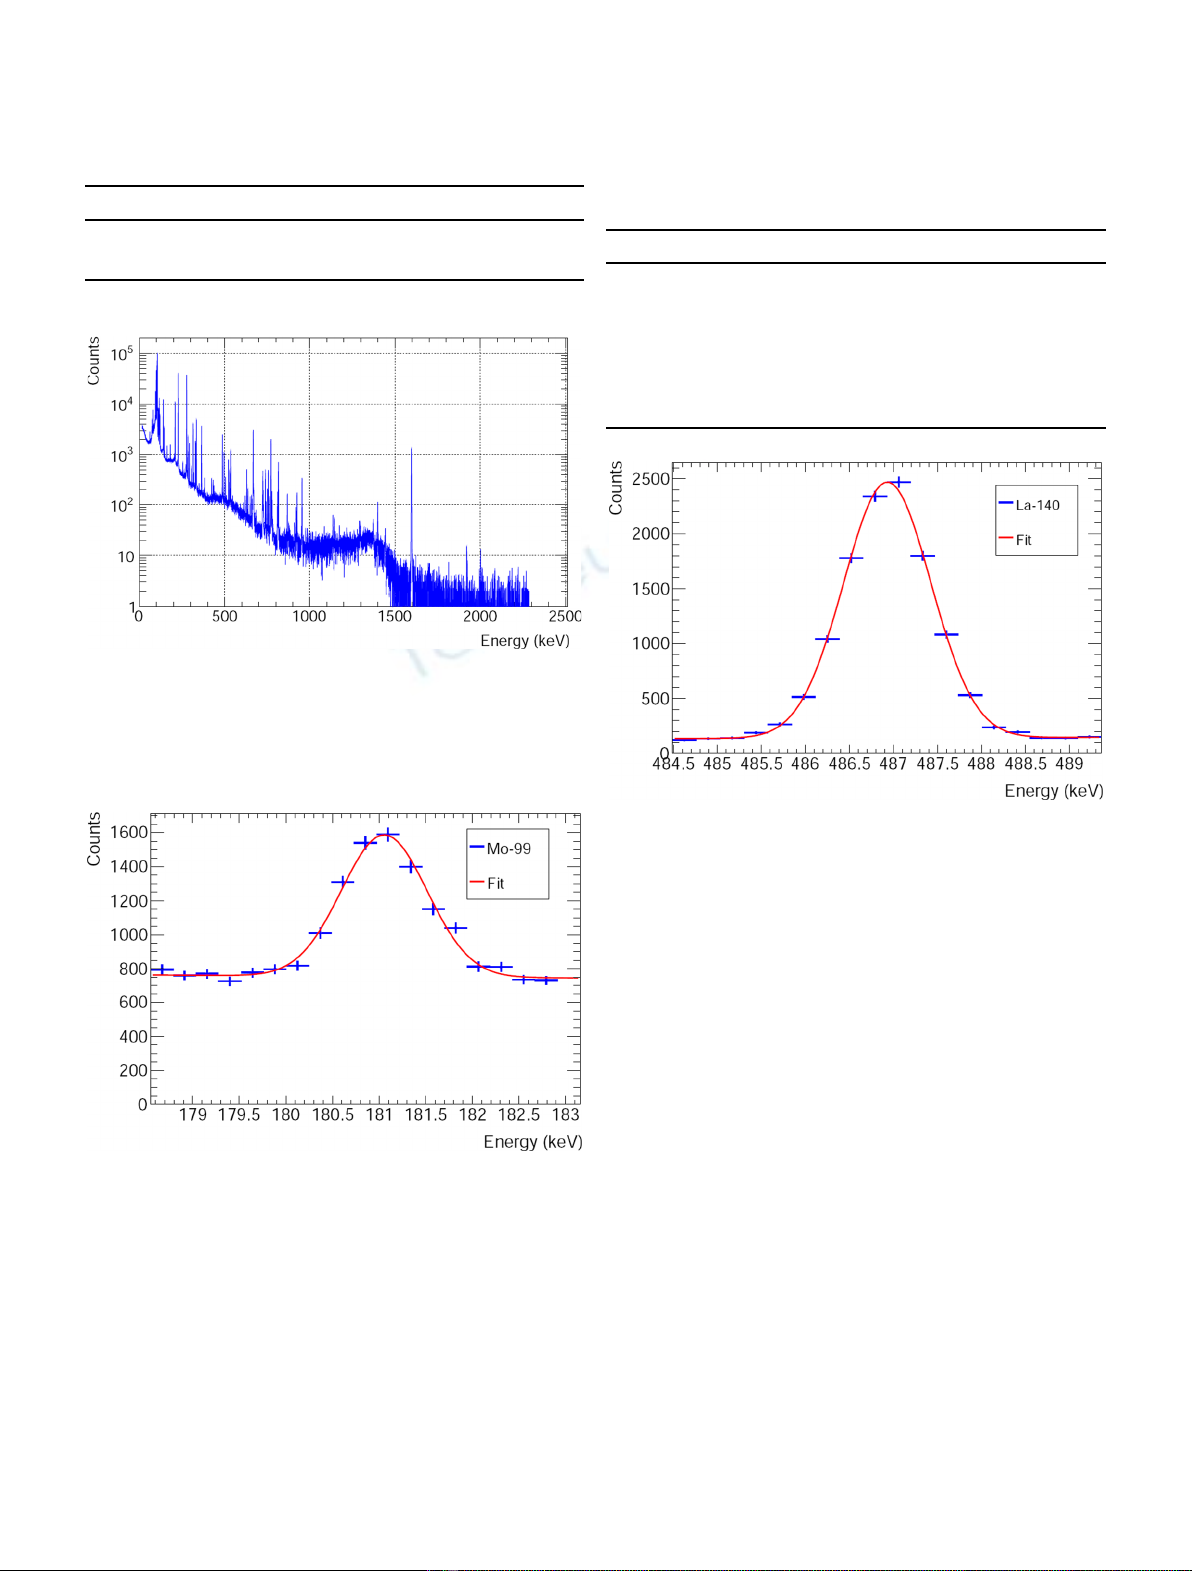
transmutation rates and the measurement sensitivity. We also performed a photo-peak analysis of available
experimental data from a research reactor, in order to estimate the expected sensitivity of this analysis method
on the irradiation of samples in the ADS considered.
1 Introduction
The scope of this work is the study via Monte Carlo
simulations (with the MCNP6 [1] and MCB [2] codes), of a
fast (lead based) subcritical system to perform integral
measurements. Such a system may represent an interme-
diate step. For example, between a zero-power accelerator
driven system (ADS) like GUINEVERE [3] and future high
power machines like MYRRHA [4]. In order to analyze the
possible kind of measurements which can be performed at
such an ADS, we have considered:
direct ssion rate evaluation, by simulating ssion
chambers (FC) with different ssile or ssionable
isotopes depositions, photo-peak analysis of irradiated
samples, as an indirect method to determine the integral
ssion based on the appearance of specicssion
products and simulations of minor actinides (MA)
irradiations in order to apply this methodology to this
specic situation;
direct method to evaluate the integral capture on U-238
based on the appearance of Np-239, this kind of approach
has been used, considering the irradiation simulations of
long and medium lived ssion products (LLFP and
MLFP), in order to estimate the transmutation rate;
MOX time evolution by considering the appearance of
some MA after a sample irradiation simulation.
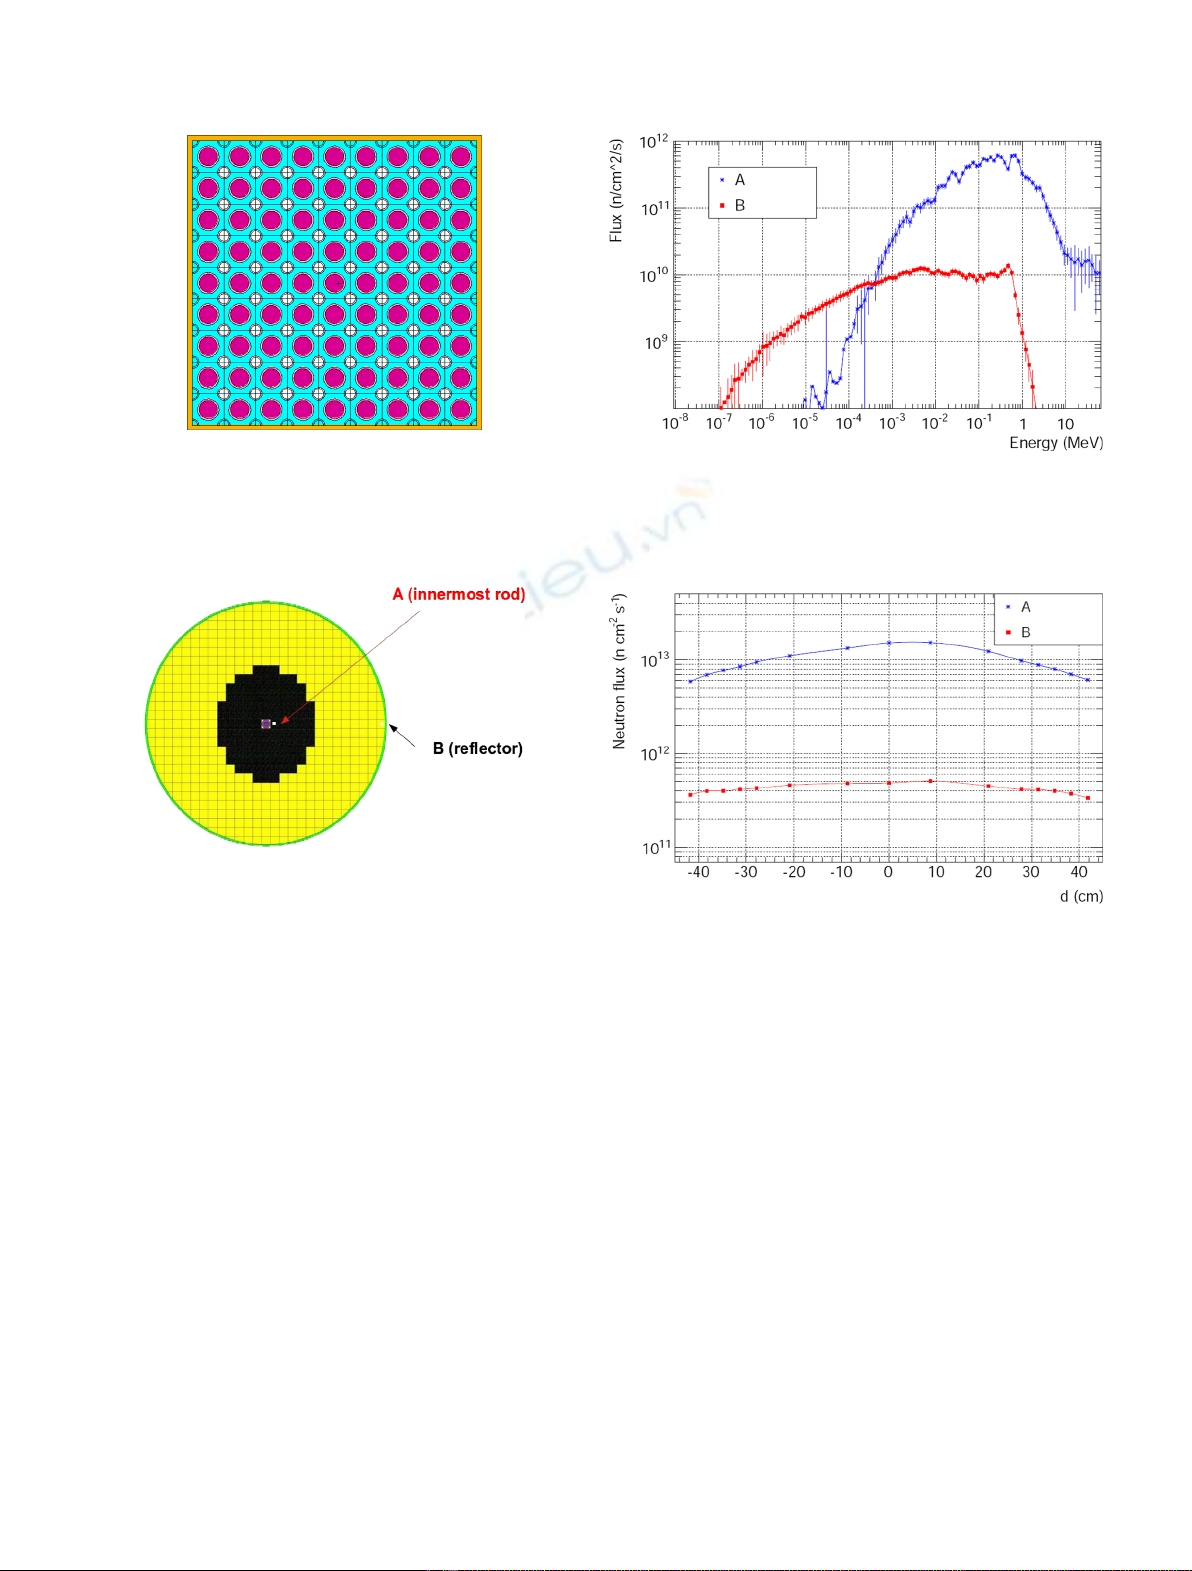
2 ADS description
The geometry of the subcritical core is derived from [5],
where the accelerator driver is a 70 MeV proton beam
generated by a commercial cyclotron. With respect to the
original studies on transmutation capabilities of the above
described machine [6], we chose to double the thermal
power of the system to obtain higher reaction rates. To this
end, we increased the number of fuel assemblies (FAs) from
60 to 110 (increasing the lead reector radius accordingly
from 120 cm to 150 cm). We also changed the fuel from UO
2
with 20% enrichment to the Superphenix MOX composi-
tion [7], in order to consider a more standard fuel, obtaining
ak
eff
around 0.97 and a thermal power around 430 kW. The
k
source
value has been calculated using the following
formula [8]:
PðkWÞ¼ 2:91014N0
vks
1ks
hi ;ð1Þ
where Pin the thermal power, N
0
is the proton beam
current, vis the the mean number of neutrons emitted
during each ssion, and the value obtained is k
s
= 0.978. In
Figure 1 the 9.6 9.6 150 cm
3
FA composed by the
0.357 cm radius and 87 cm length 81 MOX fuel pins
(purple), cladded by 0.07 cm steel (pink) is reported, with
the helium cooling system, provided by 0.125 cm radius
pipes (white), with 0.05 cm thick steel cladding (pink). The
fuel pins are embedded in a solid lead matrix and the
assembly is completely surrounded by a 0.2 cm steel
*e-mail: Fabio.Panza@ge.infn.it
EPJ Nuclear Sci. Technol. 3, 36 (2017)
©F. Panza et al., published by EDP Sciences, 2017
DOI: 10.1051/epjn/2017030
Nuclear
Sciences
& Technologies
Available online at:
https://www.epj-n.org
This is an Open Access article distributed under the terms of the Creative Commons Attribution License (http://creativecommons.org/licenses/by/4.0),
which permits unrestricted use, distribution, and reproduction in any medium, provided the original work is properly cited.
containment (yellow). The reactor core has a radius of
about 80 cm, the total radius of the steel cylindrical vessel is
150 cm and the height is 150 cm, as shown in Figure 2.
All the MCNP simulations, reported here, have been
performed using a measured source spectrum obtained in a
dedicated experiment [9]. We assumed a proton beam with
1 mA current, corresponding approximately to a total rate
of neutron production from the beryllium target of
7.6 10
14
n/s. In Figure 1, the conguration and the
selected irradiation positions A and B, namely close to the
source (A) and in the lead reector (B), are shown in the xy
plane.
The neutron ux energy spectrum (the neutron ux for
each energy bin or group, i.e. n/cm
2
/s/MeV multiplied by
the bin width) in the two positions, close to the source (A)
and in the lead reector periphery (B), is plotted in
Figure 3. It is evident that the spectrum in the position A
presents faster characteristics with respect to the spectrum
in position B; moreover, the integral ux value (the sum of
the uxes over all bins) in position A is about 35 times
greater than the corresponding integral ux in the position
B, as shown in Table 1.
The integral ux as a function of the distance dfrom the
core mid-plane along the vertical axis (axial ux distribu-
tion), both for A and B positions, is shown in Figure 4,
where it is possible to observe, as expected, that the higher
ux intensity can be obtained in the axial mid-plane which
represents the ideal position to perform irradiations.
3 Fission measurements
In this section different kinds of direct and indirect ssion
measurements and simulations have been presented, in
order to show how this system can be considered as a
exible machine for research and training purposes.
A direct evaluation of the ssion rate achievable in
ssion chambers with different depositions (U-235, U-238,
Np-237, Pu-239, Pu-241, Am-241), for each of them
assuming a typical mass m=10mg and assuming 100%
detection efciency has been performed. In the simulation
the FC were placed in either of the two above mentioned
positions (A and B in Fig. 2), in the core and in the lead
reector respectively. The results are reported in Table 2.
Fig. 4. Axial ux distributions in the two positions: close the
source (A) and in the lead reector (B): 0 represents the core mid-
plane (error bars are smaller than the points in the plot).
Fig. 2. 110 FAs conguration plot in xy plane with the
irradiation positions: Position A is close to the source and B is
located at the reector periphery. Beryllium target (purple),
reactor core (black), lead reector (yellow), stainless steel vessel
(green) are shown in the picture.
Fig. 3. Neutron ux energy spectrum (the neutron ux for each
energy bin or group, i.e. n/cm
2
/s/MeV multiplied by the bin
width) in the two positions near the source (A) and in the reector
(B).
Fig. 1. FAs horizontal (xy plan) section with the fuel pins
(purple) embedded in a solid lead matrix (light blue), helium
pipes (white), steel claddings (pink) and steel containment
(yellow).
2 F. Panza et al.: EPJ Nuclear Sci. Technol. 3, 36 (2017)
These simulations give us an idea of the integral
measurements of ssion rates of U-235, U-238, Np-237,
Pu-239, Pu-241 and Am-241 in two different reactor
positions, therefore with neutron uxes that differ in both
intensity and shape. In particular, with the assumed
deposited mass, which appears relatively modest, the
counting rates obtained are high enough that high
precision measurements can be performed within a few
seconds to within several minutes (e.g., in the case of
U-238 in position B).
As part of the integral measurements offered by the
proposed ADS facility, we studied a possible method to
experimentally estimate the MOX fuel burn-up. We
explored the possibility to exploit gamma lines from FP
appearing after irradiation, because the instrumental
sensitivity may be not enough for directly measuring the
disappearance of the fuel isotope components.
As a practical example, we have analyzed the gamma
spectrum measured from a natural Uranium pellet
irradiated for 6 h at 250 W in the central channel of the
TRIGA MARK II facility, a thermal research reactor of the
LENA laboratory (University of Pavia).
An HPGe detector yielded the gamma spectrum that
was analyzed with the Gamma Vision
®
code by ORTEC
®
.
Our purpose was to evaluate the sensitivity and the
systematic uncertainty of this measurement. To get a
feeling of the systematic uncertainty, we compared the
results of the Gamma Vision
®
code to manual ts
performed by means of the ROOT analysis framework
[10]. In Figure 5 we report the gamma spectrum of the
natural Uranium pellet after the irradiation.
We have considered some specicssion products
featuring well-isolated and easily identiable photo-peaks
(La-140 and Mo-99) in the Gamma Vision
®
program and
evaluated the activity of each single peak as reported in the
code users manual [11]. To calculate the activity of each
Table 1. Neutron uxes in the 110 FAs conguration for
the two considered positions (errors are statistical).
Position Integral ux (n/cm
2
/s)
A (1.53 ± 0.01) 10
13
B (4.82 ± 0.01) 10
11
Fig. 5. Gamma spectrum measured from a natural Uranium
pellet irradiated for 6 h at 250 W in the central channel of the
TRIGA MARK II facility, a thermal research reactor of the
LENA laboratory (University of Pavia).
Fig. 6. The 487.03 keV photo-peak of La-140, along with the
ROOT t.
Fig. 7. The 181.09 keV photo-peak of Mo-99, along with the
ROOT t.
Table 2. Fission rates Rfor ssion chambers with
different depositions. A and B are the measurement
positions close to the source and in the reector,
respectively (see Fig. 1).
Material R(ss/s) in A R(ss/s) in B
U-235 (7.15 ± 0.20) 10
5
(3.19 ± 0.63) 10
5
U-238 (2.51 ± 0.03) 10
4
(2.37 ± 0.25) 10
1
Np-237 (6.80 ± 0.08) 10
5
(1.47 ± 0.12) 10
5
Pu-239 (9.09 ± 0.10) 10
5
(2.45 ± 0.12) 10
5
Pu-241 (2.01 ± 0.21) 10
5
(1.62 ± 0.42) 10
3
Am-241 (1.60 ± 0.11) 10
5
(1.01 ± 0.07) 10
3
F. Panza et al.: EPJ Nuclear Sci. Technol. 3, 36 (2017) 3
nuclide, we corrected the number of counts Nin each peak
according to the formula below, using ve factors that take
into account the decay during the irradiation and between
the end of irradiation and the startup of counting (TDC),
the total counting live time (LT), the branching ratio into
that particular peak (BR), the detector efciency (e), and
the self-absorption coefcient (A
c
)[11], according to the
following formula
A¼NTDC
LT BReAc
:ð2Þ
The obtained numbers of counts for the selected peaks
are reported in Table 3.
Then, as an alternative analysis, we have considered the
region around each peak and we have tted the peak +
background with a Gaussian and a linear function (an
assumption for background t), as shown in the following
formula,
NE ¼aeEb2
2c2þdEþe;ð3Þ
with ve parameters, in order to obtain the counting rate in
the signal region using the ROOT analysis package.
Obviously, in order to minimize the statistical uncertain-
ties, we have considered the most populated (but well
isolated) peaks for each isotope.
The tted photo-peaks for La-140 and Mo-99, are
shown in Figures 6 and 7, respectively,
Any difference between the peak area obtained with
ROOT and Gamma Vision
®
beyond statistical uncertain-
ties would be interpreted as systematic uncertainty.
However, in the particular cases considered, we found
the two independent results to be statistically compatible.
The comparison between the two methods is reported in
Table 3.
Obviously, longer measurements would lead to smaller
statistical errors, which could reveal a systematic difference
between the two methods.
Once the activity has been calculated, it is possible to
perform a fuel burn-up evaluation based on the appearance
of the above mentioned FP. In the present example where
we analyzed the data from the TRIGA, we used the ROOT
package to evaluate the burn-up of the U-235 contained in
the natural uranium fuel, because it is more exible and
gives the possibility to isolate each single peak and to
estimate the background with different shapes and
functions. In the case of the ADS with MOX fuel, the
method can be applied to evaluate the main U-235 and Pu-
239 burn-up together (obviously Pu-239 is both created
and destroyed; here we only measure the amount of Pu-239
that underwent ssion). Considering the production of a
specicssion product, knowing its corresponding yield in
the ssion process (Y
f
) and its activity (A), the burn-up, or
in other words the number of ssions, can be determined
using the following formula:
nF¼A
lYf
;ð4Þ
where lis the nuclide decay constant. In Table 4, we report
the fuel burn-up evaluated from different ssion fragments.
These results have been compared with the analytic
formula which gave a U-235 ssioned mass of 1.26 10
10
g
by considering an effective ssion cross section of 102 b for
the central channel of the TRIGA MARK II reactor [12].
The results from the analysis of the three isotopes nicely
agree with each other and with the expected value from the
effective ssion cross section.
While we performed this analysis using a real uranium
sample irradiated in a thermal reactor, our purpose is also
to nd a possible way to apply this methodology to a MOX
fueled fast reactor.
In order to nd a possible application of this method to
a MOX fuel (in which the ssion fragments come mainly
from U-238, U-235 and Pu-239), we propose to consider
three different ssion product activity measurements,
thereby solving a system of three equations in three
variables to distinguish the contributions from the different
nuclides as reported below.
See equation (5) below
where N
FPi
represents the number of nuclides of each single
selected ssion product (in our case we consider three
isotopes); Y
U235/U238/Pu239FPi
is the production yield of
each single considered ssion product from U-235, U-238
and Pu-239; N
U235/U238/Pu239
is the number of U-235, U-238
and Pu-239 ssioned nuclides.
Table 3. Comparison of the ROOT ts and the
GammaVision program for the areas of the photo-peaks
of all three isotopes considered.
Nuclide Counts from ROOT Counts from GV
La-140 10667 ± 137 10592 ± 123
Mo-99 3921 ± 129 3704 ± 145
Table 4. Calculated activities using ROOT ts for the
three selected photo-peaks and corresponding evaluation of
the U-235 burn-up in the data from the TRIGA reactor in
Pavia.
Nuclide Activity (Bq) U-235 Fiss. mass (g)
La-140 (3.62 ± 0.05) 10
4
(1.24 ± 0.02) 10
10
Mo-99 (2.75 ± 0.08) 10
4
(1.25 ± 0.04) 10
10
NFP1 ¼YFP1
U235NU235 þYFP1
U238NU238 þYFP1
Pu239NPu239NFP1
NFP2 ¼YFP2
U235NU235 þYFP2
U238NU238 þYFP2
Pu239NPu239NFP2
NFP3 ¼YFP3
U235NU235 þYFP3
U238NU238 þYFP3
Pu239NPu239NFP3 ;ð5Þ
4 F. Panza et al.: EPJ Nuclear Sci. Technol. 3, 36 (2017)
As a concrete example, we report the Mo-99 activity
emerging after the irradiation in the position A (see Fig. 2)
of the ADS. We considered the actinides mass equal to the
U-235 mass in the sample irradiated at TRIGA (2.8 mg).
After an irradiation period of 0.86 h, in which we have the
same number of ssions as in the case of the natural
uranium irradiation, we obtain a Mo-99 activity of
1.81 10
4
Bq. The minimum detectable activity (MDA)
(6) in the regions of the spectra where some MA photo-
peaks will be present. The MDA at 95% condence level is
given by [11]:
MDA ¼2:71 þ4:65sbg
LT eBR ;ð6Þ
where s
bg
is the poissonian background standard deviation;
LT is the live time of the data acquisition; eis the detector
efciency; BR is the peak branching ratio.
We obtained a Mo-99 MDA value, of 3.16 10
4
Bq
(considering the different background level due to the
higher MOX activity value) for a measurement of 207 s,
higher than the produced Mo-99 activity. But, for example,
if we consider a 2070 s counting, the MDA is reduced by a
factor 3.16, its value is 1.00 10
4
Bq, lower than the Mo-99
activity values that in this case is measurable.
One of the purposes of these studies is to show how a
low-power ADS can be used for integral measurements of
nuclear properties relevant to future fast lead cooled
research systems. Therefore, we studied the effect of
specic irradiations by using the MCB code, in order to
investigate the transmutation rate of selected nuclides. In
particular, we simulated the irradiation of pellets of MA,
Np-237, Am-241, Cm-244, and we studied the possibility to
applicate a gamma analysis on the short lived nuclides
emerging by ssion in the case of MA, (for example Mo-99),
in order to propose a possible methodology to measure low
transmutation rates (like in the considered situation). The
irradiations were simulated by introducing in the core a
dedicated irradiation channel near the neutron source in
the equatorial position, in order to have the highest ux
intensity (see Fig. 2, position A). The evolution of the pellet
composition was calculated by considering a time step
(T
irr
), shorter than the saturation time of the emerging
nucleus considered for the gamma analysis, as reported in
Table 5 (including the natural decay) in the ADS, or the
same period (T
idec
) of pure decay, then comparing the two
nal compositions. The difference between the mass after
T
idec
and T
irr
(i.e., DM), with respect to the initial pellet
mass (i.e., M)are reported in the Table 5.
As we can see from the previous tables, the contribution
of the irradiation to the transmutation, obtained by
subtracting the variation due to the decay, is about 10
5
%
for MA.
In Table 6, the ssion cross sections averaged over the
specic neutron spectrum of positions A and B of Figure 2
(one energy group cross sections) for the considered
nuclides are shown.
Due to the combination of higher integral ux and
concentration of the ux in the fast region, the transmuta-
tion rate for MA is 3 orders of magnitude higher in position
A than in position B. We would like to remark that even if
the transmutation rates of Table 5 are low, in principle, it is
possible to evaluate the transmutation of MA, reported in
Tables 5 and 6, by measuring the high activity of the short
lived nuclides produced by neutron capture or ssion,
instead of directly evaluating the small activity difference
of the original nuclide before and after the irradiation,
which could be beyond the experimental sensitivity.
To give an idea of the possible application of this
method, in Table 7 we report the activity of Mo-99
produced after Np-237, Am-241 and Cm-244 ssion
starting from a pellet of 2.8 mg (the same U-235 mass in
the irradiated sample at TRIGA) after a time step of 0.86 h.
Therefore we can conclude that the activity of the
obtained short lived nuclei are comparable or higher with
respect those measured and reported in Section 5.We
remark that for the MA case, we obtain a Mo-99 activity
quite similar to the one shown in Table 4, measured after
irradiation of a natural uranium sample in a thermal
reactor (TRIGA) operating at a power level of 250 W. Even
if the U-235 ssion cross section is 100 time greater in a
Table 5. Irradiation, decay times and results for MA
pellets in position A.
Nuclide T
irr
=T
dec
(h) DM/M(%)
Np-237 0.86 7.02 10
6
Am-241 0.86 5.86 10
6
Cm-244 0.86 5.31 10
6
Table 6. MA ssion one energy group cross sections in the
A and B positions.
Nuclide spos. A (b) spos. B (b)
Np-237 1.5 1.0
Am-241 1.3 1.2
Cm-244 1.1 0.3
Table 7. MA parents, short lived daughter nuclei
produced and their activities.
Parent Fission fragment Activity (Bq)
Np-237 Mo-99 3.08 10
4
Am-241 Mo-99 2.07 10
4
Cm-244 Mo-99 2.575 10
5
Table 8. Comparison of the ROOT ts and the Gamma
Vision
®
program for the area of the photo-peak of Np-239.
Nuclide Counts from ROOT Counts from GV Diff. (%)
Np-239 139551 ± 141 144535 ± 380 3.95 ± 0.01
F. Panza et al.: EPJ Nuclear Sci. Technol. 3, 36 (2017) 5