REGULAR ARTICLE
Evolution of the collective radiation dose of nuclear reactors
from the 2nd through to the 3rd generation and 4th generation
sodium-cooled fast reactors
Joel Guidez
1,*
and Anne Saturnin
2
1
CEA, DEN, 91191 Gif-sur-Yvette, France
2
CEA, DEN, DMRC, SA2I, 30207 Bagnols-sur-Cèze, France
Received: 30 January 2017 / Received in nal form: 23 May 2017 / Accepted: 26 September 2017
Abstract. During the operation of a nuclear reactor, the external individual doses received by the personnel are
measured and recorded, in conformity with the regulations in force. The sum of these measurements enables an
evaluation of the annual collective dose expressed in man·Sv/year. This information is a useful tool when
comparing the different design types and reactors. This article discusses the evolution of the collective dose for
several types of reactors, mainly based on publications from the NEA and the IAEA.
The spread of good practices (optimization of working conditions and of the organization, sharing of lessons
learned, etc.) and ongoing improvements in reactor design have meant that over time, the doses of various
origins received by the personnel have decreased.
In the case of sodium-cooled fast reactors (SFRs), the compilation and summarizing of various documentary
resources has enabled them to be situated and compared to other types of reactors of the second and third
generations (respectively pressurized water reactors in operation and EPR under construction). From these
results, it can be seen that the doses received during the operation of SFR are signicantly lower for this type of
reactor.
1 Introduction
Since 1992, the Information System on Occupational
Exposure (ISOE) program, supported by the OECD/NEA
and the IAEA, has collected and analyzed data concerning
the radiological exposure of personnel working in nuclear
power plants. The electricity producers and national
regulatory authorities of around 30 countries participate
in this network, which includes 90% of the commercial
nuclear power reactors in the world (400 operating reactors
and 80 shutdown reactors). Each year, the ISOE draws up
lists of the collective dose for the different types of reactors
[1,2].
Nevertheless, the dose rates for sodium-cooled fast
reactors (SFRs), as well as for other facilities in the fuel
cycle, have not been assessed by the ISOE program. At
Marcoule, the CEA has gathered information published in
the literature in order to develop a specic database giving
additional information. This article is therefore based on
these two sources.
2 Causes of irradiation during the operation
of a reactor
During reactor operation, several factors contribute to
personnel exposure, with external irradiation due to
gamma rays being the main contributor.
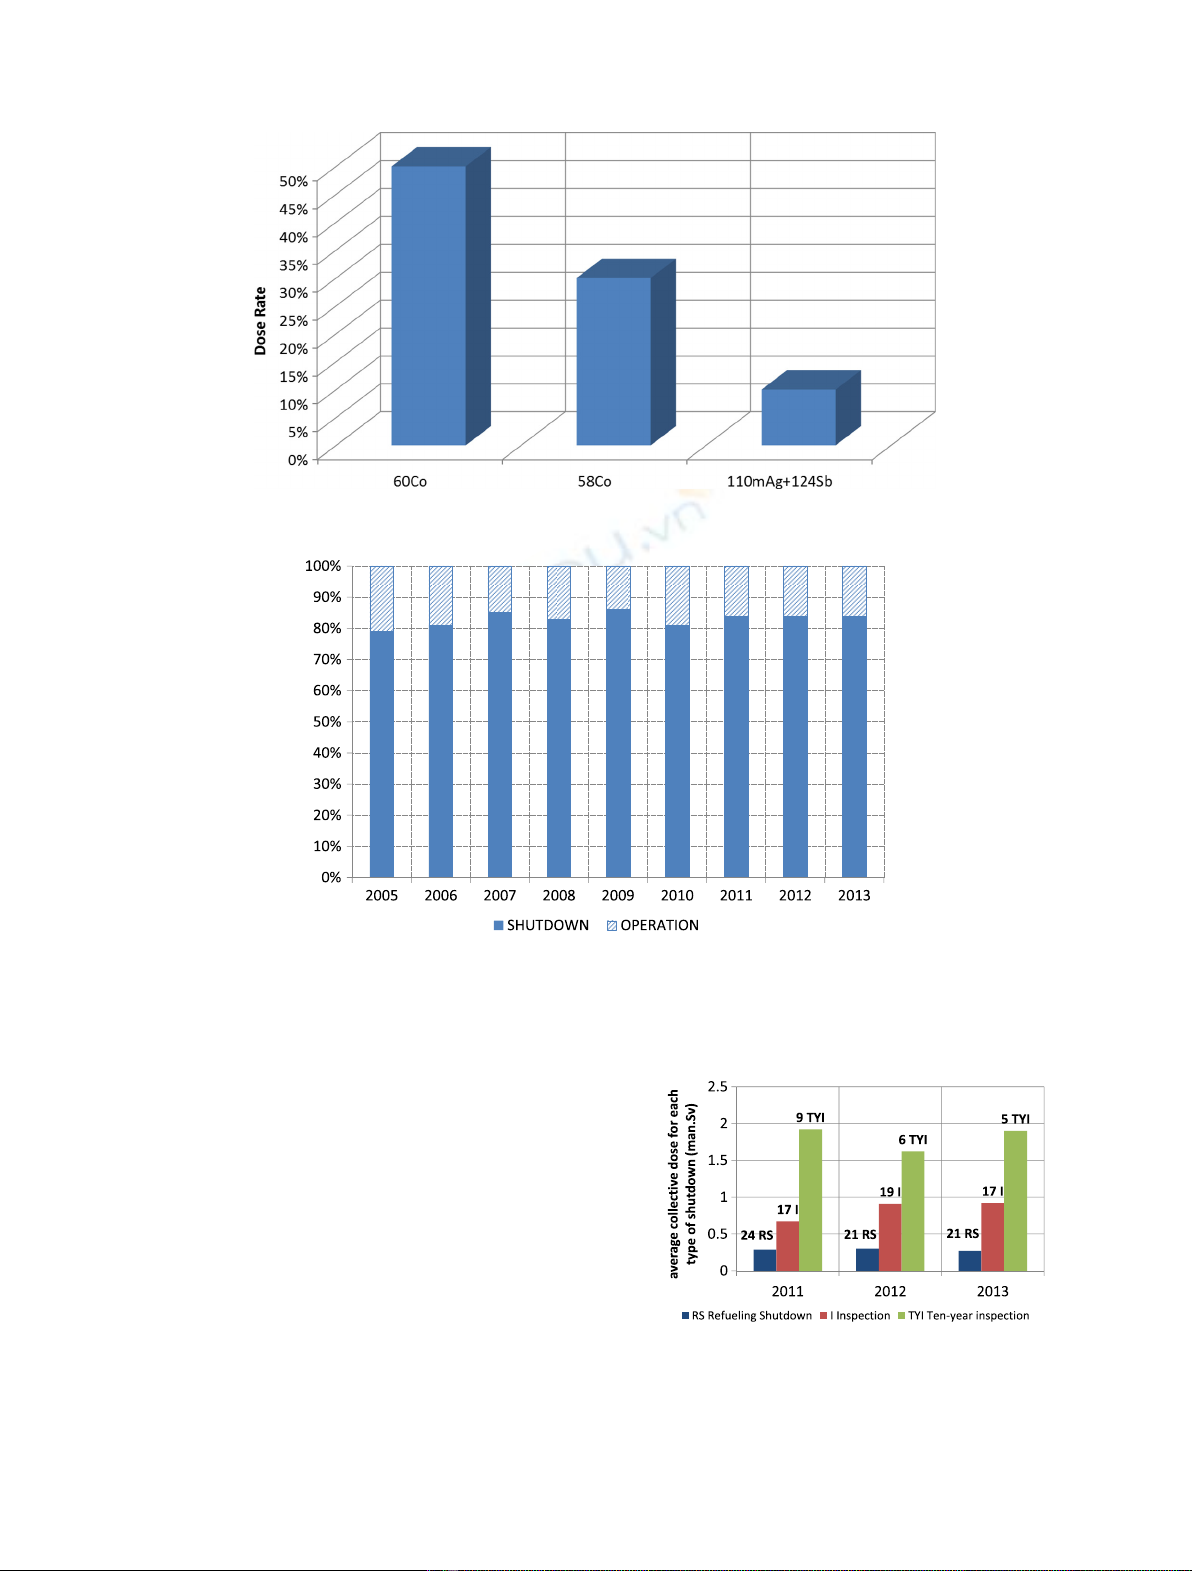
For pressurized water reactors (PWRs), virtually all
the doses absorbed come from the activation of corrosion
products coming from the main alloys found in the primary
and auxiliary circuits [3]. More than 90% of the doses
absorbed come from surface contamination caused by
activated corrosion products (see Fig. 1).
Fission product contamination of the primary circuit
may come from a rupture or from a leak tightness defect in
certain fuel pins. Fission products like krypton, xenon,
iodine or cesium are then released and can be found,
depending on the case, in gaseous phase or in the coolant.
In the case of boiling water reactors (BWRs), an
additional source of external exposure must be considered
for personnel working in the turbine hall. This is
16
N, an
activation product with an energetic gamma ray that is
carried by the primary circuit to the turbines.
Furthermore radioactive gases, like tritium, may also
be spread into the circuits.
*e-mail: joel.guidez@cea.fr
EPJ Nuclear Sci. Technol. 3, 32 (2017)
©J. Guidez and A. Saturnin, published by EDP Sciences, 2017
DOI: 10.1051/epjn/2017024
Nuclear
Sciences
& Technologies
Available online at:
https://www.epj-n.org
This is an Open Access article distributed under the terms of the Creative Commons Attribution License (http://creativecommons.org/licenses/by/4.0),
which permits unrestricted use, distribution, and reproduction in any medium, provided the original work is properly cited.
In certain zones of the reactor, the presence of these
radionuclides can lead to an increase in the atmospheric
radioactivity and may mean temporary access bans when
the unit is in operation.
During a production period, the personnel exposed to
doses are mainly those involved in maintenance operations.
The activities causing the highest dose rates usually take place
during unit shutdown. According to the ISOE [1]andtheIRSN
[5], in PWRs about 80% of the annual radiation exposure can
be attributed to maintenance operations carried out during
unit shutdown (see Fig. 2). For water-cooled reactors, this may
for example include vessel opening operations, equipment
handling, maintenance or repair work on contaminated or
activated equipment, lter changes, etc. Finally, the balance
sheets published show that the dose vary depending on the
type of unit shutdown, with the collective dose distribution
being, in ascending order: refueling shutdown (RS),
inspections (I) or 10-yearly inspections (see Fig. 3).
For SFRs, the causes of irradiation during operation are
different. For example, activated corrosion products
remain conned in the primary circuit and unit shutdown
does not mean the vessel or its circuits are opened.
Fig. 1. Main contributors to doses coming from surface contamination by activated corrosion products [4].
Fig. 2. Distribution of the French reactor eet collective doses for shutdown and operational phases [1].
Fig. 3. Average collective doses for the French reactor eet by
type of unit shutdown [6].
2 J. Guidez and A. Saturnin: EPJ Nuclear Sci. Technol. 3, 32 (2017)
3 Collective doses for the main types of
reactors (not including SFR)
The evolution of annual collective doses for the different
types of reactor is shown in Figure 4.Thisgure, taken from
the ISOE report published in 2012, gives average values over
three years between 1992 and 2012 for several types, each of
the values grouping reactors with different power levels [1].
In spite of these differences, the overall trend observable
during recent years, and for all of the reactors taken into
account, is a steady decrease in the annual collective dose.
The quasi-constant difference between the doses for PWR
and BWR reactors can be noted. The PHWR-type
(CANDU) reactors are nevertheless the exception, as a
slight increase has been noted for them since 19961998.
This overall trend toward a decrease in the collective dose
worldwide is due to several factors, among which are
reinforced regulations, technological progress, improvements
in facility design and in water chemistry, in operation
preparation and procedures, team involvement, and of course
data and lessons learned shared at the international scale [7].
According to the ISOE reports for the period 2010
2012, the trends per reactor type [1], independent of their
respective power levels, are as follows:
a PWR reactor has an average collective dose of
0.60 man·Sv/year varying between 0.32 and
0.88 man·Sv/year;
a BWR reactor has an average collective dose of
1.12 man·Sv/year varying between 0.43 and
3.37 man·Sv/year;
a CANDU/PHWR reactor has an average collective dose
assessed to be around 1.34 man·Sv/year varying between
0.35 and 2.59 man·Sv/year.
The graphite-gas type reactors (gas-cooled reactors, or
GCRs), mostly operated in the United Kingdom, give the
lowest average collective dose, i.e. 0.06 man·Sv/year (note that
GCRs have a power level of between 475 and 610 MWe [8]).
Apart from the marked reactor type effect grouping
reactors with different power levels, numerous different
factors may cause the disparities found between different
countries and sites as concerns exposure to ionizing
radiation.
In spite of on-going efforts focusing on good practices,
optimizations, and organization, etc., these gures tend
toward asymptotic values in the different countries. If this
trend is conrmed, further decreases can be logically
expected for tomorrows reactors through continuing
design enhancements.
4 Evolution of the French PWR eet
Like the different reactor eets elsewhere in the world, the
collective dose for the French reactor eet has considerably
decreased since the 1990s, as a result of progress made in
man.Sv/year
man.Sv/year (LWGR)
Fig. 4. Annual collective dose by type of reactor [1].
Fig. 5. Average annual collective dose per reactor in the French
eet [1012].
J. Guidez and A. Saturnin: EPJ Nuclear Sci. Technol. 3, 32 (2017) 3
operating conditions, optimizations, source term reduc-
tion, work organization, etc. [9] (see Fig. 5). Since 2007, the
collective dose has stabilized, varying depending on the
type and the number of unit downtimes [10].
Figure 6 highlights the differences as well as the
progress made for each power level (900, 1300 and
1450 MW) between 1979 and 2009. Looking at the year
2009, the average collective dose for the entire reactor eet
was 0.69 man·Sv/year/reactor. Focusing on the thirty-four
900 MWe power level reactors, the average dose was
0.79 man·Sv/year/reactor. In the case of the 24 reactors in
the 1300 and 1450 MWe power group, the average
collective dose was 0.57 man·Sv/year/reactor at that time
[1]. The less powerful reactors nd advantage in such a
direct comparison. Weighting based on the electrical power
would show even greater differences.
In the case of the EPR, a radiation protection
optimization approach was set up right from the reactor
design phase, based on experience and lessons learned from
already-commissioned reactors [14]. The annual collective
dose objective is 0.35 man·Sv [14].
5 SFRs overview
Here, the focus is more specically on SFR, the reference
reactor type for 4th generation reactors. In this case,
external doses have different causes: activated corrosion
products (mainly
54
Mn
1
and
60
Co
2
) deposited on the
primary circuit components (pumps, exchangers), the
activation of the sodium and of its impurities, ssion
products if cladding ruptures, and tritium produced by
ternary ssion reaction and by boron activation.
The SFR type of reactor had not been taken into
account in the comparative analyses published by the
ISOE. Different documents were therefore compiled and
analyzed to make up for this lack of data. The collective
dose for the seven reactors, whose main features are noted
in Table 1, was examined. This is therefore the rst
overview based on data published over a long period and
coming from different organizations, without specic
information as to the methodology employed. Neverthe-
less, this analysis has the advantage of giving a rst general
summary enabling general trends to be extrapolated.
With the exception of the BN 600 reactor (Russia),
which reported higher values, the collective dose for SFRs
was less than 0.4 man·Sv/year. The data for the BN 600
reactor vary widely with gures between 0.5 and
1.9 man·Sv/year for the period 19802001, according to
reference [21] (2004 data, see Fig. 7).
Fig. 6. Average annual collective dose by reactor type in the French eet (from [13]).
Table 1. Sodium-cooled fast reactors taken into account.
Country Reactor type Initial criticality Shutdown MWth MWe References
FBTR India Loop 1985 40 13 [15]
EBR-II United States Pool 1961 1991 62.5 20 [16]
FFTF United States Loop 1980 1993 400 Non-coupled [17]
Phénix France Pool 1973 2009 563 255 [18]
PFR United Kingdom Pool 1974 1994 650 250 [19,20]
BN-600 Russia Pool 1980 1470 600 [21,22]
Superphénix France Pool 1985 1997 3000 1240 [23]
1
Produced by the activation of iron coming from the structures.
2
Produced by the activation of impurities present in certain
components.
4 J. Guidez and A. Saturnin: EPJ Nuclear Sci. Technol. 3, 32 (2017)
After 2005, the values seem to indicate a downward
trend, with a collective dose of 0.48 man·Sv/year in 2013
[22] (2014 data, see Fig. 7). It should be noted that the
doses recorded between 2000 and 2003 do not seem to t
those of reference [21]. Therefore these data need to be
checked and consolidated. Even if the last decade has seen
improvements in certain practices which have enabled
results closer to those of other reactors, the values reported
for BN 600 remain considerably higher than those of other
facilities of the same type. The reasons for these differences
have not yet been analyzed (Fig. 8).
Among the differences found for the SFR and considered
here, it can be noted that the FBTR and FFTF reactors are
designed with loops, i.e. their primary pumps and interme-
diate heat exchangers are located outside the vessel, and are
linked to it by primary pipe lines (see Fig. 9). The other
reactors have these components (primary pumps, interme-
diate heat exchangers) integrated within the main vessel.
Even if the loop reactor designs should a priori give higher
dose, the lack of information and data available means a nal
assessment cannot be made at present.
With the exception of the values concerning the BN 600
reactor, it can be seen that the highest values have been
recorded for the PFR reactor, for which numerous manual
interventions have been necessary. The lowest values were
obtained for the Superphénix reactor, with collective dose
varying between 0.01 and 0.03 man·Sv/year, with no
noticeable differences between the shutdown periods and
1986, the year in which the reactor was connected to the
power grid for a total of 245 days [23].
In the case of the Phénix reactor, the accumulated collective
dose recorded was 2.3 man·Sv over a period of 35 years, i.e. an
annual average of 0.065 man·Sv/year (see Fig. 10).
The more or less marked variations recorded between
1974 and 2009 were due to exceptional operations which led
to a maximum collective dose of 0.16 man·Sv/year.
These operations involved special repairs for major
components (pumps/exchangers, etc.) or renovation and
inspection work sites (for example, concerning vessel
internal structures in 1999). It is interesting to note that
when the reactor was functioning normally, the dose
tended to be between 0.02 and 0.04 man·Sv/year.
Fig. 7. Evolution of the collective dose for the BN 600 reactor between 1982 and 2013 [21,22].
Fig. 8. Collective dose for different SFRs.
J. Guidez and A. Saturnin: EPJ Nuclear Sci. Technol. 3, 32 (2017) 5