REGULAR ARTICLE
RadFET dose response in the CHARM mixed-eld: FLUKA
MC simulations
Matteo Marzo
*
, Stefano Bonaldo, Markus Brugger, Salvatore Danzeca, Ruben Garcia Alia,
Angelo Infantino, and Adam Thornton
CERN, European Organization for Nuclear Research, Geneva, Switzerland
Received: 18 January 2017 / Received in nal form: 16 May 2017 / Accepted: 19 June 2017
Abstract. This paper focuses on Monte Carlo simulations aimed at calculating the dose response of the
RadFET dosimeter, when exposed to the complex CHARM mixed-elds, at CERN. We study how the dose
deposited in the gate oxide (SiO
2
) of the RadFET is affected by the energy threshold variation in the Monte
Carlo simulations as well as the materials and sizes of scoring volumes. Also the characteristics of the input
spectra will be taken into account and their impact on the nal simulated dose will be studied. Dose variation as a
function of the position of the RadFET in the test facility will be then examined and comparisons with
experimental results will be shown. The contribution to the total dose due to all particles of the mixed-eld,
under different target-shielding congurations, is nally presented, aiming at a complete characterization of the
RadFETs dose response in the CHARM mixed-elds.
1 Introduction
We present Monte Carlo calculations of the dose response
of the RADiation sensing Field Effect Transistors
(RadFET) [14], when they are exposed to the radiation
environment at the CERN High Energy Accelerator
Mixed-eld (CHARM) test facility [5,6].
The main purpose of the facility is to replicate different
radiation environments (space, atmospheric, accelerator
complexes, for instance) for radiation effects testing on
electronic components and systems. RadFETs at CHARM
are then used as online dosimeters during the radiation
tests, to characterize the complex mixed-elds reproduced
in the test area.
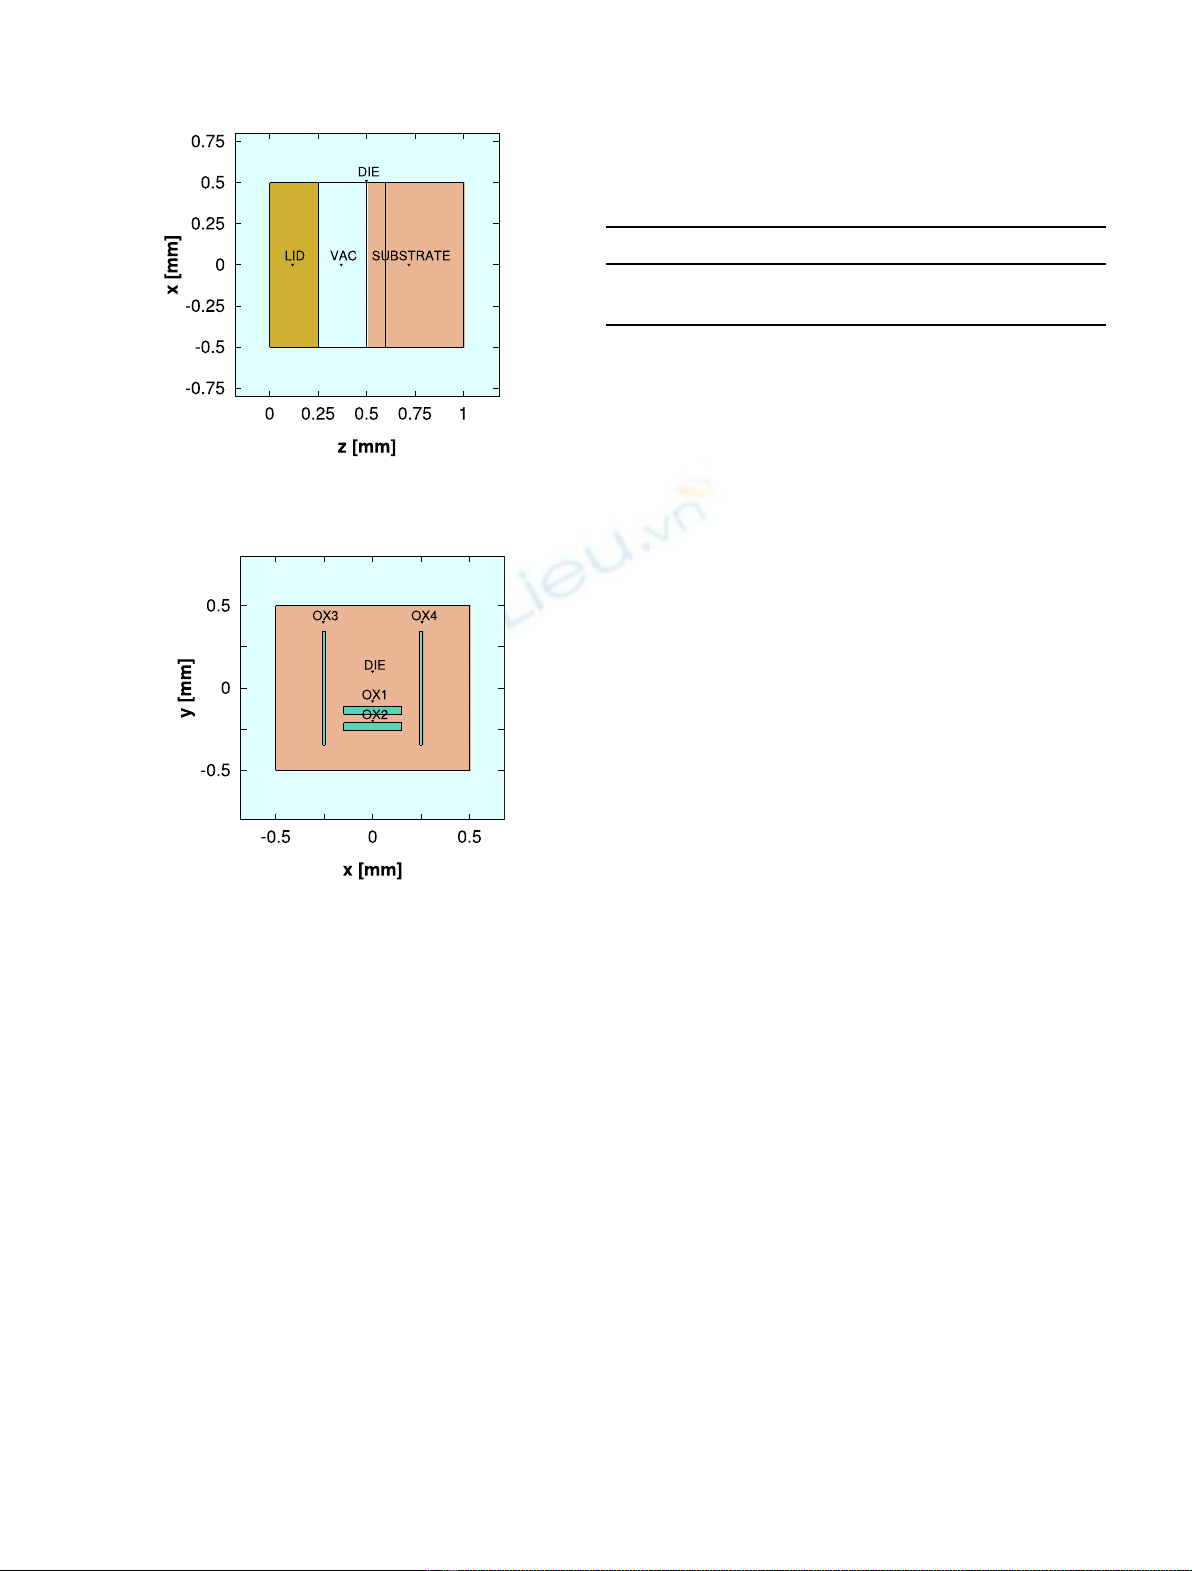
In this regard, we are interested in investigating the
dose deposited in the gate oxide (GO) of the RadFET. The
GO is a very small sensitive volume where the increase of
the accumulated charge dQ
tot
, as a consequence of the
exposure to the radiation elds of interest, implies a change
of the sourcedrain channel thickness of the MOSFET.
This causes a drift in the threshold voltage dV
th
of the
device and a modication of its electric response, which can
therefore be correlated to the deposited dose.
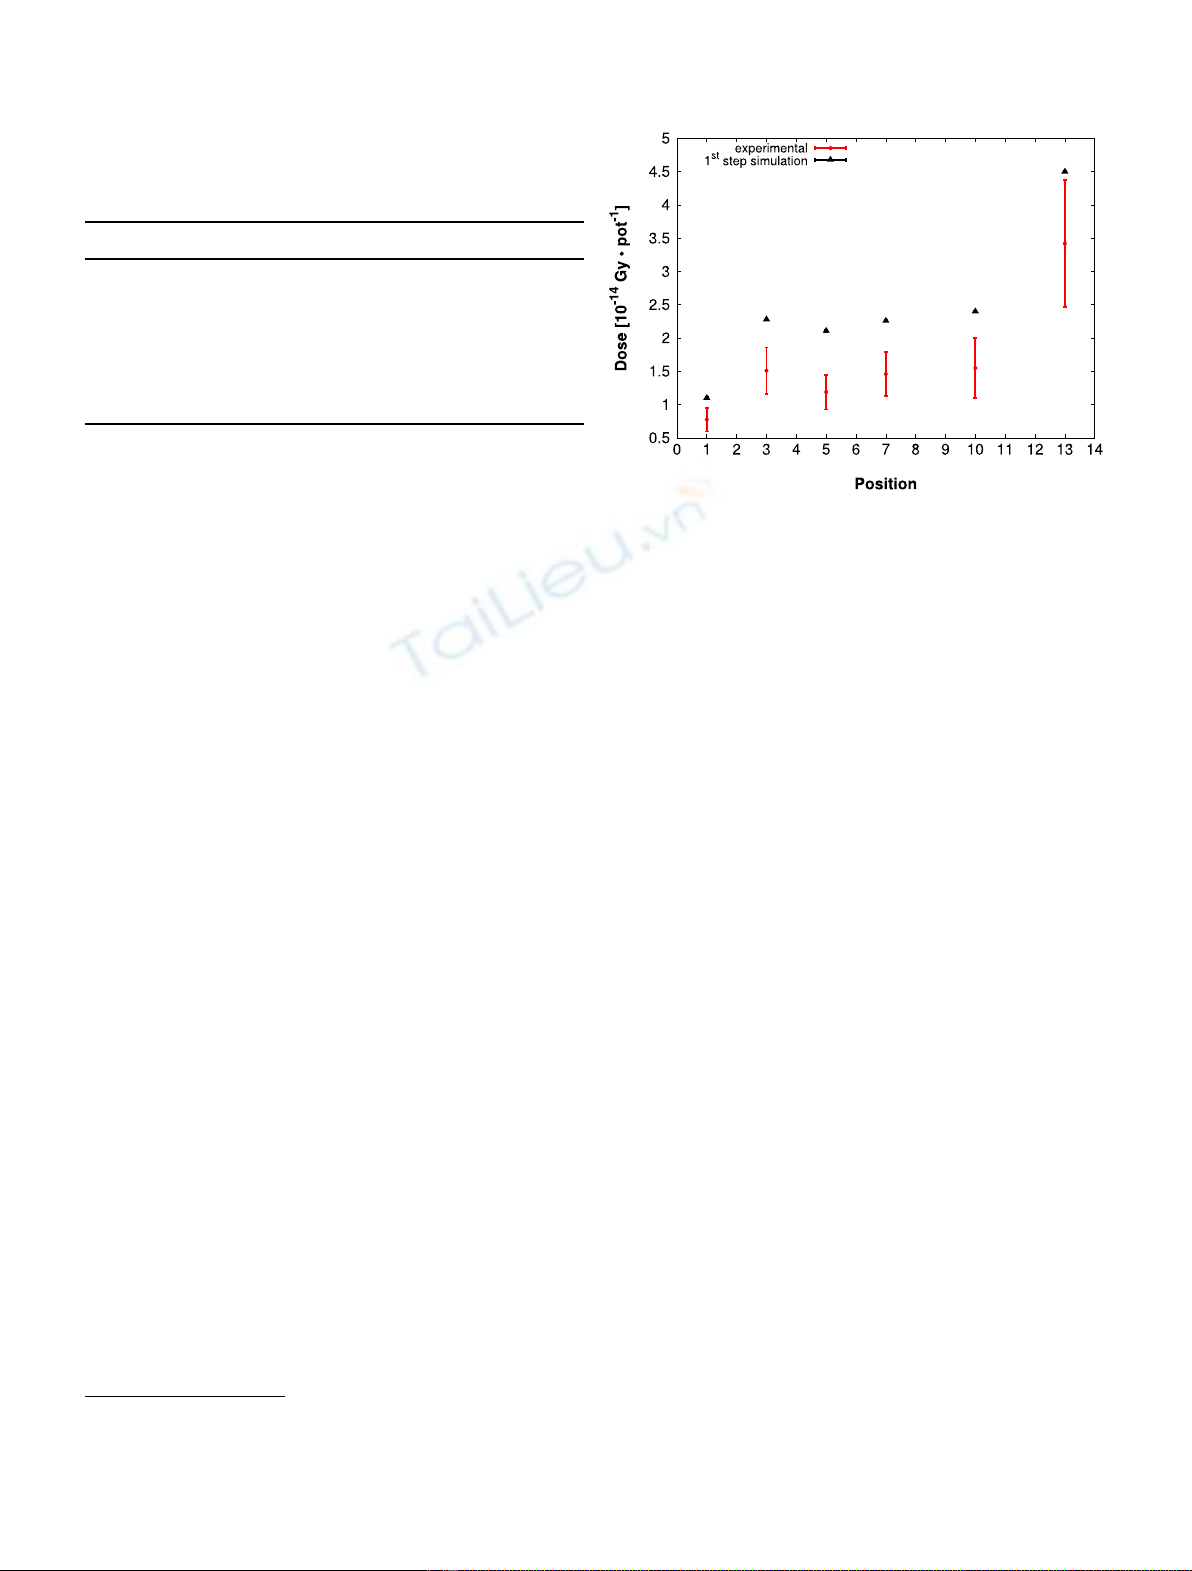
Measurements and FLUKA [7,8] simulations of the
dose response of RadFETs in the mixed-eld at CHARM
had been already performed to understand the radiation
eld in the test area. However discrepancies in the 2545%
range had been identied between simulated and experi-
mental values. In this paper we want to set up more
accurate simulations to investigate this mismatch.
2 CHARM and its mixed-eld: measurements
vs. FLUKA simulations
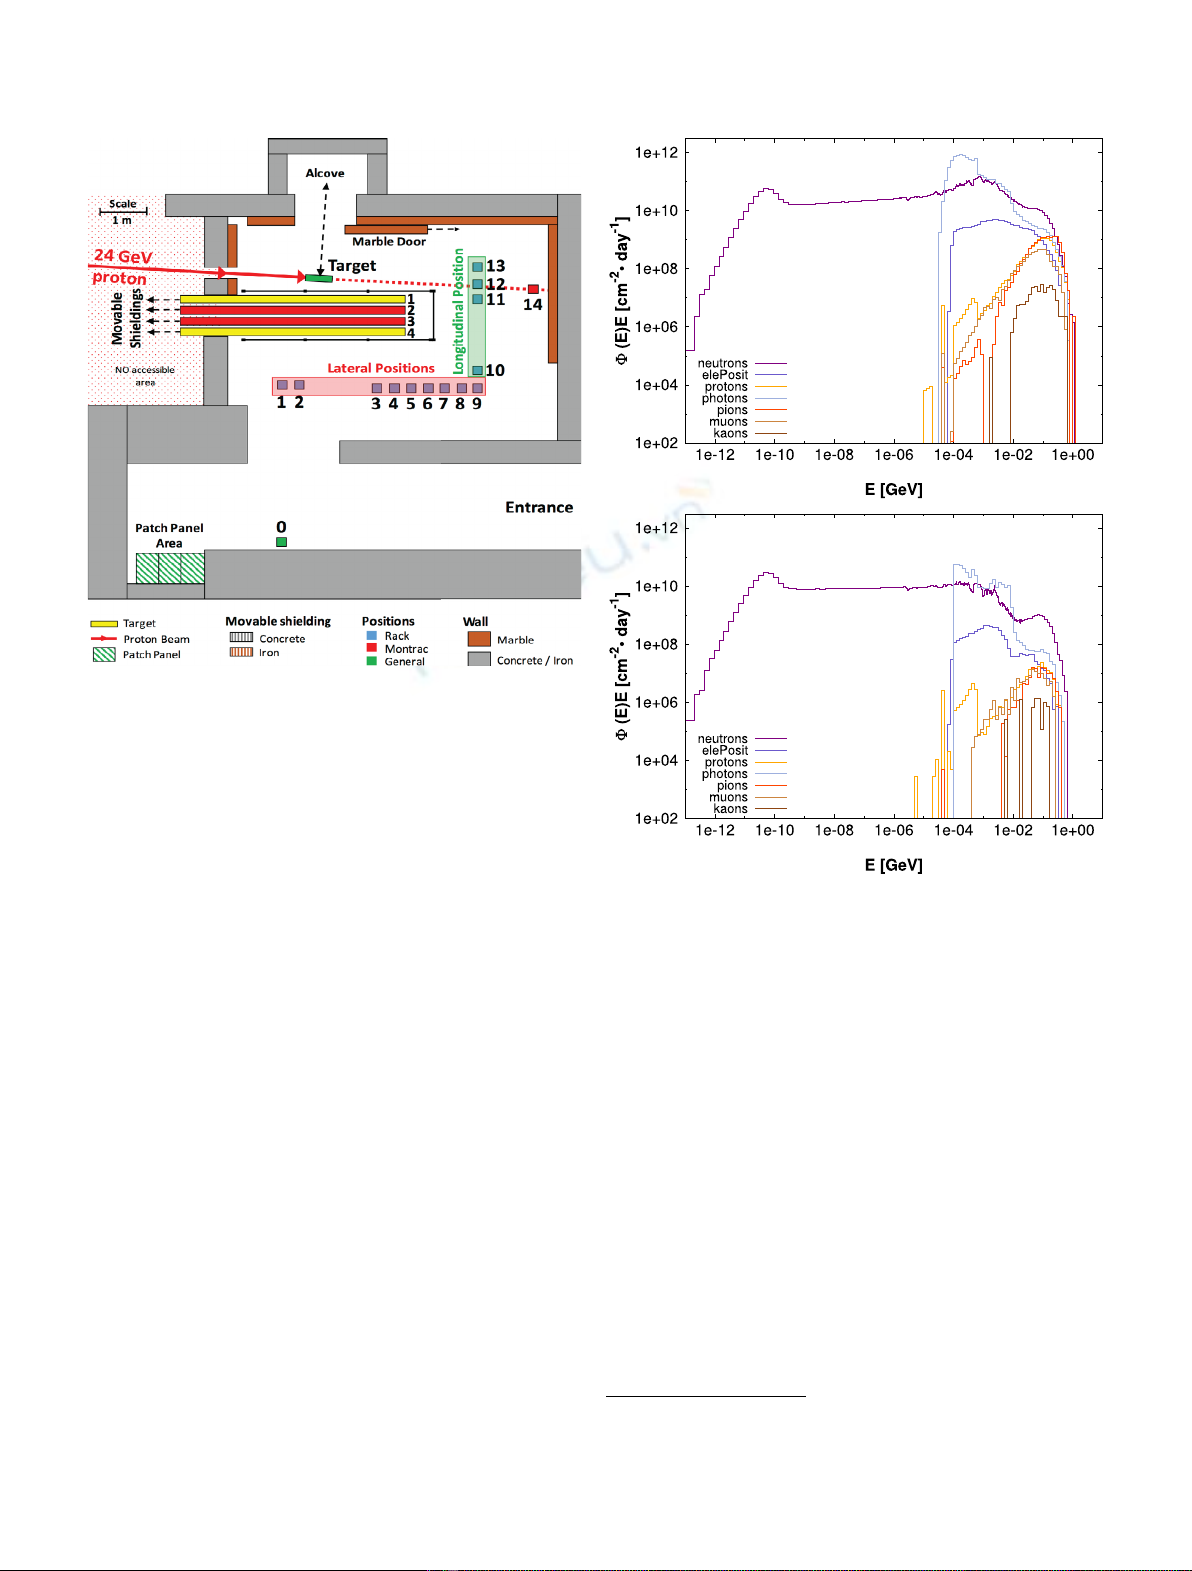
The CHARM test facility is located in the Meyrin site of
CERN, specically in the Proton Synchrotron (PS) East
Area hall. The main source of the radiation eld
reproduced at CHARM is in fact the particle
shower developing from the interaction between the
24 GeV/c proton beam extracted from the PS and a
metallic target [5,6].
2.1 Facility variables
Due to the high energetic particles treated at CHARM,
particular attention is given to the protection of the
personnel. Concrete, marble and iron are used to separate
the irradiation chamber from the technical area. The
irradiation chamber is a 7 73m
3
room, available for
the irradiation tests.
The most relevant variables needed to obtain and tune
the facility's mixed-eld, are:
the 24 GeV/c beam from the PS;
a target placed along the beam direction (Fig. 1). It is
made of copper (cp), aluminum (al) or aluminum with
holes (alh), depending on the desired mixed-eld
intensity and composition;
* e-mail: matteo.marzo@cern.ch
EPJ Nuclear Sci. Technol. 3, 24 (2017)
©M. Marzo et al., published by EDP Sciences, 2017
DOI: 10.1051/epjn/2017016
Nuclear
Sciences
& Technologies
Available online at:
http://www.epj-n.org
This is an Open Access article distributed under the terms of the Creative Commons Attribution License (http://creativecommons.org/licenses/by/4.0),
which permits unrestricted use, distribution, and reproduction in any medium, provided the original work is properly cited.
13 rack test locations in lateral and downstream positions
with respect to the beam direction, 3 5 m far from the
target (Fig. 1);
a shielding between the target and the lateral positions,
created by using 4 movable blocks of concrete (C) and
iron (I) (Fig. 1).
The 24 GeV/c proton beam enters the CHARM facility
and impinges on the target described above. From the
interaction between the two, a shower of particles takes
place. This shower can further interact with the shielding
(if any), possibly generating other secondaries and
consequently producing (or stopping) other particles: this
is the way we create and tune the mixed-eld at CHARM.
In particular, in this paper, two target-shielding layouts
are examined: copper target and no shielding (movable
plates in OFF position), namely cp_0000, and copper
target and concreteironironconcrete shielding, i.e.
cp_CIIC. Other mixed-elds can be produced using
different shielding congurations and target materials.
FLUKA Monte Carlo simulations have already been
performed to characterize the different radiation elds: the
knowledge of the eld at any rack test locations in terms of
particles spectra is the rst, preliminary step to run the
dedicated simulations on the RadFET (rst simulation
step).
2.2 FLUKA simulations settings to calculate the
mixed-eld at CHARM
A FLUKA model of CHARM was built in the recent past to
simulate the radiation eld inside the test facility and
retrieve all the most relevant quantities for radiation to
electronics testing.
The NEWDEFA
1
FLUKA default was used as a rst
approximation to reduce the computational time, given the
large geometry model of the facility: the higher the
thresholds for production and transport of particles, the
lower the computational time.
For the same reasons, a 20 cm side air cube was chosen
as sensitive volume: to score the physical quantities of
interest (dose, energy, uences, etc.). Scoring, for instance,
dose inside a the gate oxide (GO) of the RadFET whose
characteristic dimensions are several order of magnitude
lower than the CHARM's size , would have led to a
disproportional increase of the CPU time (a larger amount
of primaries to get the same statistics).
An example of the characterization of the mixed-eld
at CHARM in terms of simulated particle energy spectra
(lethargy), for the cp_0000 and cp_CIIC congurations is
presented for the position 1 in Figure 2. It is clear how
the eld is populated by secondary electrons, positrons,
muons (m±), photons, neutrons and charged hadrons
(protons, kaons (k±) and pions (p±)). Those spectra have
Fig. 1. CHARM test facility model, top view.
Fig. 2. Mixed-eld: simulated spectra (lethargy), position 1,
cp_0000 and cp_CIIC congurations.
1
Characterized by particles transport thresholds at 10 MeV,
except for neutrons at 10
5
eV and delta ray production with
threshold at 1 MeV.
2 M. Marzo et al.: EPJ Nuclear Sci. Technol. 3, 24 (2017)
been obtained from FLUKA, making the 24 GeV/c proton
beam interact with a copper target and simulating the
entire CHARM geometry, reproducing the two different
shielding layouts.
From Figure 2 it is clear, for instance, that the lethargy
2
is overall lower for all the particles of the mixed eld in the
cp_CIIC conguration. The CIIC walls are stopping a
certain amount of particles of the shower, preventing them
from reaching the rack position 1.
2.3 Experimental measurements and simulated dose:
benchmark
Dose at CHARM is experimentally detected by an
integrated dosimetry system, called RadMon (Radiation
Monitoring system) [9,10]. The RadMon executes an
electronic readout of the threshold voltage of the
RadFETs and sends the voltage value to the CERN
database. The conversion from voltage (V
gs
)todose(Gy)
is post-processed by means of a calibration curve,
obtained for each RadFET batch in a Co60 source. The
experimental results presented in this paragraph refer to
the data measured during 2015 run period of CHARM, for
the copper target and no shielding conguration,
measured by 100 nm p-channel RadFET mounted on
RadMon. The experimental doses in Table 1 are averages
of the calibration factors retrieved during different runs of
2015 plus minus total associated errors, which take into
account primary proton beam intensity error, RadFET
error and standard deviation with respect to the average
value [6].
It is worth noticing that the previous FLUKA
simulations results (obtained by scoring the dose in a
cubic volume of air, 20 cm side, placed in the different test
positions, considering the beam-target interaction and the
whole CHARM geometry and setting energy thresholds for
transport and production of secondaries at 1 MeV) in
Table 1 are systematically overestimating the measured
doses of 25% and 43%.
Figure 3 shows a plot of the trend of dose simulated in
different positions in the test area. The errors associated to
the simulated values (as also clear from Tab. 1) are low if
compared to the experimental ones. They take into account
only statistical uncertainties and no systematic errors, like
in the case of measured doses.
3 The RadFET model and the second step
simulations: benchmarks
We want now to investigate the discrepancies between the
performed FLUKA simulations and the measurements
detected by the RadMON (position 1, cp_0000 layout) to
evaluate if it is possible to better simulate the radiation dose
levels at CHARM. If we can improve the simulations
settings, in order to obtain doses that are more realistic and in
line with experimental measurements, we could use our
calculations to predict the radiation eld at each position.
And this can in principle be done for each target-shielding
layout at CHARM, even out of the 14 ordinary predened
positions.
In order to improve the reliability of our MC
simulations and the agreement with respect to the
experimental data, we decide to implement a more realistic
second step simulation acting on:
geometry and materials of the sensitive volume;
energy thresholds for production and transport of
particles;
energy cutoffs for input spectra.
We want to conduct different parametric analyses to nd
out which are the most accurate FLUKA simulation setting.
In the following paragraph, the rst step dose
calculated in correspondence of the position 1, for the
copper target and no shielding conguration (Sects. 2.1 and
2.2), is taken as reference and its value is 1.101 10
14
± 0.8% Gy/pot.
Before going through the details of the parametric
simulations, we need to put in relation the two steps: if the
geometry and the size of the sensitive volume are going to
change, also the overall geometry and scale of the problem
have to change accordingly.
Table 1. Experimental and 1st step simulated doses in
10
14
Gy/pot, in different positions at CHARM, cp_0000
conguration.
Position Exp. dose 1st step dose % diff.
1 0.776 ± 23.0% 1.101 ± 0.8% 30%
3 1.510 ± 23.0% 2.281 ± 0.6% 34%
5 1.190 ± 22.0% 2.110 ± 0.6% 43%
7 1.460 ± 23.0% 2.260 ± 0.5% 35%
10 1.550 ± 29.0% 2.401 ± 0.5% 35%
13 3.420 ± 28.0% 4.510 ± 0.3% 24%
Fig. 3. Experimental and simulated doses at different test
positions, cp_0000 target-shielding layout.
2
Lethargy is measured in cm
2
day
1
, considering that the
nominal daily value of protons on target (pot) is 1.15 10
15
,
during the runs.
M. Marzo et al.: EPJ Nuclear Sci. Technol. 3, 24 (2017) 3
3.1 Link between the rst and second simulations step
As already specied (Sect. 2.1), the spectra of particles
characterizing the CHARM mixed-eld had already been
retrieved in the rst step simulation (Sect. 2.2). Those
spectra are now available and can be used as input to
perform the second step simulations: the RadFET will be
irradiated by a rectangular beam carrying information
about the mixed-eld in a given position and for a specic
target-shielding layout. The beam has the same surface as
the RadFET crossing section (1 mm
2
). In order to give an
example, if we want to simulate the dose response of the
RadFET, we want to irradiate the actual geometry of the
MOSFET using a beam that is carrying with itself the
spectra of protons, electrons, positrons, muons, etc.,
calculated in the rst step simulation, in desired position
and target-shielding conguration.
The approximation of the radiation eld at CHARM as
a mono-directional beam is realistic as the real mixed-eld
is in good approximation radial. The particle shower
originating from the target (and possibly interacting with
the shielding, if present) reaches all the rack test positions
moving almost along radial directions.
3.2 The RadFET geometry and materials: their role
in the second step
As shown in Figure 4, where the yz (zis assumed to be the
beam direction) and the xy views are shown, the RadFET is
mainly composed of a 250 mm kovar lid, a vacuum region of
250 mm and a 500 mm Silicon substrate; the crossing plane
(xy) surface is 1 1mm
2
. A 1.4 mm Silicon die is then
located on the Silicon substrate: the SiO
2
gate oxides we are
interested to study are deposited on this thin layer (Fig. 4).
The dioxides, 4 in total in our RadFET (named ox1, ox2,
ox3, ox4), can be 100 or 400 nm thick and both the
congurations are studied in this paper. For our simu-
lations we took into account just the ox1 Gate Oxide,
having dimensions 300 mm50 mm400 nm (or 100 nm),
centered in x= 0.000 cm and y=0.0135 cm, with respect
to the RadFET center.
The second step approach has been then validated by
reproducing the rst step conguration (air cube of 20 cm
side) for position 1 in copper target and shielding OFF
conguration. We got a deposited dose in the air rack of
1.101 10
14
± 0.7% Gy/pot. This is in perfect agreement
with the dose calculated in the 1st step, obtained from a
more realistic and complex geometry model of the entire
test facility, with a more realistic mixed-eld. We are
therefore condent that the approximation we introduced
to reduce the CPU time, given the microscopic dimensions
of our sensitive volume (mixed-eld given through a
directional beam), is good enough to faithfully reproduce
the 1st step.
After this validation of the model, we decide to
calculate dose in the 6 10
6
mm
3
gate oxide (SiO
2
)of
the RadFET, in kovar lid conguration, using the same
energy thresholds as before. The simulated dose in this case
is 0.895 10
14
± 2.5% Gy/pot, showing a reduction of
19%, if compared to the dose in the air volume.
As clear in Table 2, the deposited dose shows a further
decrease if we use the PRECISIO physics settings plus
1 keV energy thresholds: in this case the dose is 0.757
10
14
± 2.0% Gy/pot, 15% lower than the one obtained
with the NEWDEFA settings and thresholds at 1 MeV
and 31% smaller than what was calculated on the air
volume, using the same settings as in the 1st step
simulation.
This evidently indicates that if we set a more accurate
simulation in terms of geometry, materials and energy
thresholds, the deposited dose shows a signicant decrease
with respect to that obtained in the 1st step simulation.
Fig. 4. RadFET geometry and materials: FLUKA model.
Table 2. Dose in 10
14
Gy/pot deposited within the air
rack and the RadFET gate oxide in SiO
2
, using 1 MeV
(with NEDEFA defaults) and 1 keV (using PRECISIO
defaults) energy thresholds.
Scoring vol. 1 MeV th. 1 keV th. % diff.
Air cube 1.101 ± 0.7% 0.840 ± 0.5% 24%
RadFET 0.895 ± 2.5% 0.757 ± 2.0% 15%
4 M. Marzo et al.: EPJ Nuclear Sci. Technol. 3, 24 (2017)
3.3 Update of the energy thresholds
As already discussed, the use of the NEWDEFA default in
the rst step simulation was crucial to reduce the CPU
time, given the large geometry of the CHARM test facility.
On the other hand, considering that the range of secondary
electrons in air is 376 cm [11] and that the characteristic
dimension of the air scoring volume we are using is 20 cm,
lowering thresholds represents an improvement of the
accuracy of our simulations (rst row in Tab. 2). It is
important to point out, in fact, that in the case of 1 MeV
thresholds, we are clearly overestimating the energy
deposited, introducing an artifact: all the particles having
energies lower than 1 MeV are treated by the FLUKA
Monte Carlo algorithm as depositing their energy on spot,
without producing other particles and being transported.
Following the previous considerations, the second step
simulations can be then mostly conducted using the
PRECISIO default, mainly characterized by particles
transport thresholds set at 100 keV (except for neutrons,
10
5
eV) and delta ray production threshold at 100 keV. In
addition, by using the EMF-CUT and DELTARAY cards,
thresholds for transport and production of secondary
electrons, positrons and photons and delta ray generated
by muons and charged hadrons will be set at 1 MeV,
100 keV, 10 keV and 1 keV. The PART-THR card is
instead employed to lower energy transport cut-offs for
protons, pions, muons, kaons and aparticles to 1 keV.
Given the 15% difference in the dose deposited in the
RadFET gate oxide, going from 1 MeV to 1 keV (last row in
Tab. 2), it is worth investigating now in which thresholds
energy range this main change occurs. The results of this
parametric analysis can be found in Table 3.
The main change in dose occurs between 1 MeV and
100 keV, showing a decrease of 14%. Going down to 10 keV
and 1 keV does not considerably change the scenario, and
the differences are in the range of the statistical
uncertainties. This behavior can be explained considering
the range of electrons in SiO
2
: 1 MeV electrons have a range
of 1.96 mm, 100 keV electrons have a range of 66.15 mm,
while 10 keV electrons have a range of 1.23 mm. By
comparing these ranges of secondary electrons with the
characteristic lateral dimensions of the gate oxide of the
RadFET (300 mm50 mm), it is evident that thresholds
lower than 100 keV are the most appropriate to simulate
and faithfully reproduce the energy deposition in the gate
oxide of the RadFET.
In this specic case, since the beam surface has the same
size as the crossing surface of the RadFET and the ox1
sensitive volume is completely irradiated by the beam
itself, we have a good statistics using a reasonable number
of primaries: we decide to lower the thresholds down to
1 keV to have most precise simulated doses, without losing
big amounts of CPU time.
3.4 Input spectra cutoffs and oxides thickness
After evaluating the dose dependency on materials, scoring
volume sizes and energy thresholds, we decide now to study
what is the impact of the oxide thickness and how input
spectra cutoffs could affect the nal dose.
We simulate RadFET having 100 nm and 400 nm thick
gate oxides. We reproduce, on the other hand, input
spectra characterizing the mixed-eld, through a dedicated
and independent rst step simulation, by cutting them at
1 MeV and 100 keV, to see how lower energy particles of the
spectra could affect the nal deposited dose. Going down to
energies lower than 100 keV is counterproductive: the
lower the thresholds, the lower the ranges and that
particles can be stopped by the kovar lid of the RadFET.
From Table 4, the oxide thickness does not have a large
impact on the simulated deposited dose. On the other hand,
using spectra cut at 1 MeV or 100 keV makes a difference
that is of the order of 10%.
4 Second step simulations: the cp_0000
target-shielding conguration
The analyses conducted in Section 3 led us to identify the
following simulation settings as the most suitable for our
second step simulations:
400 nm thick oxide;
PRECISIO default in FLUKA;
energy thresholds at 1 keV;
input spectra cutoffs at 100 keV.
This is the starting point to test the second step algorithm
on other relevant positions inside the test area, concerning
the cp_0000 target-shielding conguration.
4.1 Doses simulated and measured in different
positions at CHARM
We set the RadFET to positions 3, 5, 7, 10 and 13, by using
as input the spectra of the 1st step simulations, calculated
for the new locations of interest, as described in Section 2.2.
Table 3. Parametric analysis changing the energy thresh-
olds of the simulations (PRECISIO defaults): dose in the
SiO
2
GO of the RadFET, in 10
14
Gy/pot.
Energy threshold Dose
1 MeV 0.895 ± 2.5%
100 keV 0.768 ± 1.5%
10 keV 0.787 ± 1.7%
1 keV 0.757 ± 2.0%
Table 4. Effect of gate oxide thickness and input spectra
thresholds on the RadFET dose response: simulated dose in
10
14
Gy/pot (PRECISIO defaults set).
Thickness 1 MeV input 100 keV input % diff.
400 nm 0.757 ± 2.0% 0.820 ± 4.3% 8%
100 nm 0.719 ± 3.8% 0.816 ± 2.4% 12%
M. Marzo et al.: EPJ Nuclear Sci. Technol. 3, 24 (2017) 5