
REGULAR ARTICLE
Thermal-hydraulics/thermal-mechanics temporal coupling
for unprotected loss of flow accidents simulations on a SFR
Cyril Patricot
1*
, Grzegorz Kepisty
1
, Karim Ammar
1
, Guillaume Campioni
1
, and Edouard Hourcade
2
1
CEA, DEN, DM2S, SERMA, 91191 Gif-sur-Yvette, France
2
CEA, DEN, DER, CPA, 13108 Saint-Paul-Lez-Durance Cedex, France
Received: 12 May 2015 / Accepted: 25 November 2015
Published online: 11 January 2016
Abstract. In the frame of ASTRID designing, unprotected loss of flow (ULOF) accidents are considered. As the
reactor is not scrammed, power evolution is driven by neutronic feedbacks, among which Doppler effect, linked to
fuel temperature, is prominent. Fuel temperature is calculated using thermal properties of fuel pins (we will focus
on heat transfer coefficient between fuel pellet and cladding, H
gap
, and on fuel thermal conductivity, l
fuel
) which
vary with irradiation conditions (neutronic flux, mass flow and history for instance) and during transient (mainly
because of dilatation of materials with temperature). In this paper, we propose an analysis of the impact of spatial
variation and temporal evolution of thermal properties of fuel pins on a CFV-like core behavior during an ULOF
accident. These effects are usually neglected under some a priori conservative assumptions. The vocation of our
work is not to provide a best-estimate calculation of ULOF transient, but to discuss some of its physical aspects.
To achieve this goal, we used TETAR, a thermal-hydraulics system code developed by our team to calculate
ULOF transients, GERMINAL V1.5, a CEA code dedicated to SFR pin thermal-mechanics calculations and
APOLLO3
®
, a neutronic code in development at CEA.
1 Introduction
The CFV (Cœur Faible Vidange, low void coefficient core)
concept [1], which includes several innovations, is viewed as
a way to improve the sodium void effect (reactivity effect of
a core voiding) and the accidental behavior of large sodium
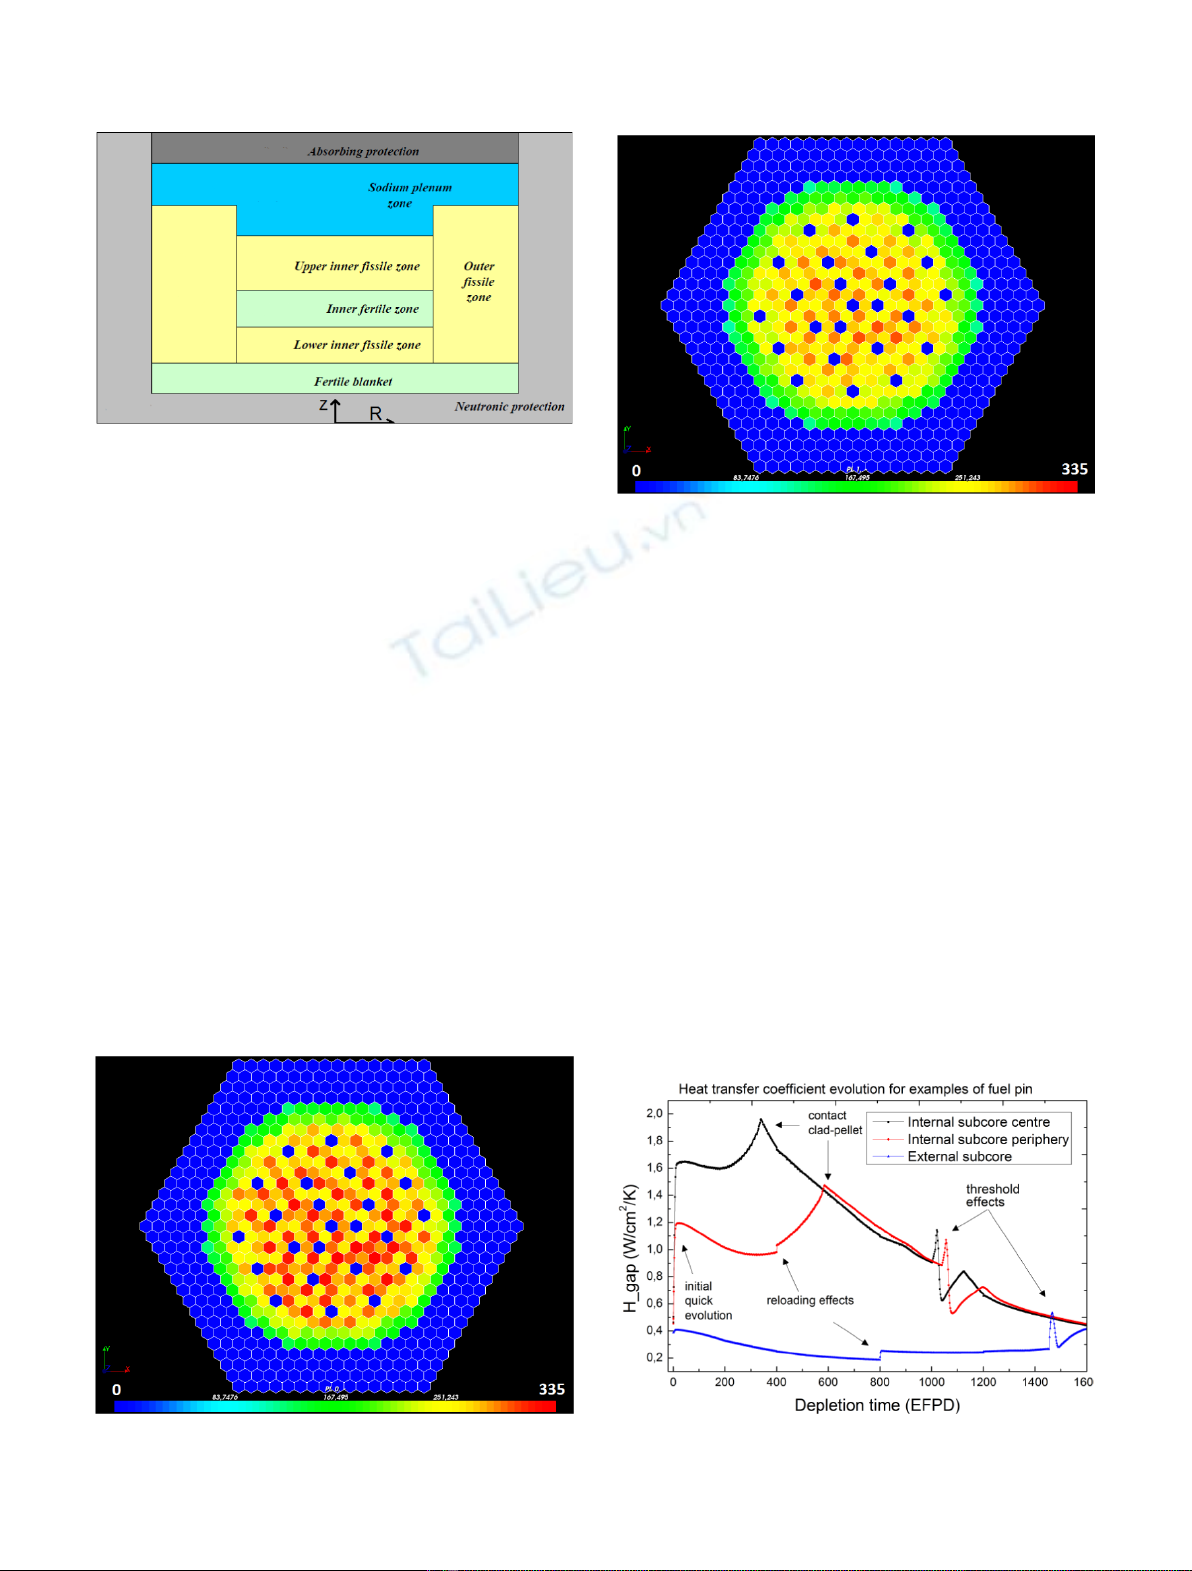
fast reactors (SFRs). A scheme of this kind of core is given in
Figure 1. A sodium plenum, with an upper absorbing
protection, is positioned just above the core in order to
increase the neutrons leakage in case of voiding. This effect
is enhanced by the heterogeneities of the inner core, and by
the height difference between the outer core and the inner
core. These particularities increase the flux at the top of the
core, and therefore in the plenum.
Loss of flow accidents are especially difficult for large
SFRs and are therefore studied in depth in the frame of their
designing. A detailed analysis of these accidents can be found
in reference [2]. In order to clarify the explanations, our paper
focuses on the unprotected loss of flow accident, during which
primary pumps are lost, but not the secondary ones (we will
call it ULOF/PP). The reactor is not scrammed, and the
power evolution is driven by the neutronic feedbacks
(Doppler, sodium dilatation and dilatations of structures).
During the accident, the coolant mass flow decreases until it
reaches the natural convection equilibrium. It results in
sodium heating in the upper part of the core, making the
power decrease, thanks to CFV design. As a consequence,
fuel temperature decreases and the Doppler effect is positive.
Thus, the stabilization effect of the Doppler is, in this case, an
obstacle to the power decrease.
An accurate evaluation of fuel temperature evolution
during the transient is therefore necessary. It is usually
derived from diffusion equation with given thermal proper-
ties. These properties are often homogenized over core zones
and are usually constant in time. However, in reality, their
spatial variations (mainly due to the heterogeneity of the
core and to the mixing of sub-assemblies of different ages)
and temporal evolutions (mainly due to differential thermal
dilatations) can be quite important.
In this work, we propose an analysis of the impact of
spatial variation and temporal evolution of thermal
properties of fuel pins on a CFV-like core behavior during
an ULOF/PP accident. Section 2 presents the evolution of
the core under irradiation, calculated with APOLLO3
®
[3]
and GERMINAL V1.5 [4]. In Section 3, ULOF/PP
accidents are calculated with TETAR (developed in the
frame of TRIAD [5]) and different spatial descriptions of
* e-mail: cyril.patricot@cea.fr
EPJ Nuclear Sci. Technol. 2, 2 (2016)
©C. Patricot et al., published by EDP Sciences, 2016
DOI: 10.1051/epjn/e2015-50036-x
Nuclear
Sciences
& Technologies
Available online at:
http://www.epj-n.org
This is an Open Access article distributed under the terms of the Creative Commons Attribution License (http://creativecommons.org/licenses/by/4.0),
which permits unrestricted use, distribution, and reproduction in any medium, provided the original work is properly cited.
thermal properties. In Section 4, we show the results of the
temporal coupling. Section 5 provides some general
conclusions.
Note that TETAR is not ASTRID reference tool and
that the CFV-like core used is an academic model. As a
consequence, the numerical results of this paper should not
be considered as reference ones. They are given for the
physical analysis of the phenomena.
2 Core evolution under irradiation
2.1 Neutronic evolution
We used APOLLO3
®
for the neutronic calculations with 33
energy groups. Cross-sections were computed by the
module ECCO of ERANOS [6]. Control rods are withdrawn
in every calculation.
The chosen reloading procedure uses four batches. As the
sub-assemblies are not moved during the reloading, the core
is a mixing of sub-assemblies with different burn-up. The
resulting power distribution is quite heterogeneous, as shown
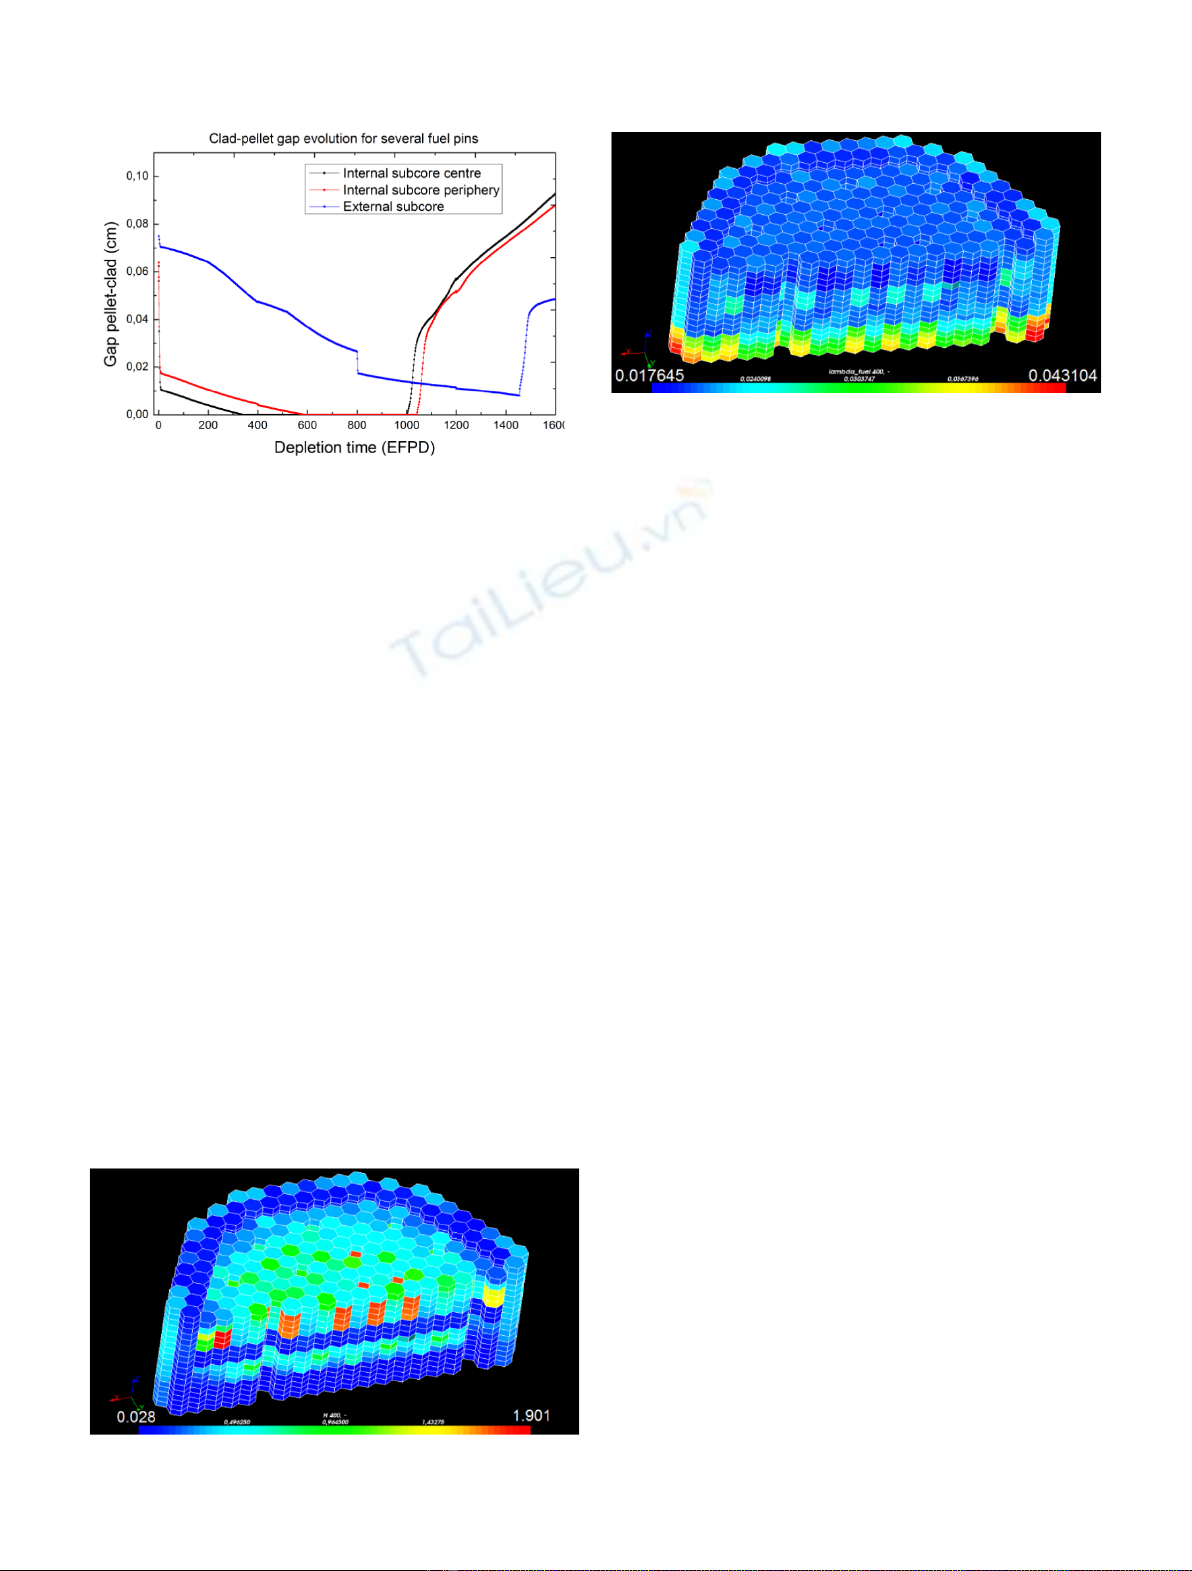
in Figures 2 and 3.InFigure 2, the power distribution is
given, for a cut in the center of the core, at beginning of cycle.
Fresh sub-assemblies have high fissile content and have
therefore a high linear power. At end of cycle, in Figure 3, the
power distribution becomes more homogeneous. The color
ranges are the same for both figures.
The same kind of flux and power redistributions occurs
axially because of the combination of consumption of Pu in
fissile zones and breeding in fertile ones (located at the
bottom of the core).
2.2 Thermo-mechanical evolution
The evolution of thermo-mechanical properties of fuel pins
is evaluated with GERMINAL V1.5. It uses simplify fuel
description model based on mono-group neutron flux, linear
power and irradiation damage distributions calculated by
APOLLO3
®
. It also needs sodium inlet temperature and
mass flow per pin.
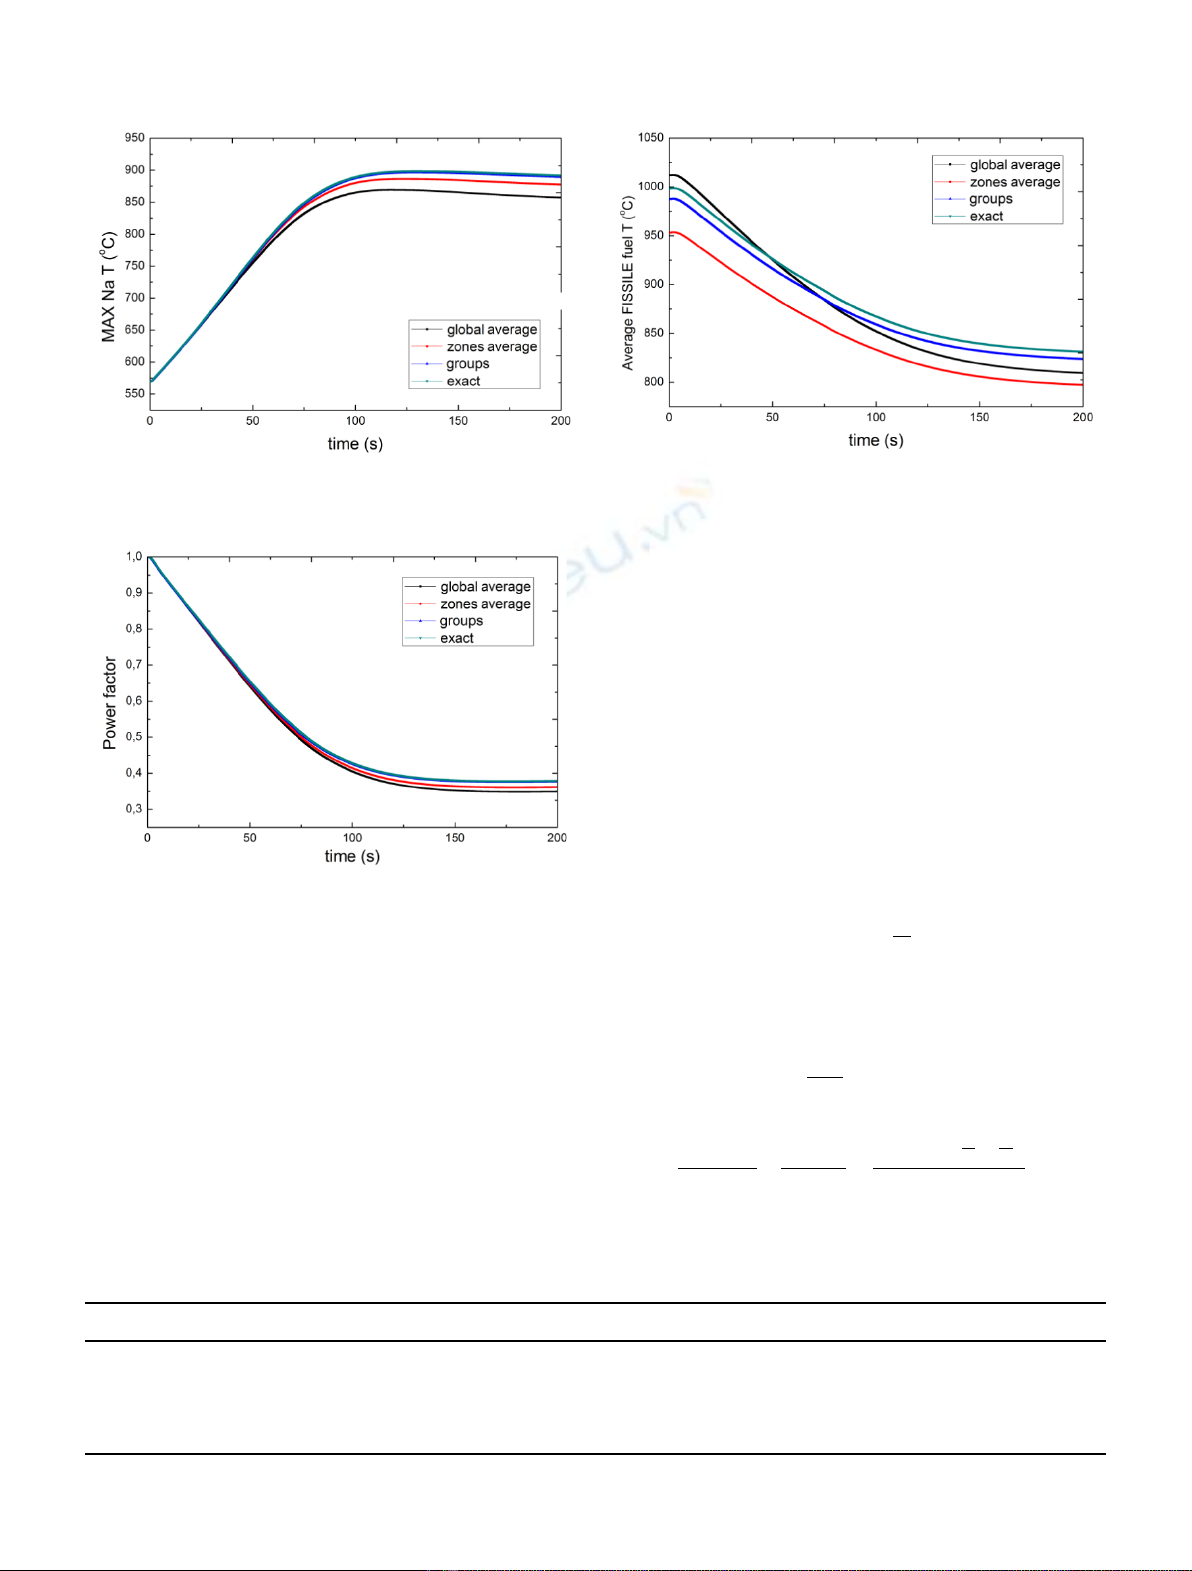
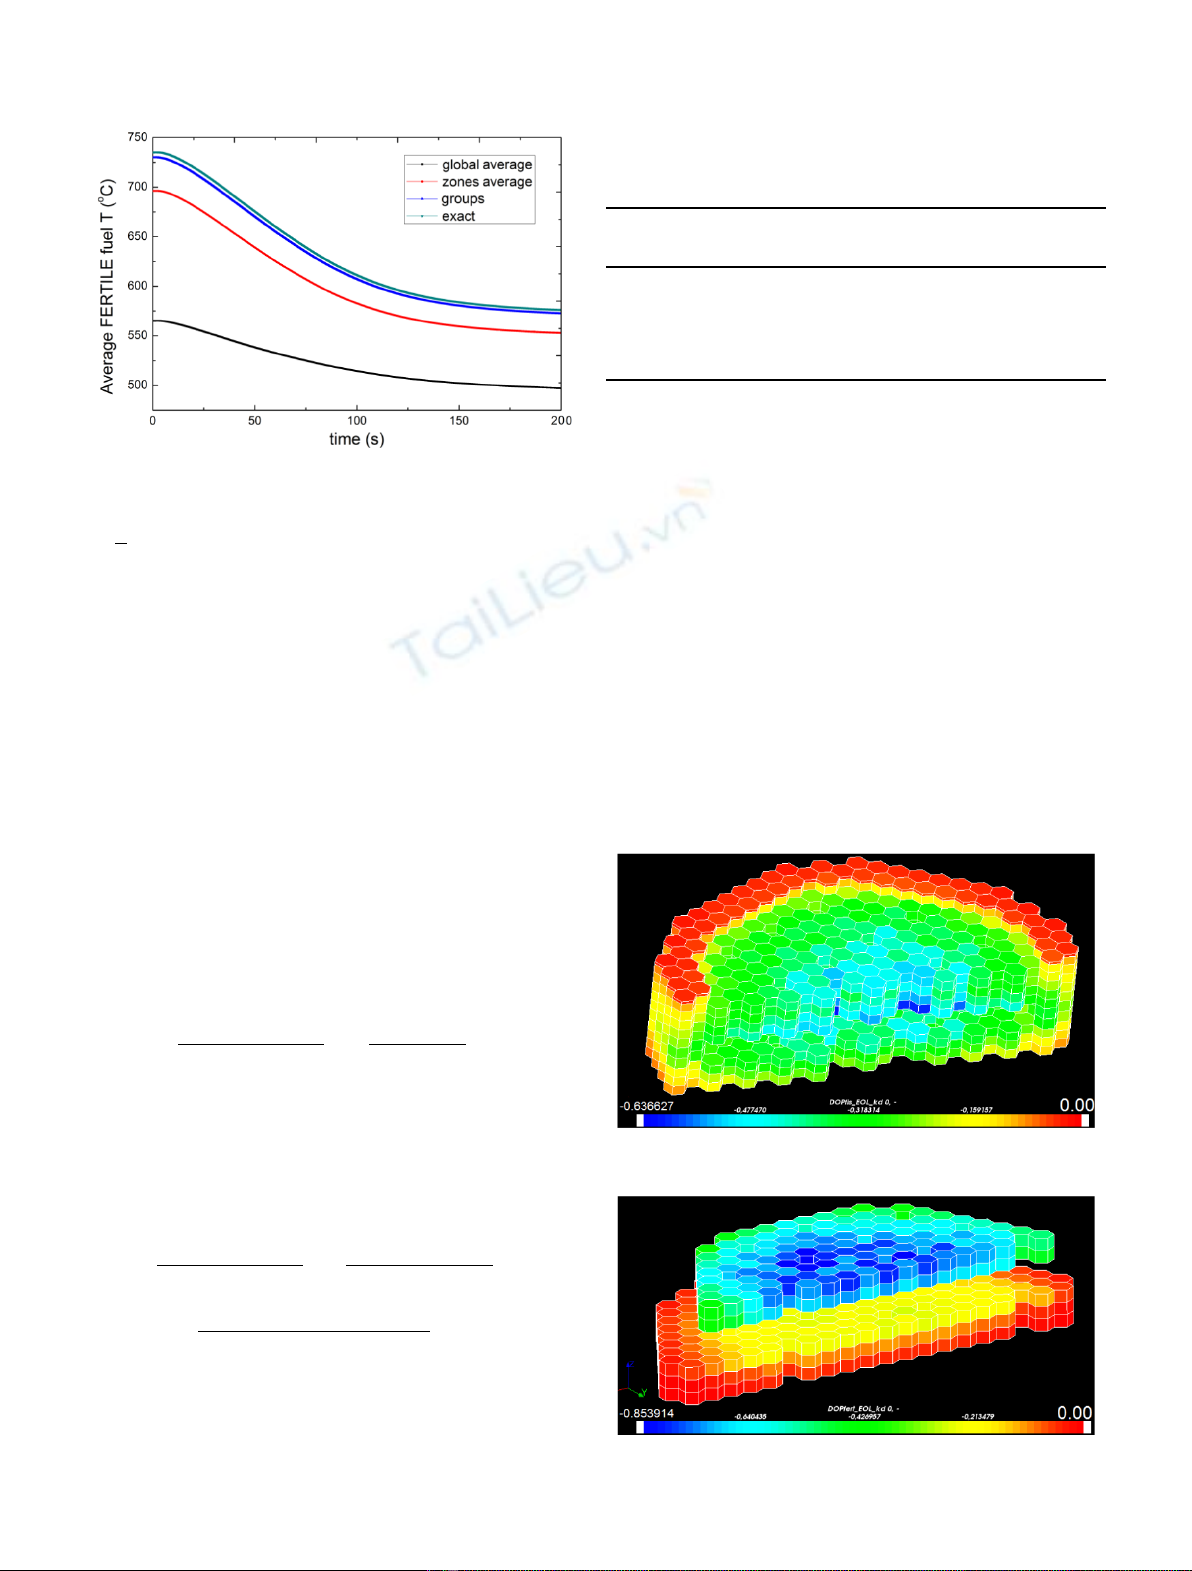
The heat transfer coefficient between fuel pellet and
cladding, called H
gap
, has strong non-linear variations with
irradiation. H
gap
and gap size evolutions are given in
Figures 4 and 5respectively, at a fixed position (in fissile) of
Fig. 1. Scheme of the CFV core concept.
Fig. 2. Linear power distribution (W/cm by pin) in the center
of the core at beginning of cycle.
Fig. 3. Linear power distribution (W/cm by pin) in the center of
the core at end of cycle.
Fig. 4. Typical heat transfer coefficient evolution for chosen
sub-assemblies (in top fissile zone).
2 C. Patricot et al.: EPJ Nuclear Sci. Technol. 2, 2 (2016)
chosen sub-assemblies. One can see that the initial thermal
dilatation of the pellet makes the H
gap
increase, at the very
beginning. A peak is then observed when the pellet comes in
contact with the cladding (it does not occur here for the
external subcore sub-assembly). A quite linear phase
follows, with constant decrease of the H
gap
due to the
degradation of the contact surface. Finally, threshold
effects occur, swelling of the cladding, creation of an oxide
layer on its surface and strong gaseous fission products
release. The discontinuities at 400, 800 and 1200 EFPD
(equivalent full power days) are due to the reloading of a
quarter of the core, which changes the linear power and flux
in the studied sub-assemblies.
This non-linear behavior, together with the positioning
of sub-assemblies in the core, and the axial heterogeneity of
the fuel produce quite heterogeneous 3D maps of H
gap
,as
one can see in Figure 6. To build this 3D map, one mean pin
per sub-assembly has been calculated. A 3D map of thermal
conductivity of fuel (called l
fuel
) is given in Figure 7. The
evolution of this quantity is much more linear: the
irradiation degrades the ceramics and thus its conductivity.
As a consequence, l
fuel
is maximal where the irradiation
damages are minimal.
3 Impact of spatial descriptions of thermal
properties and of neutronic feedbacks
on the ULOF/PP accident
3.1 Calculations comparison with integrated neutronic
feedback coefficients
We used TETAR (Transients Estimation Tool for nA-
cooled Reactors) to calculate the ULOF/PP accident. It
solves 1D thermo-hydraulic equations in each sub-assem-
bly. We emphasize that each sub-assembly is calculated
separately by a dedicated 1D thermo-hydraulic channel in
all calculations presented in this paper. This ability of
TETAR allowed us to perform our studies on spatial
descriptions impacts. Mass flow in each sub-assembly is
calculated to create a given pressure drop. Pin temperature
is calculated through 1D diffusion. Point kinetic, fed with
feedback coefficients (integrated or local) from APOL-
LO3
®
, is used for the power estimation. The system is closed
with sodium collectors and sodium-sodium heat exchangers
simple models. The accident is driven by a given decrease of
the pumps pressure. The overall pressure drop due to
gravity (this term leads to natural convection) is calculated
precisely.
In this section, the thermal properties are constant
during the transient. Four models were used to estimate
their initial value:
–Exact: one mean pin per sub-assembly is calculated by
GERMINAL V1.5, and the results feed directly the
TETAR calculation;
–Global average: we calculate, from the exact core
calculation, the mean H
gap
and l
fuel
of the core and use
them everywhere in the TETAR calculation;
–Zones average: we calculate, from the exact core
calculation, the mean H
gap
and l
fuel
of the core main
five zones (Fig. 1). They are used in the corresponding
meshes in TETAR;
–Groups: we gather sub-assemblies in groups and calculate
one mean pin per group (sub-assemblies of the same ring,
from the same batch). In comparison with the exact
model, the number of GERMINAL V1.5 calculations is
reduced by almost a factor 10.
Sodium maximal temperature and power evolutions
during the ULOF/PP accident are given in Figures 8 and 9
Fig. 5. Typical gap size evolution for chosen sub-assemblies
(in top fissile zone).
Fig. 6. Typical 3D map of H
gap
(W/cm
2
/K).
Fig. 7. Typical 3D map of l
fuel
(W/cm/K).
C. Patricot et al.: EPJ Nuclear Sci. Technol. 2, 2 (2016) 3
for the models above. One can see that the exact and the
group models are indistinguishable and that the maximal
temperature they reached is slightly above the zone average
model, which is slightly above the global average model.
Sodium maximal temperatures for some other models
are given in Table 1. One can see that the zones average
model is enough for l
fuel
, its results are very close to those of
the exact model. In addition, non-linearities seem to be
weak; the effect of a combination of models is the sum of the
effects of the models. Finally, the difference between the
groups and the exact models is very small in all cases, about
3°C.
3.2 Interpretation of the results with integrated
neutronic feedback coefficients
All the presented calculations used two integrated Doppler
coefficients, one for the fertile zones, and one for the fissile
zones. The power is therefore affected by the average fissile
and fertile temperatures. One can see their evolution in
Figures 10 and 11, for the calculations of the second column
of Table 1 (l
fuel
model is always global average). Except for
the global average model which mixes fertile and fissile
meshes, one can see that every H
gap
averaging leads to a
cooler fuel.
This observation can be explained. Let us consider two
fuel meshes, iand j, in contact with the cladding. Because of
the linearity of the diffusion equation, the temperature of i
can be written as:
Ti¼TCl
iþai
hi
;ð1Þ
with TCl
ithe temperature of the cladding, h
i
the H
gap
coefficient and a
i
a scalar depending on local power. The
same equation can be written for mesh j. We introduce now
the temperatures Tm
iand Tm
jobtained using average H
gap
value, that is to say hiþhj
2. The difference between the
average values with exact and average H
gap
is equal to:
Tm
iþTm
j
2TiþTj
2¼
hihj
ai
hiaj
hj
2hiþhj
:ð2Þ
Fig. 8. Sodium maximal temperature during ULOF/PP accident
for different thermal properties models.
Fig. 9. Power during ULOF/PP accident for different thermal
properties models.
Table 1. Comparison of sodium maximal temperature (°C) during ULOF/PP accident for different thermal properties
models.
Model H
gap
(l
fuel
: global average) l
fuel
(H
gap
: global average) H
gap
and l
fuel
Global average 869.2 869.2 869.2
Zones average 877.4 877.8 886.4
Groups 887.2 878.3 896.1
Exact 889.9 878.6 898.9
Fig. 10. Average fissile temperature during ULOF/PP for
different H
gap
treatments.
4 C. Patricot et al.: EPJ Nuclear Sci. Technol. 2, 2 (2016)
ai
hiis the temperature increase between fuel and cladding.
This equation means therefore that using average H
gap
reduces average fuel temperature if the H
gap
of the hottest
mesh is smaller than the one of the coolest mesh. The point
is that it may be the reason why the hottest mesh is the
hottest. Therefore, without strong positive correlation
between power and H
gap
, using average H
gap
usually reduces
fuel temperature.
In addition, we can prove that, starting with a cooler
fuel, for the same power decrease, the Doppler effect is
smaller. To show that, let us write the temperature of a
given mesh in the situation ilike:
Ti¼TCl þaiP;ð3Þ
with T
Cl
the temperature of the cladding, Pthe local power
and a
i
a scalar depending on mesh state. The same equation
can be written for the same mesh in the situation jby
replacing a
i
by a
j
.
Now we consider that the power becomes, at time t,P.f
with fa given factor (f<1 in the case of a ULOF). The mesh
contribution to the Doppler effect is:
TitðÞTit¼0ðÞ
TitðÞ C¼aiPf1ðÞ
TCl þaiPf C;ð4Þ
with Ca given feedback coefficient (usually C<0). Thanks
to the form chosen for equation (4) (this is the usual one),
the coefficient Chas no dependence on temperature. We
assume here that the cladding temperature is constant. The
difference between the Doppler contributions of the mesh in
both situations is:
TitðÞTit¼0ðÞ
TitðÞ CTjtðÞTjt¼0ðÞ
TjtðÞ C
¼TClPf1ðÞaiaj
C
TCl þaiPf
TCl þajPf
:ð5Þ
This quantity is positive if C<0, f<1 and a
i
>a
j
.In
other words, if the Doppler effect is negative and if the
power decreases, we show that the Doppler effect is smaller
for an initially cooler mesh. As a consequence, the power
decreases a little bit more. These results explain the impact
of spatial description of thermal properties of fuel pins we
observed in Section 3.1.
3.3 Impact of local neutronic feedback coefficients
The previous analysis is based on the use of average fuel
temperatures to calculate the Doppler feedback. One could
wonder if it still stands if we use local neutronic feedbacks.
Because this work is on the impact of the fuel pin thermo-
mechanics on ULOF/PP accident, we focused our study on
the Doppler effect. Comparisons of sodium maximal
temperatures reached during ULOF/PP accident with
and without local Doppler coefficients (the global Doppler
effect is the same) are presented in Table 2. 3D maps of
Doppler coefficients, derived from the perturbation theory,
are given in Figure 12 (fissile) and Figure 13 (fertile).
Fig. 11. Average fertile temperature during ULOF/PP for
different H
gap
treatments.
Table 2. Comparisons of sodium maximal temperature
(°C) during ULOF/PP accident with and without local
neutronic feedbacks.
Model H
gap
and l
fuel
(and integrated NF)
H
gap
and l
fuel
(and local NF)
Global average 869.2 878.9
Zones average 886.4 898.0
Groups 896.1 902.4
Exact 898.9 904.3
Fig. 12. 3D map of Doppler coefficients (pcm) in fissile zones.
Fig. 13. 3D map of Doppler coefficients (pcm) in fertile zones.
C. Patricot et al.: EPJ Nuclear Sci. Technol. 2, 2 (2016) 5


![Bài tập trắc nghiệm Kỹ thuật nhiệt [mới nhất]](https://cdn.tailieu.vn/images/document/thumbnail/2025/20250613/laphong0906/135x160/72191768292573.jpg)
![Bài tập Kỹ thuật nhiệt [Tổng hợp]](https://cdn.tailieu.vn/images/document/thumbnail/2025/20250613/laphong0906/135x160/64951768292574.jpg)

![Bài giảng Năng lượng mới và tái tạo cơ sở [Chuẩn SEO]](https://cdn.tailieu.vn/images/document/thumbnail/2024/20240108/elysale10/135x160/16861767857074.jpg)


