University of Arkansas, Fayetteville ScholarWorks@UARK
Economics Undergraduate Honors Theses Economics
5-2018
Gender Diversity around the World: The Role of Country Legal Regulations and Culture Madison E. Newton University of Arkansas, Fayetteville
Follow this and additional works at: http://scholarworks.uark.edu/econuht
Part of the International Business Commons, and the International Economics Commons
This Thesis is brought to you for free and open access by the Economics at ScholarWorks@UARK. It has been accepted for inclusion in Economics Undergraduate Honors Theses by an authorized administrator of ScholarWorks@UARK. For more information, please contact scholar@uark.edu, ccmiddle@uark.edu.
Recommended Citation Newton, Madison E., "Gender Diversity around the World: The Role of Country Legal Regulations and Culture" (2018). Economics Undergraduate Honors Theses. 26. http://scholarworks.uark.edu/econuht/26
Abstract
The goal of this project is to analyze the factors that contribute to the gender discrepancy
in labor force participation rates around the world. This paper will explore potential drivers of
the gender disparity phenomenon through the analyzation of country-specific elements to detect
related impacts that may be imposed on a country’s composition of labor force as it relates to
gender. More specifically, I interpret the degree to which specific factors can directly influence
the proportion of female presence in labor forces around the world. My empirical results suggest
that the societal factors, legal regulations, culture, total fertility rate (births per woman) are all
determinants of female labor force participation rates by country. My results confirm theoretical
and economic theories, as well as findings from existing literature. It is of upmost importance to
study these relationships as they explain much of the labor force participation rates around the
world.
1
1. Introduction
Labor force participation rates have been in a global decline for both men and women - but
this decline has been particularly accentuated for women. (World Economic Forum, 2017)
Women compose one-half of the world’s population and therefore their equal participation in the
labor force, alongside an equal share of men, is fundamental to whether and how economies and
societies survive. Despite recent advances towards lessening the global gender gap, it remains
apparent that women are significantly underrepresented within labor force participation rates on
a global scale. As a result, the full integration of women into the talent pool has become a must.
The list of barriers to female representation in business is analogous to the list of barriers to
female labor force participation rates. If labor force participation rates are high for women, then
more women will be working and should eventually enter corporate boardrooms if there are no
other barriers to female leadership. This suggests that economic and cultural factors may be
important barriers to female career advancement. In turn, we must ensure the healthy
development and appropriate use of half of the world’s total talent pool as it holds a vast bearing
on the growth, competitiveness, and future readiness of economies and businesses worldwide.
This paper will examine various cultural aspects and social norms country-by-country,
further analyzing the extent in which they may explain the variation in global labor force
participation rates for women. The use of culture in finance literature has been well established
overtime. Our study adds to the existing literature by further investigating the international
aspect of this research. The behavioral patterns of women ultimately determine their subsequent
career path decisions, those of which are impacted by various societal factors as well as
upbringing culture. With this, our study fills the gap by using cross-country cultural differences
in explaining the behavior of women in choosing careers. To adequately assess shocks to female
2
labor participation rates on a country-by-country basis, we must analyze the effects of several
fundamental components, including differences within the following areas: cultural dimensions
and subsequent norms, legal restrictions and regulations, demographics, and population
distributions. I also consider additional country factors such as organizational structure,
maternity leave policy, education level and several other world development indicators to
collectively explain the discrepancy in gender representation.
Several general hypotheses explain these differences; however, the research community
still does not completely understand how to combat this problem. Mainly, I hypothesize that
cultural norms and values around the world determine the behavior of women in choosing
varying career paths and their subsequent decision to actively participate in the global labor
force. Finally, I propose my related models as means of improving this disparity and increasing
the female participation in the economy.
2. Literature Review
2.1 Gender Diversity and Economic Efficiency
A growing body of literature points to the relationship between female labor force and
economic growth. The World Bank’s 2012 World Development Report argues that gender
equality matters in its own right, but that it is also “smart economics” because it can enhance
economic efficiency. (World Bank, 2012) The World Economic Forum’s 2014 Global Gender
Gap Report finds a positive correlation between gender equality and per capita GDP, the level of
competitiveness, and human development indicators. (World Economic Forum, 2014)
A variety of models and empirical studies have suggested that improving gender parity may
result in significant economic dividends, which vary depending on the situation of different
3
economies and the specific challenges they are facing. Notable recent estimates suggest that
economic gender parity could add an additional US$250 billion to the GDP of the United
Kingdom, US$1,750 billion to that of the United States, US$550 billion to Japan’s, US$320
billion to France’s and US$310 billion to the GDP of Germany. Other recent estimates suggest
that China could see a US$2.5 trillion GDP increase from gender parity and that the world as a
whole could increase global GDP by US$5.3 trillion by 2025 by closing the gender gap in
economic participation by 25% over the same period. (World Economic Forum, 2017)
Gender-diversity may hold positive impacts within a board’s level of efficiency and its
associated firm performance. However, results in existing literature are not conclusive. In Spain,
gender-diversity has a positive effect on firm value and the opposite causal relation is
insignificant. (Campbell & Mínguez-Vera) Studies using data at one or two points in time find
that gender diversity in boards is associated with higher stock values and greater profitability.
However, studies using panel data over a number of years, which explore the effects of adding
women to boards, generally show no effects or negative effects. This suggests that the
association between board diversity and performance in cross-sectional studies is simply
explained as a consequence of the fact that successful firms appoint women to their boards.
(Dobbin & Jung, 2011) However, on the positive side, one study (Smith, Smith, & Verner, 2004)
showed that the proportion of women in top management jobs tends to have positive effects
on firm performance, even after controlling for numerous characteristics of the firm and
direction of causality. The results also showed that the positive effects of women in top
management strongly depend on the qualifications of female top managers. Despite a
significant number of studies conducted on various aspects of board diversity as they relate to
board effectiveness, the debate on conclusive effects is still ongoing. Scholars have assumed that
4
if board diversity affects corporate performance, it is through its influence on group processes in
the board room. (Dobbin & Jung, 2011)
2.2 The Role of Culture
Culture plays a significant role in the evolution of women’s careers. For example, if family
values are strong then it may be difficult for women to accept more demanding positions.
Women may also be passed over for promotion because of the perception that women are not
natural leaders. A growing literature argues that culture has an important role to play in
explaining female work outcomes. (Olivetti & Goldin, 2013) argued that female labor force
participation increased substantially after World War II because it led to changes in attitudes
towards working women (Fernández & Fogli, 2009) also argue that culture matters and use
characteristics of the countries of (Insight Report The Global Gender Gap Report 2013) origin
for US immigrants, such as female labor supply, to proxy for culture.
The many varying aspects of cultural diversity contains both positive and negative effects
depending on its specific area of focus. The management literature generally identifies cultural
diversity as a “double-edged sword” (Milliken & Martins, 1996), recognizing both positive and
negative aspects that come from cultural diversity. Findings have indicated that cultural diversity
in boards can have a negative impact on firm performance (measured with Tobin’s Q and ROA),
with the degree of impact determined by the size and complexity of the observed firm. (Frijns,
Dodd, & Cimerova, 2016) Overall, complex firms experience increased levels of cultural
diversity which further increases the potential of negative impacts to firm performance. As such,
these negative impacts may be mitigated by smaller firms with a minimal amount of foreign
sales and operations. Despite the potential of complex firms to be more culturally-diverse and
5
correspondingly produce negative levels of performance these same complex environments can
paradoxically provide an increased opportunity for female inclusion in the work force.
Interestingly, boards that operate within complex environments are also more likely to have
gender-balanced boards as compared to others. (Terjesen, Couto, & Morais, 2016)
The role of culture on financial decision has gained wide acceptance in the finance literature
in more recent years. County specific cultural norms impact behavior of managers in corporate
decision making, in choosing mergers and acquisitions, in cross-border cooperation and in
establishing subsidiaries in foreign countries. Culture impacts the behavior of individual
investors, as research shows that in highly individualistic society’s stock markets generate
greater return. As a result, this overconfidence in stock market outcome leads to higher trading
activity and momentum around the world.
There are many ways to measure the role of culture and the most popular one is the measure
created by Professor Geert Hofstede. Based on his definition, culture is “the collective
programming of the mind distinguishing the members of one group or category of people from
others.” Culture is a broad variable that takes several dimensions – individualism, masculinity,
confidence, power distance, long term orientation and uncertainty avoidance. The main variables
of interest are as follows: Power Distance Index (PDI), Individualism vs. Collectivism (IND),
Masculinity vs. Femininity (MAS), Uncertainty Avoidance Index (UAI), and Long-term
Orientation vs. Short-term Normative Orientation (LTO). These explanatory variables are
detailed within my dataset under Section 5.4 – Hofstede: Six Dimensions of National Culture.
Each cultural dimension is represented by a score which is backed by extensive survey type
research performed by IBM in 70 countries (Hofstede uses the first 40 countries with the largest
numbers of respondents). Hofstede’s cultural framework has been used extensively in research in
6
recent years to help explain differences in performance rates for businesses of all kinds.
Hofstede’s framework, when applied to these measures, includes aspects of cultural differences
that are not equally important once considered as explanations used for describing certain
statistical phenomena.
2.3 The Role of Imposed Quotas and Country Regulations
Another topic for debate in determining female participation highlights the use of quotas and
regulations imposed on a country for gender equity attainment reasons. The introduction of
female quotas in Italy in the 1990s tripled the probability of voting for women (De Paola &
Scoppa, 2010) and increased female representation in politic (Bonomi, Brosio, & Di Tommaso,
2013). (Kang, 2013) found that the success of gender quota laws in Niger depended on the
design of the law, the institutional context, and having female activists monitoring its
application. The perceived notion concerning gender quotas most often accredits an achievement
of superior levels of gender proportion directly to strength in regulation levels for a country.
Contrarily, the issue can become quite paradoxical and as a result, proves to be a dilemma that is
increasingly far reaching.
In 2014, only 20% of directorships on average were held by female directors in the largest
European companies, with an important heterogeneity across countries. These further
supplement gender inequality statistics as they point towards an overwhelming
underrepresentation of females and their inclusion within most labor force sectors across the
globe, especially within leadership positions and higher levels of business and finance. As a
result, improving board-level gender diversity has become a global agenda that aims to promote
gender equality in our societies. This “global agenda” is commonly perceived as an efficient
means for increasing firm accountability and improving performance through better corporate
7
governance. (Rebérioux & Roudaut, 2016) Unfortunately, this link is not so straightforward,
especially regarding quotas. For example, in 2008 the Norwegian experience completed the first
implementation of a gender quota and provided results inconsistent with their hypothesis as they
further demonstrated a negative relationship between gender diversity and firm performance.
(Storvik & Teigen, 2010)
Quotas have shown inconsistent results across countries as they have been noted within a
vast amount of research globally. Highlighting Sweden and Finland as primary examples,
corresponding data per country revealed boards had achieved successes in board diversity
without the use of quotas. Both countries contained top ranking values for female representation
on boards and paradoxically contained zero targets regarding the improvement of gender
diversity. (Kamonjoh, 2014) When looking at within-board effects rather than between, other
studies have provided conflicting results concerning the effectiveness of gender quotas. Within
French boards, quotas have successfully opened the doors of boardrooms to new, unseasoned
females and have distinctive characteristics that set them apart from other board members.
Additionally, this influx of women into French boards were all subjects that – whether a
seasoned female or not – experienced an inner glass ceiling with “positional” gender segregation.
This also resulted in an associated gender fee gap of 5% due to the amplification of the
segregation process from the imposed quotas alone. Although these quotas have helped women
enter the boardroom, it has not succeeded in preventing positional gender segregation within
board composition. (Frijns & Dodd, 2014) The Institutional Shareholder Services further
analyzed the average gender diversity on boards at companies in 30 countries around 5
continents. This study compared the differences between genders and further conducted an
analysis on its various related drivers, including regulation as a primary explanatory variable.
8
(Kamonjoh, 2014) Results reveal that levels of gender diversity are disproportionate across
countries and intrinsically encompass supplementary variables that should be accounted for in
order to more accurately explain the variation amongst labor participation ratios between genders
across cultures.
Many believe incorporating a maternity leave policy can aid in increasing the rate of
females in the labor force. While maternity leave policies can support female labor force
participation rates (Jaumotte, 2003), it also has a non-linear effect on labor force participation
rate when accounting for the duration of leave. (Edin & Gustavsson, 2008) Independent of
duration, maternity leave has a negative effect on the gender gap (Thévenon & Solaz, 2013).
Additionally, the presence of a maternity leave policy that is long in duration as compared to a
paternity leave policy that is short in duration (or entirely non-existent) can encourage employer
discrimination (Mandel & Semyonov, 2005) As such, cultures need policies with a greater parity
between the maternity leave and paternity leave.
Keeping these disparities in mind, it is apparent that not all regulation is equal in terms of
its efficiency for increasing female participation country-by-country. As such, this is a far-
reaching dilemma and entails additional variables beyond a country’s presence of mandatory
quotas as primary means for achieving gender diversity on a global scale. As such, the question
remains whether a society’s differing cultural aspects can provide advantageous economic
impacts that may further reflect social trends towards assuring gender equity in labor force
participation rates.
9
2.4 The Role of Societal Norms
Social norms in various markets often drive the regulatory framework for a country entirely.
(Kamonjoh, 2014) Societal factors help determine an initial base line for the prosperity level of
an economy. The underlying societal factors serve as a comparison tool across countries and help
gauge a county’s “economic success” by way of statistical measurements within the components
of gross domestic product, economic opportunity, health, educational attainment, political
empowerment, and global gender gap score ranking. There is a sizable literature showing that
gender inequalities in education and employment opportunities come at a cost. They not only
deprive the women of basic freedoms (Sen, 1999), but negatively affect development outcomes
for the whole society. They can lead to ill-health, low overall human capital, bad governance,
and lower economic growth (Abu-Ghaida & Klasen, 2004).
Using the Social Institution and Gender Index (SIGI), (Branisa & Klasen, 2013) indicated
that institutions with gender inequality results in lower females in secondary education, higher
fertility rates per women, higher child mortality rates, and a greater perception of corruption in a
respective country. Additionally, weak or restrictive laws related to family, gender-based
violence and economic opportunities are most likely to impede women’s empowerment. (Gaye,
Klugman, Kovacevis, Twigg, & Zambrano, 2010) These findings provide adequate support for
why we should look deeper into the aspects of social norms for a country such as educational
attainment, fertility rates, and overall gender gaps.
Most studies have emphasized the importance of education in models of female labor
supply. (Eckstein & Lifshitz, 2011) estimate a dynamic stochastic female labor supply model
with discrete choice and find that changes in education (accounting for a third of the increase in
female employment) and wages, explaining about 20%, play a large role in explaining female
10
employment. As such, educational attainment has a positive correlation with female labor
participation rates. Additionally, higher female work force participation would also result in a
more skilled labor force, in view of women's higher education levels. (Steinberg & Nakane)
Fertility rate has been proven through time to have a significant impact on the composition of
female labor force. However, the effect is either positive or negative depending on the level of
observation. At the individual level, fertility rate has a negative impact to female labor supply for
a country. For example, (Mishra & Smyth, 2010) indicated that a 1% increase in fertility rate
results in a decrease in the female labor force participation rate by 0.4%. On the other side, at the
cross-country level, fertility rate has a positive impact to female labor supply. (De Laat &
Sevilla-Sanz, 2010) explain why this difference appears at the cross-country level and accredits it
to a finding on men’s home production. Their study found that women living in countries where
men participate more in home production are better able to combine having children with market
work, leading to greater participation in the labor force at relatively high fertility levels. Within
each country however, women with higher relative wages continue to have lower fertility and to
participate more in the labor force than lower-paid women due to the higher opportunity cost of
remaining at home.
Given these contributing factors, instances of occupational gender imbalances reflect, on the
one hand, the societal expectations and role models that contribute to educational and field of
study choices young girls and boys make when they embark upon acquiring foundational
competencies and, on the other hand, women and men’s career planning trajectories as well as
the dynamics of hiring imbalances across industries. (World Economic Forum, 2017)
As of 2017, the World Economic Forum found the gaps between women and men on
economic participation and political empowerment remain wide: only 58% of the economic
11
participation gap has been closed—a second consecutive year of reversed progress and the
lowest value measured by the Index since 2008—and about 23% of the political gap, unchanged
since last year against a long-term trend of slow but steady improvement. Alongside slowed
growth in global economic participation, the overall gap in gender across all sectors has
additionally grown, exhibiting poor performance within the Gender Gap Index across countries
when weighted by population. In 2017, the average progress on closing the global gender gap
stands at a score of 0.680—which means that an average gap of 32% remains to be closed
worldwide across the four Index dimensions to achieve universal gender parity. Last year that
gap was slightly smaller with the average of 31.7%.
3. Dataset
3.1 World Development Indicator (WDI)
Fertility rate, total (births per woman): Total fertility rate represents the number of
children that would be born to a woman if she were to live to the end of her childbearing
years and bear children in accordance with age-specific fertility rates of the specified year.
3.2 Country Size Indicator
Ln(GDP) (Current US$): GDP at purchaser's prices is the sum of gross value added by all
resident producers in the economy plus any product taxes and minus any subsidies not
included in the value of the products. It is calculated without making deductions for
depreciation of fabricated assets or for depletion and degradation of natural resources. Data
are in current U.S. dollars. Dollar figures for GDP are converted from domestic currencies
using single year official exchange rates. For a few countries where the official exchange rate
12
does not reflect the rate effectively applied to actual foreign exchange transactions, an
alternative conversion factor is used. I took the natural log of GDP in order for the large
numerical value to fit more closely within the model and other independent variables.
3.3 Civil Indicator
Rule of Law: Rule of Law captures perceptions of the extent to which agents have
confidence in and abide by the rules of society, and in particular the quality of contract
enforcement, property rights, the police, and the courts, as well as the likelihood of crime and
violence. Estimate gives the country's score on the aggregate indicator, in units of a standard
normal distribution, i.e. ranging from approximately -2.5 to 2.5.
3.4 Hofstede: Six Dimensions of National Culture
Power Distance Index: This dimension expresses the degree to which the less powerful
members of a society accept and expect that power is distributed unequally. The fundamental
issue here is how a society handles inequalities among people. People in societies exhibiting
a large degree of Power Distance accept a hierarchical order in which everybody has a place
and which needs no further justification. In societies with low Power Distance, people strive
to equalize the distribution of power and demand justification for inequalities of power.
Individualism vs. Collectivism: The high side of this dimension, called Individualism, can
be defined as a preference for a loosely-knit social framework in which individuals are
expected to take care of only themselves and their immediate families. Its opposite,
Collectivism, represents a preference for a tightly-knit framework in society in which
individuals can expect their relatives or members of a particular ingroup to look after them in
exchange for unquestioning loyalty. A society’s position on this dimension is reflected in
whether people’s self-image is defined in terms of “I” or “we.”
13
Masculinity vs. Femininity: The Masculinity side of this dimension represents a preference
in society for achievement, heroism, assertiveness, and material rewards for success. Society
at large is more competitive. Its opposite, Femininity, stands for a preference for cooperation,
modesty, caring for the weak and quality of life. Society at large is more consensus-oriented.
In the business context Masculinity versus Femininity is sometimes also related to as “tough
versus tender” cultures.
Uncertainty Avoidance Index: The Uncertainty Avoidance dimension expresses the degree
to which the members of a society feel uncomfortable with uncertainty and ambiguity. The
fundamental issue here is how a society deals with the fact that the future can never be
known: should we try to control the future or just let it happen? Countries exhibiting strong
UAI maintain rigid codes of belief and behavior, and are intolerant of unorthodox behavior
and ideas. Weak UAI societies maintain a more relaxed attitude in which practice counts
more than principles.
Long-term Orientation vs. Short-term Normative Orientation: Every society has to
maintain some links with its own past while dealing with the challenges of the present and
the future. Societies prioritize these two existential goals differently. Societies who score low
on this dimension, for example, prefer to maintain time-honored traditions and norms while
viewing societal change with suspicion. Those with a culture which scores high, on the other
hand, take a more pragmatic approach: they encourage thrift and efforts in modern education
as a way to prepare for the future. In the business context, this dimension is referred to as
“(short-term) normative versus (long-term) pragmatic” (PRA). In the academic environment,
the terminology Monumentalism versus Flexhumility is sometimes also used.
14
Indulgence vs. Restraint: Indulgence stands for a society that allows relatively free
gratification of basic and natural human drives related to enjoying life and having fun.
Restraint stands for a society that suppresses gratification of needs and regulates it by means
of strict social norms
3.5 Quota Indicators (Binary Variables)
Law mandates equal remuneration for females and males for work of equal value
(1=yes; 0=no): Law mandates equal remuneration for females and males for work of equal
value is whether there is a law that obligates employers to pay equal remuneration to male
and female employees who do work of equal value. “Remuneration” refers to the ordinary,
basic or minimum wage or salary and any additional emoluments payable directly or
indirectly, whether in cash or in kind, by the employer to the worker and arising out of the
worker’s employment. “Work of equal value” refers not only to the same or similar jobs but
also to different jobs of the same value.
Mothers are guaranteed an equivalent position after maternity leave (1=yes; 0=no):
Mothers are guaranteed an equivalent position after maternity leave is whether employers of
women returning from maternity leave are legally obligated to provide them with an
equivalent position after maternity leave. It takes into account paid and unpaid maternity
leave and captures whether the employer has a legal obligation to reinstate the returning
employee in an equivalent or better position and salary than the employee had pre-leave.
Where the maternity leave regime explicitly states that the employee may not be indefinitely
replaced, the answer is assumed to be “Yes.” Where the maternity leave regime explicitly
establishes a suspension of the employee’s contract, the answer is assumed to be “Yes.” In
economies that also have parental leave and the law guarantees return after the leave to the
15
same or an equivalent position paid at the same rate but is silent on guaranteeing the same
position after maternity leave, the answer is “Yes.” The answer is “N/A” if no paid or unpaid
maternity leave is available.
3.6 World Economic Forum Indicators (WEF) – Global Gender Gap Report 2017
Global Gender Gap: The Global Gender Gap Index examines the gap between men and
women in four fundamental categories (sub-indexes): Economic Participation and
Opportunity, Educational Attainment, Health and Survival and Political Empowerment. The
Global Gender Gap Index was first introduced by the World Economic Forum in 2006 as a
framework for capturing the magnitude of gender-based disparities and tracking their
progress over time. The Index benchmarks national gender gaps on economic, education,
health and political criteria, and provides country rankings that allow for effective
comparisons across regions and income groups. The rankings are designed to create global
awareness of the challenges posed by gender gaps and the opportunities created by reducing
them.
Economic Participation and Opportunity: This sub index contains three concepts: the
participation gap, the remuneration gap and the advancement gap. The participation gap is
captured using the difference between women and men in labor force participation rates. The
remuneration gap is captured through a hard data indicator (ratio of estimated female-to-male
earned income) and a qualitative indicator gathered through the World Economic Forum’s
annual Executive Opinion Survey (wage equality for similar work). Finally, the gap between
the advancement of women and men is captured through two hard data statistics (the ratio of
16
women to men among legislators, senior officials and managers, and the ratio of women to
men among technical and professional workers).
Educational Attainment: This sub index captures the gap between women’s and men’s
current access to education through ratios of women to men in primary-, secondary- and
tertiary-level education. A longer-term view of the country’s ability to educate women and
men in equal numbers is captured through the ratio of the female literacy rate to the male
literacy rate.
Health and Survival: This sub index provides an overview of the differences between
women’s and men’s health using two indicators. The first is the sex ratio at birth, which aims
specifically to capture the phenomenon of “missing women”, prevalent in many countries
with a strong son preference. Second, we use the gap between women’s and men’s healthy
life expectancy. This measure provides an estimate of the number of years that women and
men can expect to live in good health by taking into account the years lost to violence,
disease, malnutrition and other relevant factors.
Political Empowerment: This sub index measures the gap between men and women at the
highest level of political decision-making through the ratio of women to men in ministerial
positions and the ratio of women to men in parliamentary positions. In addition, we’ve
included the ratio of women to men in terms of years in executive office (prime minister or
president) for the last 50 years. A clear drawback in this category is the absence of any
indicators capturing differences between the participation of women and men at local levels
of government. Should such data become available at a globally comparative level in future
years, it will be considered for inclusion in the Index.
17
3.7 Dependent Variable
Labor force participation rate, female (% of female population ages 15+): Labor force
participation rate is the proportion of the population ages 15 and older that is economically
active: all people who supply labor for the production of goods and services during a
specified period.
4. Methodology
In the second part of my analysis I construct an international list of countries and study
the propensity of women involvement in finance based on the country of domicile specific
information (such as GDP, legal system – civil vs. common law countries, judicial protection of
women), culture variables from Hofstede, and World Development Indicator variables (WDI)
from the World Bank data report. In this section, the regression model follows the linear
estimates model:
Model 1:
Female Participants (as % of workforce) = α + β1* WDI + β2*ln(GDP)+ β3*RuleofLaw + β4 *
Hofstede1-6 + ε
Model 2:
Female Participants (as % of workforce) = α + β1* WDI + β2* RuleofLaw + β3*Quotas1-2 +
β4*WEF1-5 + ε
18
5. Empirical Analysis
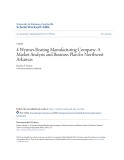
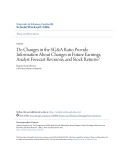
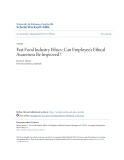
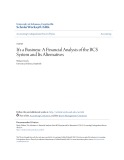
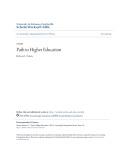
In Table 1, I show the Summary Statistics for each indicator used in my regression models.
Here, I find the mean, median, minimum and maximum for each set of data per indicator. My
results showed that the mean for every indicator is similarly very close to its respective median.
This indicates that there is not significant outliers in the data and confirms that my results are
applicable to all indicators as the median complements the mean as a measure of central
tendencies of our data set. Additionally, when analyzing the minimums and maximums of the
data, we can see extreme differences across countries in the explanation of labor force
participation rates. Within our data set, the minimum female labor force participation rate for a
country is 24.96% and the maximum for a country is 68.99%. This implies that there is
significant disparity in participation rates between countries and confirms the necessity of
increasing rates on a global level. If labor force participation rates are high for women, then more
women will be working and should eventually enter corporate boardrooms if there are no other
barriers to female leadership. This suggests that economic and cultural factors may be important
barriers to female career advancement.
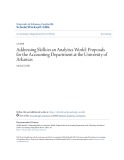
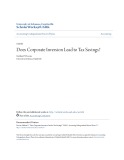
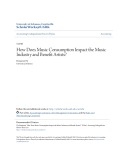
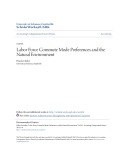
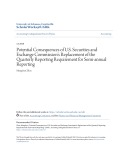
In Table 2, I use a Correlation Matrix to show how each of the indicators used are correlated
with each other. Here we can see that long-term orientation and fertility rates are negatively
correlated. However, amongst indulgent societies, they are positively correlated.
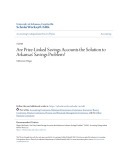
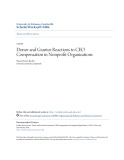
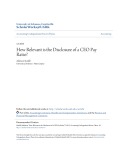
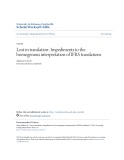
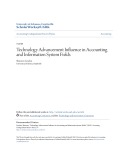
To study the factors that determine women participation in the labor force around the
world, I performed regression analysis and the results are presented in Tables 3 and 4
respectively. Table 3 reflects Model #1 previously identified within my methodology. This table
and its associated regression reflects my results for several variables – the dependent variable is
19
“women participation in the labor force” and the independent variables are two categories –1)
measuring the legal system of the country of domicile - rule of law and 2) culture variables
defined by Hofstede. Two cultural variables were statistically significant – Long-term
Orientation (LTO) and Indulgence vs. Restraint (IVR). The results suggest that countries with a
culture that supports long term orientation and goals are characterized with higher proportion of
women in the labor force. LTO encourages thrifts and efforts in modern education as a way to
prepare for the future. Additionally, a country with high levels of long-term orientation, rather
than short-term, uphold a preference for delayed reward versus instant gratification. A high-
scoring country reflects that family is the basis of society, individuals are more likely to be
married and have children, and education and training are highly valued. This outcome is well
defined and explained by existing literature and supports a positive correlation with female labor
force participation rates. These results also confirm prior literature regarding education’s impact
to female labor force participation as educational attainment is a sound explanation for variations
within the active female labor supply for a country.
Also shown within Table 3: Model 1, I find strong statistical evidence that the relative
measure of indulgence versus restraint is strongly statically significant, suggesting that countries
that value indulgence over restraint have a higher percentage of women in the labor force. It is
important to note that this is not an absolute variable, it is a relative measure that is used to
compare societies. A country reflecting a high score in Indulgence indicates that the individuals
of that culture reported higher feelings of happiness and contentment within their society.
Indulgent societies are characterized with freedom of speech, in general people feel healthier and
happier and interestingly, higher approval of foreign music and films is part of the survey
questions used to create this score. Low scoring countries, or “Restraint” cultures, have strict
20
social norms to control gratification. Examples of countries with high scores of Indulgence are
Sweden, Mexico, Australia and low scores – Egypt, India, and Russia. Therefore, my empirical
results are consistent with the hypotheses that freedom of speech, general openness of the society
and freedom of cultural norms creates a society that is more accepting of higher participation of
women in the workforce.
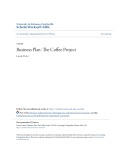
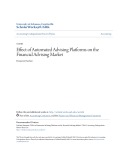
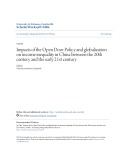
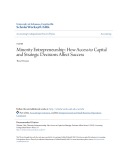
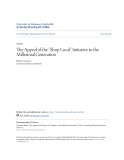
In Table 4, I study the role of several variables that characterize the societal norms of
countries on the propensity of women to enter the labor force. The results are statistically
significant and suggest that higher degree of economic participation, education, health and
political environment are all associated with higher participation of women in the labor force. To
proxy for levels of discrimination in the labor market for women, I chose to utilize the World
Economic Forum’s sub-indices from the 2017 Global Gender Gap Report. This year’s analysis
also reveals gender gaps at the industry level and highlights that even though qualified women
are coming out of the education system, many industries are failing to hire, retain and promote
them, losing out on a wealth of capacity. My findings are consistent with this outcome as all
global gender gap indicators were statistically significant with labor force participation rates for
females, those of which have had declining or stagnant growth more recently, according to recent
data from the World Economic Forum. These results suggest that women participation is highly
determined by the overall societal development.
Interestingly, higher fertility rates are associated with higher female participation in the
labor force. These results contribute to the argument that social norms determine the women
participation in society and workforce. Also my results are consistent with the economic theory
for fertility, suggesting that women do not have to choose between career and family, in fact,
countries with higher fertility rates have also higher participation of women in the workforce.
21
6. Conclusion
In summary, the goal of my research project was to review the existing literature that
explains women participation in the work force and to contribute to the existing research by
providing additional empirical analysis on factors that determine women involvement in the
workforce around the world. I studied factors such as legal tradition, cultural characteristics and
societal norms, health and development. My results are consistent with existing studies and
confirm the hypotheses that better developed societies support more active participation of
women within their society, families, and, collectively, within their societies
In order to ensure the prosperity of our future global economies, we must develop and
maintain economic systems that are both dynamic and all-inclusive. As our world moves into an
era focused less on capitalism and more on talent at the individual level, the respective
competitiveness that a country or corporation maintains will be largely determined by the
innovative capacity of that entity. In this new context, it is imperative that we ensure equal
opportunity to all so that we may fully exhaust our population’s intellectual resources that are
critical to harnessing new opportunities, specifically those that lie within the differing ideas,
perspectives, and skill sets of all individuals. As such, we must continue to work towards effort
to increase the level of female participation in our global labor supply.
22
7. References
Abu-Ghaida, D., & Klasen, S. (2004). The Costs of Missing the Millennium Development Goal on Gender Equity.
Adams, R. B., & Kirchmaier, T. (2012). From Female Labor Force Participation to Boardroom Gender Diversity. Australian School of Business, University of New South Wales; Manchester Business School & Financial Markets Group, LSE.
Bennouri, M., Chtioui, T., Nagati, H., & Nekhili, M. (2018). Female board directorship and firm performance: What really matters? Journal of Banking and Finance, 88, 267-291. Retrieved 4 13, 2018, from https://sciencedirect.com/science/article/pii/s0378426617302972
Bonomi, G., Brosio, G., & Di Tommaso, M. L. (2013). The Impact of Gender Quotas on Votes for Women Candidates: Evidence from Italy.
Branisa, B., & Klasen, S. (2013). Gender Inequality in Social Institutions and Gendered Development Outcomes.
Campbell, K., & Mínguez-Vera, A. (n.d.). Gender Diversity in the Boardroom and Firm Financial Performance.
Carrasco, A., Francoeur, C., Réal, I., Laffarga, J., & Ruiz-Barbadillo, E. (2012). Cultural
differences and board gender diversity. Retrieved 4 13, 2018, from https://hal.archives- ouvertes.fr/hal-00937923/document
Croson, R., & Gneezy, U. (2009). Gender Differences in Preferences. Journal of Economic Literature.
De Laat, J., & Sevilla-Sanz, A. (2010). The Fertility and Women's Labor Force Participation puzzle in OECD Countries: The Role of Men's Home Production.
De Paola, M., & Scoppa, V. (2010). Can gender quotas break down negative stereotypes?
Evidence from changes in electoral rules.
Dobbin, F., & Jung, J. (2011). Corporate Board Gender Diversity & Stock Performance: The Competence Gap or Institutional Investor Bias?
Eckstein, Z., & Lifshitz, O. (2011). Dynakic Female Labor Supply.
Edin, P.-A., & Gustavsson, M. (2008). Time Out of Work and Skill Depreciation.
Fernández, R., & Fogli, A. (2009). Culture: An Empirical Investigation of Beliefs, Work, and Fertility. American Economic Journal: Macroeconomics.
Fernandez, R. (2013). Culture as Learning: The Evolution of Female Labor Force Participation
Over a Century. The American Economic Review, 103(1), 472-500. Retrieved 4 13, 2018, from http://nber.org/papers/w13373
23
Fernandez, R., & Fogli, A. (2009). Culture: An Empirical Investigation of Beliefs, Work, and
Fertility. American Economic Journal: Macroeconomics, 1(1), 146-177. Retrieved 4 13, 2018, from http://nber.org/papers/w11268
Frijns, B., & Dodd, O. (2014). Globalizing the boardroom—The effects of foreign directors on
corporate governance and firm performance.
Frijns, B., Dodd, O., & Cimerova, H. (2016). The Impact of Cultural Civersity in Corporate Boards on Firm Performance.
Frijns, B., Dodd, O., & Cimerova, H. (2016). The impact of cultural diversity in corporate boards
on firm performance. Journal of Corporate Finance, 41, 521-541. Retrieved 4 13, 2018, from https://sciencedirect.com/science/article/pii/s0929119916300943
Gaye, A., Klugman, J., Kovacevis, M., Twigg, S., & Zambrano, E. (2010). Measuring Key Disparities in Human Development. The Gender Inequality Index.
Georgieva, D., Jandik, T., & Lee, W. Y. (2012). The impact of laws, regulations, and culture on cross-border joint ventures. Journal of International Financial Markets, Institutions and Money, 22(4), 774-795. Retrieved 4 13, 2018, from https://sciencedirect.com/science/article/pii/s1042443112000261
Ghani, E., Mani, A., & O'Connell, S. D. (2013). Can Political Empowerment Help Economic
Empowerment? Women Leaders and Female Labor Force Participation in India. Retrieved 4 13, 2018, from https://openknowledge.worldbank.org/handle/10986/16890
Gul, F. A., Srinidhi, B., & Ng, A. C. (2011). Does board gender diversity improve the
informativeness of stock prices. Journal of Accounting and Economics, 51(3), 314-338. Retrieved 4 13, 2018, from https://sciencedirect.com/science/article/pii/s0165410111000176
Insight Report The Global Gender Gap Report 2013. (2013). Retrieved 4 30, 2018, from World Economic Forum: http://www3.weforum.org/docs/WEF_GenderGap_Report_2013.pdf
Jaumotte, F. (2003). Female Labour Force Participation: Past Trends and Main Determinants in OECD Countries.
Kamonjoh, E. (2014). Gender Diversity on Boards: A Review of Global Trends. Institutional Shareholder Services.
Kang, A. (2013). The effect of gender quota laws on the election of women: Lessons from Niger. University of Nebraska - Lincoln.
Mandel, H., & Semyonov, M. (2005). Family Policies, Wage Structures, and Gender Gaps:
Sources of Earnings Inequality in 20 Countries.
Milliken, F. J., & Martins, L. L. (1996). Searching for Common Threads: Understanding the
Multiple Effects of Diversity in Organizational Groups. The Academy of Management Review.
24
Mishra, V., & Smyth, R. (2010). Female labor force participation and total fertility rates in the OECD: New evidence from panel cointegration and Granger causality testing.
Olivetti, C., & Goldin, C. (2013). Shocking Labor Supply: A Reassessment of the Role of World War II on Women’s Labor Supply†. American Economic Review.
Rebérioux, A., & Roudaut, G. (2016). Gender Quota inside the Boardroom: Female Directors. CEPREMAP.
Sen, A. (1999). Development as Freedom.
Smith, N., Smith, V., & Verner, M. (2004). Do women in top management affect firm
performance? A panel study of 2,500 Danish firms. Aarhus, Denmark: Aarhus School of Business.
Steinberg, C., & Nakane, M. (n.d.). Can Women Save Japan?
Storvik, A., & Teigen, M. (2010). Women on Board The Norwegian Experience.
Terjesen, S., Couto, E. B., & Morais, P. (2016). Does the presence of independent and female directors impact firm performance? A multi-country study of board diversity.
Terjesen, S., Couto, E., & Francisco, P. M. (2016). Does the presence of independent and female directors impact firm performance? A multi-country study of board diversity. Journal of Management & Governance, 20(3), 447-483. Retrieved 4 13, 2018, from https://link.springer.com/article/10.1007/s10997-014-9307-8
Thévenon, O., & Solaz, A. (2013). Labour Market Effects of Parental Leave Policies in OECD Countries.
Triana, M. d., Miller, T., & Trzebiatowski, T. (2014). The Double-Edged Nature of Board
Gender Diversity: Diversity, Firm Performance, and the Power of Women Directors as Predictors of Strategic Change. Organization Science, 25(2), 609-632. Retrieved 4 13, 2018, from https://dl.acm.org/citation.cfm?id=2777755
World Bank. (2012). World Development Report.
World Economic Forum. (2014). Global Gender Gap Report.
World Economic Forum. (2017). The Global Gender Gap Report. World Economic Forum.
25
Table 1: Summary Statistics
Indicator
Mean
Median Minimum Maximum
51.304 1.765 26.611 0.615 58.486 49.514 53.135 64.270 53.809
52.152 1.640 26.443 0.560 57.000 51.000 55.000 65.000 52.897
24.964 1.195 23.810 -0.990 11.000 14.000 5.000 29.000 12.594
68.989 2.958 30.047 1.950 104.000 89.000 110.000 95.000 87.909
Labor force participation rate, female (% of female population ages 15+) Fertility rate, total (Births per woman) ln(GDP) Rule of Law Power Distance Index Individualism vs. Collectivism Masculinity vs. Femininity Uncertainty Avoidance Index Long-term Orientation vs. Short-term Normative Orientation
42.415 0.716 0.652 0.979 0.973 0.260 0.595
40.402 0.719 0.683 0.996 0.976 0.223 N/A
12.946 0.568 0.274 0.819 0.918 0.019 0.000
80.134 0.878 0.820 1.000 0.980 0.750 1.000
Indulgence vs. Restraint Global Gender Gap Score Economic Participation and Opportunity Educational Attainment Health and Survival Political Empowerment Law mandates equal remuneration for females and males for work of equal value (1=yes; 0=no)
Mothers are guaranteed an equivalent position after maternity leave (1=yes; 0=no)
0.676
N/A
0.000
1.000
26
l
l
l
m
) n a m o w
e v a e
x e d n
i
l
i
i
s i v i t c e
x e d n
i
l l
a u q e f o k r o w
t n a r t s e R
o C
i
r o f n o i t a r e n u m e r l
t n e m n a t t A
l
l
l y t i n r e t a m
r e p s h t r i b ( l
l
e u a v
l
) P D G ( n
t n e m r e w o p m E
. s v m
l
l
y t i n n m e F . s v y t i n
w a L f o e u R
s i l
e r o c S p a G r e d n e G
i l
i
l
l
a c i t i l
a v i v r u S d n a h t l a e H
I e c n a t s i D r e w o P
n o i t a t n e i r O e v i t a m r o N
. s v e c n e g u d n
l
o P
a n o i t a c u d E
I
l
u c s a M
a b o G
a u d i v i d n
I e c n a d o v A y t n a t r e c n U
r e t f a n o i t i s o p
I
r o f s e a m d n a s e a m e f
m r e t - t r o h S . s v n o i t a t n e i r O m r e t - g n o L
e a m e f , e t a r n o i t a p i c i t r a p e c r o f r o b a L
a t o t , e t a r y t i l i t r e F
t n e a v i u q e n a d e e t n a r a u g e r a s r e h t o M
a u q e s e t a d n a m w a L
y t i n u t r o p p O d n a n o i t a p i c i t r a P c i m o n o c E
-0.018 1.000
-0.482 1.000
-0.071 0.274 0.253 0.128 1.000
1.000 -0.238 1.000 0.065 -0.005 1.000 0.308 -0.417 0.153 1.000 -0.369 0.236 0.025 -0.740 1.000 0.164 -0.298 0.100 0.703 -0.639 1.000 -0.127 -0.141 0.324 0.123 0.091 0.103 1.000 -0.152 -0.232 -0.107 -0.173 0.090 -0.055 0.188 -0.538 0.196 0.043 0.050 0.168 0.092 0.096 1.000 0.370 0.174 0.185 0.557 -0.472 0.232 0.059 -0.206 0.038 0.021 -0.090 -0.047 0.048 0.231 0.130 0.134 -0.143 -0.019 1.000 0.030 -0.039 0.052 0.008 0.106 0.234 0.049 0.024 -0.062 -0.094 0.805 1.000 0.223 -0.107 0.282 0.095 0.066 0.031 0.201 -0.033 0.092 -0.024 0.018 -0.134 0.004 0.152 0.174 -0.067 0.114 -0.200 0.190 0.113 0.042 1.000 -0.021 0.088 -0.248 -0.093 -0.025 0.164 0.110 0.204 -0.165 -0.007 0.871 0.443 0.066 0.140 1.000 -0.205 -0.020 -0.324 -0.019 -0.055 0.233 0.116 0.337 -0.098 -0.192 0.225 0.096 0.180 0.238 0.224 1.000
Labor force participation rate, female (% of female population ages 15+) Fertility rate, total (births per woman) ln(GDP) Rule of Law Power Distance Index Individualism vs. Collectivism Masculinity vs. Femininity Uncertainty Avoidance Index Long-term vs. Short-term Orientation Indulgence vs. Restraint Global Gender Gap Score Economic Participation and Opportunity Educational Attainment Health and Survival Political Empowerment Law mandates equal remuneration for females and males for work of equal value Mothers are guaranteed an equivalent position after maternity leave
0.114 -0.151 -0.342 0.113 -0.210 0.386 -0.287 0.320 -0.281 0.166 0.408 0.362 -0.011 0.000 0.359 0.251 1.000
Table 2: Correlation Matrix
27
Female Participants (as % of workforce) = α + β1* WDI + β2*ln(GDP)+ β3*Civil + β4 * Hofstede1-6 + ε
t Stat
P-value
Fertility rate, total (Births per woman) ln(GDP) Rule of Law Power Distance Index Individualism vs. Collectivism Masculinity vs. Femininity Uncertainty Avoidance Index
Coefficients -7.294 -0.330 -4.692 -0.114 -0.014 -0.066 -0.077
-1.434 -0.334 -1.406 -1.230 -0.150 -0.999 -1.135
0.163 0.741 0.171 0.229 0.882 0.327 0.266
Table 3: Model 1 Regression
Long-term vs. Short-term Orientation** Indulgence vs. Restraint**
0.195 0.333
2.225 3.117
0.035** 0.004**
** Indicates that the variable is statistically significant at the 5% level (p-value < .05)
28
Female Participants (as % of workforce) = α + β1* WDI + β2* Civil + β3*Quotas1-2 + β4*WEF1-5 + ε
Coefficients
t Stat
P-value
Table 4: Model 2 Regression
Fertility rate, total** Rule of Law Law mandates equal remuneration for females and males for work of equal value Mothers are guaranteed an equivalent position after maternity leave Global Gender Gap Score** Economic Participation & Opportunity** Educational Attainment** Health and Survival** Political Empowerment**
0.018 -0.01 -0.017 -0.012 -14.696 3.628 3.596 3.643 3.653
2.466 -1.225 -1.271 -0.836 -2.320 2.298 2.265 2.243 2.301
0.017 0.225 0.208 0.407 0.024 0.025 0.027 0.029 0.025
** Indicates that the variable is statistically significant at the 5% level (p-value < .05)
29
30