Ascorbic acid-pretreated quartz enhances cyclo-oxygenase-2 expression in RAW 264.7 murine macrophages Sonia Scarfı`1,2, Umberto Benatti2, Marina Pozzolini1,2, Emanuela Clavarino2, Chiara Ferraris1,2, Mirko Magnone2, Laura Valisano3 and Marco Giovine1,4
1 Advanced Biotechnology Center, Genoa, Italy 2 Department of Experimental Medicine, Section of Biochemistry, University of Genoa, Italy 3 Department for the Study of the Territory and its Resources, University of Genoa, Italy 4 Department of Biology, University of Genoa, Italy
Keywords ascorbic acid; inflammation; macrophages; reactive oxygen species; silica
Correspondence S. Scarfı`, Department of Experimental Medicine, Section of Biochemistry, University of Genoa, Viale Benedetto XV n(cid:2)1, 16132 Genoa, Italy Fax: +39 010 354415 Tel: +39 010 3538151 E-mail: soniascarfi@unige.it
(Received 22 May 2006, revised 26 October 2006, accepted 30 October 2006)
doi:10.1111/j.1742-4658.2006.05564.x
Exposure to quartz particles induces a pathological process named silicosis. Alveolar macrophages initiate the disease through their activation, which is the origin of the later dysfunctions. Ascorbic acid is known to selectively dissolve the quartz surface. During the reaction, ascorbic acid progressively disappears and hydroxyl radicals are generated from the quartz surface. These observations may be relevant to mammalian quartz toxicity, as sub- stantial amounts of ascorbic acid are present in the lung epithelium. We studied the inflammatory response of the murine macrophage cell line through the RAW 264.7 incubated with ascorbic acid-treated quartz, expression and activity of the enzyme cyclo-oxygenase-2 (COX-2). COX-2 expression and prostaglandin secretion were enhanced in cells incubated with ascorbic acid-treated quartz. In contrast, no changes were observed in cells incubated with Aerosil OX50, an amorphous form of silica. Quantifi- cation of COX-2 mRNA showed a threefold increase in cells incubated with ascorbic acid-treated quartz compared with controls. The transcription factors, NF-jB, pCREB and AP-1, were all implicated in the increased inflammatory response. Reactive oxygen species (H2O2 and OH•) were involved in COX-2 expression in this experimental model. Parallel experi- ments performed on rat alveolar macrophages from bronchoalveolar lavage confirmed the enhanced COX-2 expression and activity in the cells incuba- ted with ascorbic acid-treated quartz compared with untreated quartz. In conclusion, the selective interaction with, and modification of, quartz parti- cles by ascorbic acid may be a crucial event determining the inflammatory response of macrophages, which may subsequently develop into acute inflammation, eventually leading to the chronic pulmonary disease silicosis.
the molecular mechanisms of molecular pathways, which have been only partially elucidated [1].
Abbreviations AA, ascorbic acid; BAL, bronchoalveolar lavage; COX-2, cyclo-oxygenase-2; EMSA, electrophoretic mobility-shift assay; GAPDH, glyceraldehyde-3-phosphate dehydrogenase; IFN-c, interferon-c; PGE2, prostaglandin E2; ROS, reactive oxygen species.
FEBS Journal 274 (2007) 60–73 ª 2006 The Authors Journal compilation ª 2006 FEBS
60
The main difficulties arising from these studies are due to the solid nature of quartz particles. Particulates are intrinsically heterogeneous in dimension, shape and composition. Furthermore, they never act as a constant Long-term exposure to quartz particles induces a pathological process characterized by the development of fibrotic nodules in the lung, due to the accumula- tion of inflammatory cells, deposition of extracellular matrix and cellular proliferation. The ensuing disease, is the result of a complex interaction of silicosis,
S. Scarfı` et al.
Ascorbate-treated quartz enhances COX-2 expression
the major transcription factors entity, and their cytotoxic potential in a biological envi- ronment depends on their mechanical, thermal and chemical history as well as on the micromorphology at the atomic level [2,3]. It is now generally accepted that silicosis originates from inhalation of quartz particles, which are subsequently incorporated by alveolar macrophages. The cell’s inability to dissolve the crystal- line particulate leads to the chronic inflammation responsible for the development of the disease [4]. Ten years ago, Bavestrello et al.
silica in the
The aim of the present work was to evaluate the production of COX-2 and prostaglandin E2 (PGE2) in RAW 264.7 cells incubated with AA-treated quartz and to compare it with that induced by untreated quartz particles and by a different polymorph of silica, Aerosil OX50. This form of silica does not possess a crystalline structure and has been demonstrated to be unable to chemically interact with AA [6]. An assess- (NF-jB, ment of CREB, AP-1) involved in COX-2 biosynthesis was per- formed, and the relative amount of COX-2 mRNA was quantified. The role of quartz-induced ROS in the modulation of COX-2 expression was investigated. Catalase, mannitol and desferrioxamine were used to assess the importance of different ROS in triggering the inflammatory response towards crystalline silica pretreated or not with AA. Furthermore, experiments performed on rat alveolar macrophages obtained from bronchoalveolar lavage (BAL) confirmed the enhanced COX-2 expression and activity in the cells incubated with AA-pretreated quartz compared with cells chal- lenged with untreated quartz.
in the alveolar space, which is one of
These results suggest that the selective interaction of AA with quartz could be a crucial event determining the inflammatory response of macrophages, which is recog- nized as the first necessary event eventually leading to the quartz-induced chronic pulmonary disease silicosis.
Results
[5] reported that ascorbic acid (AA) is able to partially dissolve the sur- face of quartz, greatly increasing the concentration of surrounding medium. More soluble recently, Fenoglio et al. [6] demonstrated that during this peculiar chemical reaction, while AA progressively disappears, important modifications of the quartz sur- face occur, leading to an increased production of free hydroxyl radicals and H2O2. These findings are rele- vant to mammalian quartz toxicity: by reacting with AA, quartz could deprive the alveolar epithelium of one of its most effective antioxidant defences, and the surface modifications induced by AA increase the con- centration of particle-derived reactive oxygen species (ROS) the mechanisms proposed for quartz fibrogenicity and carcinogenicity [1]. Furthermore, AA-derived quartz dissolution is specific for crystalline silica, as the amor- phous silica particulate is not modified at its surface by ascorbate treatment and does not produce hydroxyl radicals [6].
Quartz-induced COX-2 expression and PGE2 production in RAW 264.7 cells
The inducible enzyme COX-2 is expressed in the early stages of the inflammatory response and catalyses the first step of the synthesis of PGE2, an important inflammatory mediator. COX-2 and PGE2 were quan- tified in RAW 264.7 macrophages challenged with quartz particles pretreated or not with AA.
These findings prompted us to further investigate the cytotoxicity of AA-treated quartz particles in the murine macrophage cell line RAW 264.7, a cell model widely used for molecular studies on cell–particle interaction [7,8]. In this study, we showed that AA-pretreated quartz establishes a significantly higher cytotoxicity compared with untreated quartz [9]. These results suggested an active role for AA as a cofactor involved in the early stages of quartz-induced pathology, and they represent the basis of the present study on the effect of AA on the quartz-induced inflammatory response in the same cell model.
FEBS Journal 274 (2007) 60–73 ª 2006 The Authors Journal compilation ª 2006 FEBS
61
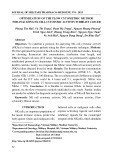
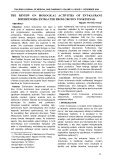
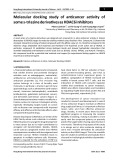
RAW 264.7 cells were incubated with different con- centrations of AA-treated Min-U-Sil 5 quartz or with AA-treated Aerosil OX50 (a commercial amorphous silica). COX-2 expression was evaluated, by western blot analysis, after 6 h of treatment. Results were com- pared with data obtained on cells incubated with untreated particles and on untreated cells. Untreated quartz suspensions, at concentrations of 15, 50 and 100 lgÆmL)1, induced COX-2 synthesis in RAW 264.7 cells (Fig. 1A, black bars) as well as AA-treated quartz (Fig. 1A, striped bars). The statistical analysis of vari- ance showed a significant difference in COX-2 synthe- sis both between untreated and AA-treated quartz particles (P < 0.001) and among the different quartz The inducible enzyme cyclo-oxygenase-2 (COX-2) is one of the molecules principally involved in the imme- diate cellular inflammatory response. It is encoded by an immediate-early gene induced by various pro- including endotoxin, cytokines, inflammatory agents, mitogens and particulates. This enzyme has emerged as primarily responsible for the synthesis of the prosta- noids involved in acute and chronic inflammatory states, and recently it has been documented that its expression is also increased in cellular and animal models after quartz exposure [7,10–12].
S. Scarfı` et al.
Ascorbate-treated quartz enhances COX-2 expression
the same concentrations of AA-treated (Fig. 1B, striped bars) or untreated Aerosil OX50 particles (Fig. 1B, black bars) stimulated the production of high amounts of COX-2 with no significant difference between AA-treated and untreated aerosil samples. However, COX-2 expression in cells challenged with AA-treated or untreated aerosil showed a significant, dose-dependent COX-2 synthesis (analysis of variance, P < 0.001), with values at 15 lgÆmL)1 lower than those at 50 lgÆmL)1 (Tukey test, P < 0.05) and values at 50 lgÆmL)1 lower than those at 100 lgÆmL)1 (Tukey test, P < 0.05).
Aerosil particles have a surface area 10 times higher than quartz particles. Thus, 100 lgÆmL)1 quartz and 15 lgÆmL)1 aerosil had a similar surface area (5.2 and 6.5 cm2, respectively; Fig. 1A,B) and induced a similar increase in COX-2 expression. At 100 lgÆmL)1 and a surface area of 43 cm2ÆmL)1, aerosil particles induced the highest increase in COX-2 expression in RAW cells (Fig. 1B).
increase in COX-2 at
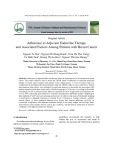
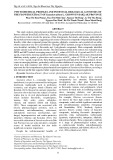
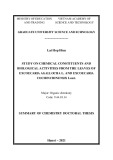
To quantify the enzymatic activity of COX-2 in our experimental conditions, we also determined PGE2 production in quartz-treated RAW 264.7 cells after 6 treatment. PGE2 concentration in the and 18 h of medium of cells incubated for 6 h (Fig. 2A, black bars) or for 18 h (Fig. 2A, white bars) was significantly increased by untreated quartz (analysis of variance, P ¼ 0.000); furthermore, at 6 h, values measured at 100 lgÆmL)1 were higher than values at 15 and 50 lgÆmL)1 (Student–Newman–Keuls test, P < 0.05). The relevant values were the following: at 6 h Q15 was 44.3 pgÆmL)1, Q50 was 54.1 pgÆmL)1 and Q100 was 73.9 pgÆmL)1; at 18 h Q15 was 53.1 pgÆmL)1, Q50 was 56.2 pgÆmL)1 and Q100 was 75.6 pgÆmL)1.
Fig. 1. COX-2 expression in quartz-treated and aerosil-treated cells. (A) COX-2 expression in RAW 264.7 cells stimulated with AA-trea- ted (striped bars) or untreated (black bars) Min-U-Sil quartz was evaluated after 6 h of incubation by western blot analysis of total cell lysates. Cells were challenged with untreated (q) or AA-treated (qa) quartz particles at 15, 50 and 100 lgÆmL)1. Results are expressed as density ratio between each COX-2 band and the cor- responding b-actin band, relative to control. Values are the mean ± SD from eight experiments. The asterisk indicates a statis- tically significant difference between q and qa values (Tukey test, P < 0.05). (B) COX-2 expression in RAW 264.7 cells stimulated with AA-treated (striped bars) or untreated (black bars) Aerosil OX50 silica particles was evaluated after 6 h of incubation by west- lysates. Cells were challenged with ern blot analysis of total cell untreated (a) or AA-treated (aa) aerosil particles at 15, 50 and 100 lgÆmL)1 Results are expressed as density ratio between each COX-2 band and the corresponding b-actin band, relative to control. Values are the mean ± SD from eight experiments. The symbol # indicates a significant increasing aerosil concentrations (15 versus 50 lgÆmL)1, P < 0,05; 50 versus 100 lgÆmL)1, P < 0,05, Tukey test).
concentrations
concentrations (P < 0.001), and, in particular, cells stimulated with AA-treated quartz showed higher COX-2 expression than cells challenged with untreated particles (Tukey test, P < 0.05).
FEBS Journal 274 (2007) 60–73 ª 2006 The Authors Journal compilation ª 2006 FEBS
62
Similar experiments were performed with Aerosil OX50, which is not known to cause silicosis and does not react with AA [6]. Exposure of RAW 264.7 cells to Prostaglandin production in cell cultures challenged with AA-treated particles (Fig. 2A, dotted bars) was (1.3-fold to 1.65-fold higher) significantly different from that measured in cultures stimulated with untreated quartz at both 6 h (black, dotted bars) and 18 h (white, dotted bars) incubation (analysis of vari- ance, P < 0.01). In this case, the PGE2 concentration in the medium of cells incubated with AA-treated quartz increased in a significant, dose-dependent fash- ion both at 6 and 18 h, with a significant difference between increasing quartz (analysis of variance, P ¼ 0.000, Student–Newman–Keuls test, P < 0.05). The relevant values were: at 6 h, QA15 was 57.6 pgÆmL)1, QA50 was 79.7 pgÆmL)1 and QA100 was 117.9 pgÆmL)1; at 18 h, QA15 was 72.9 pgÆmL)1, QA50 was 92 pgÆmL)1 and QA100 was 116.8 pgÆmL)1. Murine macrophages were also challenged with AA- costimulated with pretreated or untreated quartz 100 pgÆmL)1 interferon-c (IFN-c) a cytokine released by activated lymphocytes, mimicking in our model a
S. Scarfı` et al.
Ascorbate-treated quartz enhances COX-2 expression
later stage of inflammation, when these cells infiltrate the lung tissue in large numbers and contribute to the development of a chronic inflammatory state.
concentration and by the
In the presence of IFN-c, PGE2 release into the medium was significantly increased by treatment of the cells with quartz, AA-treated or untreated, by the par- ticle incubation time (Fig. 2B; analysis of variance, P < 0.001). Specifically, costimulation of RAW 264.7 cells with untreated quartz particles together with IFN-c for 6 h (black bars) or 18 h (white bars) induced a greater increase in PGE2 production in all samples ranging between a 2.8- fold and a 19.6-fold increase compared with the corres- ponding values in the absence of IFN-c (Fig. 2A). The relevant values of PGE2 concentrations were the fol- lowing: at 6 h, Q15 was 122.2 pgÆmL)1, Q50 was 149.6 pgÆmL)1 and Q100 was 174.8 pgÆmL)1; at 18 h, Q15 was 225.7 pgÆmL)1, Q50 was 598 pgÆmL)1 and Q100 was 1485 pgÆmL)1.
PGE2 production by cells challenged with untreated quartz was significantly increased at 18 h compared with 6 h (Fig. 2B, analysis of variance, P < 0.001): the increase in PGE2 production at increasing concen- trations (15–100 lgÆmL)1) was only significant (analy- sis of variance, P ¼ 0.000) after 18 h of incubation (Student–Newman–Keuls test, P < 0.05). Furthermore,
IFN-c, PGE2 in the presence of release from cells stimulated with AA-treated Min-U- Sil 5 quartz (Fig. 2B, dotted bars) was further signifi- cantly increased, 1.4-fold to 4.8-fold, over that from cells challenged with untreated quartz (analysis of vari- ance, P < 0.001). The relevant values were: at 6 h, QA15 was 256.5 pgÆmL)1, QA50 was 502.2 pgÆmL)1 and QA100 was 836.3 pgÆmL)1; at 18 h, QA15 was 529.7 pgÆmL)1, QA50 was 1337 pgÆmL)1 and QA100 was 2065 pgÆmL)1.
(A) PGE2 con- Fig. 2. PGE2 production in quartz-incubated cells. centration detected in RAW 264.7 cell supernatants after 6 h (black bars) and 18 h (white bars) stimulation with quartz was determined using a PGE2 monoclonal EIA kit. Cells were chal- lenged with untreated (q) or AA-treated (qa, dotted bars) quartz particles at 15, 50 and 100 lgÆmL)1. Values are the mean ± SD from eight experiments. The symbol § indicates a significant dif- ference between the Q100 and both the Q15 and the Q50 val- ues at 6 h (Student–Newman–Keuls test, P < 0.05). The asterisk indicates a significant difference between Q and QA values, at all particle concentrations and at both time points (analysis of variance, P < 0.01). The symbol # indicates a significant differ- ence between PGE2 values at increasing QA concentrations, at both time points (QA15 versus QA50 versus QA100, Student– Newman–Keuls Test, P < 0.05). (B) PGE2 concentration detected in RAW 264.7 cell supernatants after 6 h (black bars) and 18 h (white bars) stimulation with AA-treated (dotted bars) or untreated quartz, in the presence of murine IFN-c (100 pgÆmL)1), was determined using a PGE2 monoclonal EIA kit. Values are the mean ± SD from eight experiments. The symbol § indicates a significant difference between Q15 versus Q50 versus Q100 val- ues at 18 h (Student–Newman–Keuls test, P < 0.05). The aster- isks (**) indicate a significant difference between Q values at 18 h versus Q values at 6 h (analysis of variance, P < 0.001). The single asterisk indicates a significant difference between QA and Q values at all particle concentrations and at both time points (analysis of variance, P < 0.001). The symbol # indicates a significant difference between the QA values at increasing con- centrations, at both time points (Tukey test, P < 0.05).
PGE2 release from cells stimulated with AA-treated quartz in the presence of IFN-c was affected by both incubation time and particle concentration (Fig. 2B, dotted bars, analysis of variance, P < 0.001); in parti- cular, values recorded at 18 h were significantly higher than those at 6 h (Tukey test, P < 0.05), and at both time points a significant concentration-dependence of the effect of AA-treated quartz was observed (Tukey test, P < 0.05).
both AA-treated
FEBS Journal 274 (2007) 60–73 ª 2006 The Authors Journal compilation ª 2006 FEBS
63
Summarizing, PGE2 production and release by stimulated with both AA-treated and RAW cells untreated quartz occurred mainly during the first 6 h and did not significantly increase during the subse- in the presence of quent 12 h (Fig. 2A). Conversely, quartz untreated and IFN-c, particles induced a sustained PGE2 release, leading to a significantly higher PGE2 concentration in the
S. Scarfı` et al.
Ascorbate-treated quartz enhances COX-2 expression
versus quartz (754.2 pgÆmL)1 with untreated 272.9 pgÆmL)1).
Time-course of COX-2 mRNA synthesis in RAW 264.7 macrophages medium at 18 h than at 6 h incubation (Fig. 2B). Under the same conditions (particle concentration, incubation time, presence or absence of IFN-c), PGE2 release from cells stimulated with AA-treated quartz was always higher than that from cells chal- lenged with untreated quartz.
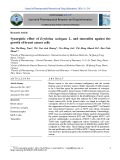
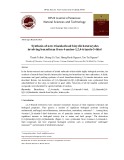
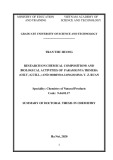
COX-2 expression and activity were also evaluated in primary cultures of rat alveolar macrophages iso- lated from BAL of healthy animals and challenged for 6 h with or without 100 lgÆmL)1 AA-treated or untreated quartz. COX-2 expression (Fig. 3A) was sig- nificantly increased by incubation of the cells with untreated or AA-treated quartz (analysis of variance, P ¼ 0.000), with increasing protein expression being observed in control versus untreated versus AA-treated quartz samples (Student–Newman–Keuls test, NT ver- sus Q100 versus QA100, P < 0.05).
Fig. 3. COX-2 expression and PGE2 production in quartz-incubated rat alveolar macrophages. (A) COX-2 expression in rat alveolar macro- phages stimulated with AA-treated (striped bars) or untreated (black bars) Min-U-Sil 5 quartz was evaluated by western blot analysis of total lysates after 6 h of incubation. The final concentration of quartz particles was 100 lgÆmL)1 (Q100, QA100 untreated and treated). Results are expressed as the density ratio between each COX-2 band and the corresponding b-actin band relative to control. Values are the mean ± SD from three experiments. The asterisk indicates a significant increase in COX-2 expression in QA100 versus Q100 versus NT samples (Student–Newman–Keuls test, P < 0.05). (B) PGE2 concentration was detected in rat alveolar macrophage supernatants after 6 h of stimulation with 100 lgÆmL)1 untreated (black bars) or AA-treated quartz (striped bars) using a PGE2 monoclonal EIA kit. Values are the mean ± SD from six experiments. The symbol § indicates a significant increase in PGE2 production in QA100 versus Q100 versus NT samples (multiple comparison test, P < 0.05).
FEBS Journal 274 (2007) 60–73 ª 2006 The Authors Journal compilation ª 2006 FEBS
64
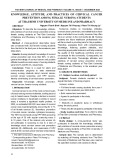
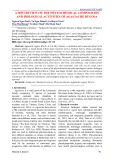
In line with this result, PGE2 release (Fig. 3B) in the culture medium of BAL macrophages was significantly increased in AA-treated or untreated quartz samples compared with control, untreated cells (Kruskal–Wallis analysis of variance, 0.02 < P < 0.05) with progres- sively increasing PGE2 concentrations being observed in the media from control cells, cells stimulated with untreated quartz, and cells challenged with AA-treated quartz suspensions (multiple comparison test, NT ver- sus Q100 versus QA100, P < 0.05). In particular, PGE2 release into the culture medium from cells incu- bated with AA-treated quartz was 2.8-fold higher than that measured in the supernatant from cells challenged COX-2 mRNA synthesis was measured by quantitative RT-PCR analysis in RAW 264.7 macrophages stimula- ted with 100 lgÆmL)1 AA-treated or untreated quartz. COX-2 mRNA expression at the various incubation times, normalized to the respective glyceraldehyde-3- phosphate dehydrogenase (GAPDH) internal standard, was compared with COX-2 expression at time zero (Fig. 4). COX-2 transcription was significantly induced 30 and 60 min after cell exposure to both AA-treated (striped bars) and untreated quartz (black bars), with no significant difference observed for each stimulus between the two time points. For both stimuli, COX-2 mRNA decreased below time-zero values 3 h after cell exposure to the particles (Fig. 4). Thus, COX-2 mRNA concentrations in cells challenged with untreated and AA-treated quartz were statistically compared at 30 incubation. A significant difference and 60 min of between samples challenged with untreated and AA-treated quartz was observed (Scheirer–Ray–Hare 0.001 < P < 0.01), with AA-treated quartz test, inducing a COX-2 transcription 2.5-fold higher than that at time zero, and untreated quartz increased COX-2 transcription 1.5-fold over time zero (mean of values recorded at 30 and 60 min).
S. Scarfı` et al.
Ascorbate-treated quartz enhances COX-2 expression
Fig. 4. RT-PCR of COX-2 mRNA in quartz-treated RAW 264.7 cells. COX-2 mRNA transcription was monitored in RAW 264.7 macro- phages by RT-PCR analysis from 30 min to 18 h after cell stimula- tion with 100 lgÆmL)1 AA-treated (striped bars) or untreated quartz (black bars). Results are the mean of three independent experi- ments performed in triplicate and expressed as COX-2 mRNA syn- thesis normalized to the GAPDH transcription, relative to control cells at time zero. At 30 and 60 min of incubation, a significant difference (*) between samples challenged with untreated and AA-treated quartz was observed (Scheirer–Ray–Hare test, 0.001 < P < 0.01).
Nuclear translocation of NF-jB, AP-1 and pCREB in RAW 264.7 macrophages
The nuclear translocation of the transcription factors known to be responsible for COX-2 synthesis triggered i.e. NF-jB, AP-1 and by inflammatory stimuli, pCREB [13], was assessed by electrophoretic mobility- shift assay (EMSA) on RAW 264.7 macrophages sti- mulated with different concentrations of AA-treated or these untreated quartz for 30 min. The results of experiments are shown in Fig. 5. Nuclear translocation of NF-jB (Fig. 5A)
at 50 suspensions
Fig. 5. NF-jB, pCREB and AP-1 nuclear translocation in quartz-trea- ted RAW 264.7 cells. EMSA analyses of NF-jB (A), pCREB (B) and AP-1 (C) were performed on nuclear extracts of RAW 264.7 cells stimulated for 30 min with 15, 50 and 100 lgÆmL)1 of AA-treated (QA, striped bars) or untreated quartz (Q, black bars). Bars indicate transcription factor band density relative to control, untreated cells and are the mean ± SD from four experiments. (A) The asterisk indicates a significant difference between Q and QA samples ver- sus control (analysis of variance, P < 0.05). The symbol § indicates a significant difference between QA100 and Q100 values (t-test, (B) The asterisk indicates a significant difference P < 0.01). between Q and QA samples versus control (analysis of variance, P < 0.001). The symbol § indicates a significant difference between QA100 and Q100 values (t-test, P < 0.01). (C) The asterisk indi- cates a significant difference between Q and QA samples versus control (analysis of variance, P < 0.05). The symbol § indicates a significant difference between QA15 and Q15 values (t-test, P < 0.01).
effect was
in RAW 264.7 was significantly higher in cells incubated with both AA-treated (striped bars) and untreated (black bars) quartz at increasing particle concen- tration (analysis of variance, P < 0.05). AA-treated and 100 lgÆmL)1 quartz 15, induced a concentration-dependent increase in NF-jB translocation (analysis of variance, P < 0.001; Tukey test, 15 versus 50 versus 100 lgÆmL)1, P < 0.05), with 100 lgÆmL)1 inducing a higher NF-jB trans- location than untreated quartz (t-test, P < 0.01). In untreated quartz suspensions, the dose-dependence of the significant only between 15 and 50 lgÆmL)1 (analysis of variance, P < 0.05; Tukey test, P < 0.05).
FEBS Journal 274 (2007) 60–73 ª 2006 The Authors Journal compilation ª 2006 FEBS
65
the concentrations (analysis of variance, P < 0.001). In both AA-treated and untreated quartz samples, pCREB density values at 100 lgÆmL)1 particle concentration pCREB nuclear translocation (Fig. 5B) was also significantly increased by incubation of cells with AA-treated and untreated quartz, at all particle
S. Scarfı` et al.
Ascorbate-treated quartz enhances COX-2 expression
were significantly higher than at 15 and 50 lgÆmL)1, but, in the case of untreated quartz, the difference between the effect of 50 and 100 lgÆmL)1 was lower (analysis of variance, P < 0.05; Tukey test, P < 0.05) than the one measured for the same concentrations of AA-treated quartz (analysis of variance, P < 0.001; Tukey test, P < 0.05). Besides, at 100 lgÆmL)1, AA-treated quartz induced a higher pCREB trans- location than untreated quartz (t-test, P < 0.01).
The increased ROS generation induced by AA-trea- ted versus untreated quartz on RAW cells prompted us to explore the effect of ROS scavengers on the increased COX-2 expression triggered by AA-treated quartz in RAW 264.7 macrophages. Cells were incuba- ted for 6 h with AA-treated and untreated quartz in the presence of excess of the radical scavengers, and COX-2 expression was analyzed by western blot. Pre- liminary experiments had demonstrated no effect of the radical scavengers themselves on COX-2 synthesis in RAW cells (not shown).
At all quartz concentrations tested, COX-2 expres- sion in RAW 264.7 cells was increased by AA-treated or untreated quartz and was affected by the presence of the three scavengers (Fig. 6A, analysis of variance P < 0.005; Fig. 6B, analysis of variance P < 0.001; Fig. 6C, analysis of variance P < 0.01).
Finally, nuclear translocation of AP-1 (Fig. 5C) was also significantly increased in cells incubated with AA- treated or untreated quartz, at all particle concentra- tions (analysis of variance, P < 0.05). For both the AA-treated and untreated quartz suspensions, the highest effect was observed at 15 lgÆmL)1 (analysis of variance, P < 0.05; Tukey test, P < 0.05, for both series of data), with AA-treated quartz inducing a higher AP-1 translocation than untreated quartz (t-test, P < 0.01).
(striped bars)
Summarizing, at 100 lgÆmL)1 particle concentration, translocation of NF-jB (Fig. 5A) and pCREB (Fig. 5B) was significantly higher in cells stimulated with AA-treated quartz than with untreated quartz (black bars), whereas no significant difference was observed at lower particle concentra- tions; conversely, AP-1 (Fig. 5C) was more abundant in the nuclei of cells stimulated with AA-treated quartz compared with untreated quartz only at the lowest quartz concentration (15 lgÆmL)1). At 15 lgÆmL)1 particle concentration (Fig. 6A), no significant difference in the COX-2 synthesis triggered by untreated quartz was observed in the absence (Q) or presence of the various scavengers (Qc, Qm, Qd). Conversely, the COX-2 expression stimulated by AA- treated quartz was significantly inhibited by the pres- ence of scavengers (analysis of variance, P < 0.001). Indeed, the COX-2 density values in the presence of catalase (QAc) and mannitol (QAm) were significantly lower than the values in the absence of scavengers (QA) or in the presence of desferrioxamine (QAd) (Dunnett test, P < 0.05).
Role of oxygen radicals in quartz-induced COX-2 synthesis
scavengers
particle At 50 lgÆmL)1 particle concentration (Fig. 6B), no significant difference in the COX-2 synthesis stimulated by AA-treated quartz was observed in the absence (QA) or presence of the various scavengers (QAc, QAm, QAd), whereas COX-2 expression triggered by untreated quartz (Q) was significantly inhibited by the presence of (analysis of variance, P < 0.001). In fact, COX-2 density values in the pre- sence of catalase (Qc) and mannitol (Qm) were signifi- cantly lower than in the absence of scavengers (Q) or in the presence of desferrioxamine (Qd) (Dunnett test, P < 0.05). Also 100 lgÆmL)1 at
FEBS Journal 274 (2007) 60–73 ª 2006 The Authors Journal compilation ª 2006 FEBS
66
(Dunnett (Qc) In preliminary experiments, ROS production by quartz-stimulated RAW cells was evaluated with a ROS-specific fluorescent probe in the presence or absence of the radical scavengers catalase, mannitol and desferrioxamine, which remove hydrogen per- oxide, hydroxyl radicals and iron, respectively (the latter being required in the Fenton reaction, which into OH•). AA-treated quartz at converts H2O2 100 lgÆmL)1 induced a threefold increase in ROS generation compared with the same concentrations of untreated quartz, after 1 h incubation (not shown). Desferrioxamine did not affect ROS generation by either untreated or AA-treated quartz. Conversely, mannitol completely quenched ROS production trig- gered by untreated quartz, whereas it reduced the probe’s fluorescence in the presence of AA-treated quartz only by (cid:2) 24% (not shown). Unfortunately, the effect of catalase could not be tested, because of severe interference of the enzyme with the probe’s fluorescence. concentration (Fig. 6C), no significant difference in the COX-2 syn- thesis stimulated by AA-treated quartz was observed in the absence (QA) or presence of the various scav- engers (QAc, QAm, QAd). Conversely, in untreated quartz samples, a significant difference was observed in the absence or presence of scavengers (Q, Qc, Qm, Qd, analysis of variance, P < 0.005), although the only significant reduction in COX-2 expression rela- tive to the quartz-treated samples (Q) was observed in the presence of test, catalase P < 0.05).
S. Scarfı` et al.
Ascorbate-treated quartz enhances COX-2 expression
Fig. 6. COX-2 expression in quartz-stimula- ted RAW 264.7 cells in the presence of ROS scavengers. COX-2 was analyzed by western blot in RAW 264.7 cells after 6 h incubation with different concentrations of AA-treated (QA, striped bars) or untreated quartz (Q, black bars) in the presence of 4000 UÆmL)1 catalase (c), 50 mM mannitol (m) and 2 mM desferrioxamine (d). Bars indi- cate the COX-2 band density, normalized on the corresponding b-actin bands, relative to the density of the COX-2 band in cells sti- mulated with untreated quartz (Q). Values are the mean ± SD from four experiments. (A) The symbol § indicates a significant dif- ference between Qc, Qm, Qd, QA, QAm, QAc, QAd values versus the Q value (analy- sis of variance, P < 0.005). COX-2 expres- sion in QA samples was significantly inhibited (*) by the presence of catalase and mannitol (QAc and QAm versus QA, analy- sis of variance, P < 0.001, Dunnett test, P < 0.05). (B) The symbol § indicates a sig- nificant difference between Qc, Qm, Qd, QA, QAm, QAc, QAd values versus the Q value (analysis of variance, P < 0.001). COX-2 expression in Q samples was signi- ficantly inhibited (*) by the presence of catalase and mannitol (Qc and Qm versus Q, analysis of variance, P < 0.001, Dunnett test, P < 0.05). (C) The symbol § indicates a significant difference between Qc, Qm, Qd, QA, QAm, QAc, QAd values versus the Q value (analysis of variance, P < 0.01). COX-2 expression in Q samples was significantly inhibited (*) by the presence of catalase (Qc versus Q, analysis of variance, P < 0.005, Dunnett test, P < 0.05).
expression apparently rules out the involvement of a Fenton reaction in mediating quartz effects on COX-2 expression.
FEBS Journal 274 (2007) 60–73 ª 2006 The Authors Journal compilation ª 2006 FEBS
67
Summarizing, catalase reduced COX-2 expression in cells stimulated with AA-treated quartz (QA, striped bars) at the lowest particle concentration (15 lgÆmL)1, Fig. 6A), while at higher particle concentrations (50– 100 lgÆmL)1) it reduced COX-2 expression only in cells stimulated with untreated quartz (Fig. 6B,C). Mannitol reduced COX-2 expression in cells incubated with untreated quartz only at 50 lgÆmL)1 particle concentration (Fig. 6B), while in cells stimulated with AA-treated quartz it was effective only at the lowest particle concentration (15 lgÆmL)1, Fig. 6A). Desferri- oxamine was always without effect. The failure of to inhibit quartz-induced COX-2 desferrioxamine These data confirm results obtained by others indi- cating that oxygen radicals play an important role in mediating quartz-induced COX-2 expression in macro- phages, and indicate that their production is strictly related to particle concentration [14]. Furthermore, the above results indicate that ROS generation is higher in cells challenged with AA-treated compared with untreated quartz and that, at the lowest particle con- centration, ROS scavengers are able to prevent COX-2 synthesis, whereas at higher particle concentrations
S. Scarfı` et al.
Ascorbate-treated quartz enhances COX-2 expression
protein production is apparently triggered by other signals.
Discussion
Quartz toxicity towards mammalian cells is well known in the field of occupational health research, although the molecular mechanisms of quartz-induced cell tissue damage are not yet completely understood. Many experimental models have been investigated to address the complex interactions between the heteroge- neous lung tissue cell population and quartz particles. One of the most consolidated pieces of evidence from these studies is the strict dependence of cell reactivity on the properties of particle surface.
cancer progression [21,22]. Interestingly, the enhancing effect of AA-treated over untreated quartz on COX-2 synthesis was even more evident in the presence of IFN-c (Fig. 2), a cytokine produced by activated lymphocytes, which are believed to be recruited by macrophages at a later stage of the lung inflammatory process. The result of this experiment suggests that the quartz surface modifications caused by AA are rele- vant not only in the first steps of the lung inflam- matory response, but also subsequently. The fact that macrophages are unable to dissolve the internalized quartz particles indeed prolongs macrophage activation ingestion–re-ingestion cycles and through multiple exposes the same cells to cytokines produced by activa- ted lymphocytes [4]. The long-lasting presence of quartz in the lung may expose the particles to AA pre- sent in the bronchoalveolar fluid, inducing the chem- ical modifications demonstrated by previous in vitro the resulting in vivo AA-modified experiments [6,9]; quartz could eventually favour an escalation of the inflammatory response by macrophages, also stimula- ted by cytokines released by other cell types during the ongoing inflammation.
The presence of AA in the lung fluids has been dem- onstrated, and its possible involvement in the develop- ment of quartz-induced lung injury had already been hypothesized some years ago [15–17]. Ghio et al. [16] observed a remarkable increase in the accumulation of inflammatory cells in the lung fluids of guinea pigs fed an AA-rich diet and exposed to Min-U-Sil 5. Con- versely, control animals fed low doses of AA and exposed to the same amount of quartz showed a reduced proliferation of inflammatory cells.
exposure surface after
In connection with this, we have recently demonstra- ted that specific chemical modifications occurring on the quartz to AA cause increased quartz cytotoxicity in the murine macro- phage cell line RAW 264.7 [9]. As cytotoxicity is only one of the many aspects of macrophage reactivity to quartz, we here investigated the inflammatory response of RAW 264.7 macrophages, a cell model widely used for in vitro studies of the biological response to quartz particles and of primary rat alveolar macrophages to AA-treated quartz [7,8,18–20]. Transcription of COX- 2, which catalyzes the first step of PGE biosynthesis, occurs in the early stages of macrophage activation and is known to be triggered by quartz [11].
[23]. A possible explanation for the cells
Thus, we investigated COX-2 transcription, expres- sion and enzymatic activity in terms of PGE2 produc- tion in the RAW cell line and BAL macrophages. The transcription factors involved in COX-2 induction and the possible role of specific ROS in triggering the COX-2 synthetic pathway were also investigated. phagocytosis, with smaller
the highest
FEBS Journal 274 (2007) 60–73 ª 2006 The Authors Journal compilation ª 2006 FEBS
68
Results obtained here also demonstrate the specif- icity of action of AA on crystalline (Min-U-Sil 5 quartz), as opposed to amorphous (Aerosil OX50), silica. Indeed, no difference in COX-2 synthesis was observed between cell cultures incubated with AA- treated or untreated Aerosil OX50, although, rather surprisingly, we observed significant COX-2 expres- sion triggered by the amorphous silica. In contrast with what was observed with quartz, however, cell activation was transient, decreasing rapidly 18 h after exposure to the particles (data not shown), suggest- ing an acute cell response followed by a rapid recov- ery. This time-course of COX-2 synthesis led us to rule out a possible endotoxin contamination of the amorphous silica particles, as it is well known that lipopolysaccharide induces high production of prosta- glandins, which lasts well after 18 h of stimulation of the inflammatory response elicited by amorphous silica in RAW 264.7 cells comes from the dimensions of the aerosil particles, which are smaller than the crys- talline ones [24]. Particle dimension is critical during macrophage particles being internalized better than larger ones and con- sequently inducing greater cellular activation [25]. In fact, increase in COX-2 expression in RAW cells was observed with an aerosil particle concentration (100 lgÆmL)1) resulting in a surface area 10 times higher than that of the same concen- tration of quartz particles (Fig. 1). In RAW 264.7 cells, AA-treated quartz particles induced higher biosynthesis of COX-2 and greater pro- duction of PGE2 than untreated particles (Figs 1 and 2). Similar results were obtained with rat alveolar macrophages freshly collected from healthy animals by BAL (Fig. 3). These results are particularly relevant because COX-2 over-expression seems to be strictly related not only to inflammation development but also
S. Scarfı` et al.
Ascorbate-treated quartz enhances COX-2 expression
In line with our in vitro results, both Johnston et al. [26] and Warheit et al. [27] reported in in vivo experi- ments a large, but transient, pulmonary inflammatory followed by a rapid response to amorphous silica, inflammatory post-exposure decrease in the principal and cytotoxic biomarkers.
more, we confirm the recruitment of NF-jB and AP-1 transcription factors into the quartz-triggered macro- phage activation pathway and provide evidence indi- cating involvement of another transcription factor, pCREB, which has already been implicated in COX-2 induction in macrophages but never associated with quartz stimulation in these cells. Finally, a causal role for H2O2-derived ROS in the mechanism by which AA-modified quartz stimulates COX-2 transcription is demonstrated.
In conclusion, the AA concentration in the lung epi- thelium may play a pivotal role in enhancing the cyto- toxic and pro-inflammatory properties of the quartz particles, instead of preventing them by means of its antioxidant properties, as currently believed.
Experimental procedures
All reagents were acquired from Sigma-Aldrich (Milan, Italy), unless otherwise stated.
quartz the by Materials
Cell cultures
The mouse macrophage cell line RAW 264.7 was obtained from the American Type Culture Collection (Rockville, MD, USA). Rat alveolar macrophages were obtained by BAL from healthy animals (see below). Cells were cultured at 37 (cid:2)C in a humidified, 5% CO2 atmosphere in Dul- becco’s modified essential medium containing 4 mm gluta- mine, supplemented with 10% defined fetal bovine serum (HyClone, Logan, UT, USA) (complete medium). Cell stimulation using different concentrations of both sterilized quartz (Min-U-Sil 5; US Silica, Berkeley Spring Plant, spe- cific surface area calculated by Brunaner, Emmett and Teller, SSABET ¼ 5.2 m2Æg)1) and Aerosil OX50 (SSABET ¼ 43.3 m2Æg)1, Degussa AG, Bitterfeld, Germany) was obtained by adding 15, 50 or 100 lgÆmL)1 particles treated with distilled water or AA (prepared as described in [9]). In detail, in terms of surface area ⁄ incubation volume, 15, 50 and 100 lgÆmL)1 Min-U-Sil quartz particles corresponded to 0.75, 2.6 and 5.2 cm2ÆmL)1, and for Aerosil OX50 they corresponded to 6.5, 21.65 and 43.3 cm2ÆmL)1, respectively. After 6 or 18 h culture, media were collected to detect PGE2 release, and cells were processed to obtain cell lysates for western blot analyses, or nuclei were separated and extracted for EMSA.
In RAW 264.7, activation of COX-2 by quartz is con- trolled by NF-jb translocation to the nucleus and also by AP-1 [11,14,28]. Indeed, nuclear translocation of NF-jB and AP-1 in RAW 264.7 cells was stimulated to a higher degree when macrophages were challenged with AA-treated, as compared with untreated, quartz parti- cles (Fig. 5). Moreover, we describe for the first time, to our knowledge, involvement of pCREB in the inflam- matory response triggered by quartz. As observed for NF-jB and AP-1, AA-treated quartz was more effective than untreated quartz in stimulating pCREB transloca- tion. Interestingly, whereas NF-jB and pCREB were activated concentration highest (100 lgÆmL)1), the AP-1 complex was activated by the lowest (15 lgÆmL)1). These data indicate that quartz can trigger different signal-transduction pathways in macrophages depending on the number of particles coming into contact with the phagocytic cells. In line with its stimulation of transcription factor translocation, AA-treated quartz induced a higher COX-2 mRNA syn- thesis than untreated crystalline silica (Fig. 4).
It is generally accepted that free-radical production by quartz is responsible for both quartz-induced toxicity and NF-jB translocation leading to macrophage activa- tion [29–32]. COX-2 production by RAW 264.7 cells sti- mulated with 15 lgÆmL)1 AA-treated quartz was indeed significantly reduced in the presence of the ROS scaven- indicating that gers catalase and mannitol (Fig. 6A), AA treatment of quartz enhances COX-2 synthesis by means of radicals derived from H2O2. A crucial role of iron in the generation of hydroxyl free radicals triggered by quartz has been reported [32]. However, the absence of inhibition of COX-2 synthesis stimulated by AA-trea- ted quartz by desferrioxamine (Fig. 6), together with our previous results demonstrating hydroxyl radical production by AA-treated quartz in the presence of H2O2, suggests that the AA-modified quartz surface has itself a specific reactivity towards H2O2, generating OH• without the need for iron [9]. If this hypothesis is cor- rect, the iron content of quartz particles may play a minor role in its radical-induced toxicity.
Male Sprague-Dawley rats (8–10 weeks) were purchased from Harlan Italy (S. Pietro al Natisone, Italy) and housed
Collection of alveolar macrophages from BAL samples
FEBS Journal 274 (2007) 60–73 ª 2006 The Authors Journal compilation ª 2006 FEBS
69
Summarizing the results obtained, our work demon- strates that, indeed, COX-2 transcription, synthesis and enzymatic activity, as assessed by PGE2 produc- tion, are significantly increased in murine and rat macrophages challenged with AA-pretreated quartz compared with untreated quartz particles. Further-
S. Scarfı` et al.
Ascorbate-treated quartz enhances COX-2 expression
committee, and all procedures
the ECL-PLUS kit (Amersham Pharmacia Biotech, Little Chalfont, Bucks, UK), according to the manufacturer’s instructions. Band detection and densitometry were per- formed using the Chemi-Doc System and the quantity one software package (Bio-Rad).
at the animal facility of the Biochemistry Section in the Department of Experimental Medicine of the University of Genoa. The program of animal use was approved by the CBA ethics involving animals were performed under protocols approved by the European Community directives.
The PGE2 concentration in the culture medium from cells incubated for 6 or 18 h with quartz particles, in the presence or absence of 100 pgÆmL)1 murine IFN-c, was quantified using the PGE2 Monoclonal EIA Kit (Cayman Chemical Company, Ann Arbor, MI, USA), according to the manufacturer’s instructions.
Three groups of four males were killed with sodium pentobarbital (100 mgÆkg)1, intraperitoneally). Then, a tra- cheal cannula was inserted, and BAL was performed using ice-cold Ca2+ ⁄ Mg+-free Hanks’ medium. Lavages of 6– 8 mL were performed until a total of 50 mL lavage fluid was collected from each rat. The samples were centrifuged at 300 g for 10 min at 4 (cid:2)C (Allegra X-22R, swinging bucket rotor, Beckman Coulter SpA, Milan, Italy).
The supernatants were removed, and the cells from the four rats were combined, resuspended in Hanks’ medium (with Ca2+ and Mg+) and centrifuged. Cells were then resuspended in complete medium, then (1–1.5) · 106 cells ⁄ well (depending on the number of cells collected from each group) were seeded on to 60 · 15 mm tissue culture dishes (Falcon Becton Dickinson, Franklin Lakes, NJ, USA), and cultured for 6 h at 37 (cid:2)C. Medium containing nonadherent cells was discarded. Then 100 lgÆmL)1 AA-treated or untreated quartz in complete medium was added to the cultures, which were further incubated for 6 h at 37 (cid:2)C. COX-2 expression and PGE2 production were quantified as described below.
Nuclear extracts
RAW 264.7 cells (3 · 106 per assay) were seeded on to 60 · 15 mm tissue culture dishes (Falcon BD) and cultured as described above. After 18 h, the medium was discarded and cells were incubated at 37 (cid:2)C with 15, 50 and 100 lgÆmL)1 AA-treated or untreated quartz for 30 min. At the end of the incubation, cells were washed 3 times with ice- cold NaCl ⁄ Pi, recovered from the dishes with a cell scraper in 1 mL NaCl ⁄ Pi, and pelleted in a microfuge at 14 000 g for 3 min at 4 (cid:2)C (MICROcentrifugette 4212, fixed angle rotor, ALC, Milan, Italy). The cell pellets were then resuspended in 400 lL ice-cold buffer A (20 mm Tris ⁄ HCl, pH 7.8; 50 mm KCl; 10 lgÆmL)1 leupeptin; 0.1 m dithiothreitol; 1 mm phe- nylmethanesulfonyl fluoride), and 400 lL buffer B (buffer A plus 1.2% Nonindet P40; Sigma) was then added. The sus- pension was vortex-mixed for 10 s, centrifuged in a Micro- fuge at 14 000 g for 30 s at 4 (cid:2)C (MICROcentrifugette 4212, fixed angle rotor, ALC), and the supernatant was discarded. The pelleted nuclei were then washed with 400 lL buffer A and centrifuged again at 14 000 g for 30 s at 4 (cid:2)C (MICRO- centrifugette 4212, fixed angle rotor, ALC). After removal of the supernatant, the nuclear pellet was resuspended in 100 lL buffer B, mixed thoroughly in ice for 15 min to disrupt nuclear membranes, sonicated for 10 s, and finally centrifuged at 14 000 g for 20 min at 4 (cid:2)C (MICROcentrifu- gette 4212, fixed angle rotor, ALC). The supernatant contain- ing the nuclear extracts was collected and the total protein content was measured [33].
Measurement of murine COX-2 expression and PGE2 production
EMSAs were performed by the method of Singh et al. [34], slightly modified. Briefly, 67 ng of the specific oligonucleo- tide (Santa Cruz) for NF-kB, AP-1 or pCREB was mixed with 5 lL Forward Reaction Buffer (Invitrogen, Carlsbad, CA, USA) and 0.5 lCi [c-32P]ATP (Amersham) in a final volume of 15 lL and preincubated at 37 (cid:2)C for 3 min. Then 10 U T4 polynucleotide kinase (Invitrogen srl, Milan, Italy) was added, and the mixture was incubated at 37 (cid:2)C for 20 min.
Expression of murine COX-2 in RAW 264.7 macrophages after 6 h incubation with 15, 50 or 100 lgÆmL)1 AA-treated or untreated quartz or aerosil was measured by western blot analysis of total cell lysates. PGE2 production was quanti- fied in the culture medium. Untreated cultures were used as controls. Briefly, 3 · 106 cells were seeded on to 60 · 15 mm tissue culture dishes (Falcon BD) and cultured as described above; after 18 h, the stimuli were added to the culture medium, and cells were further incubated for 6 h at 37 (cid:2)C. Thereafter, adherent cells were washed three times with ice-cold NaCl ⁄ Pi and lysed with 400 lL lysis buffer (100 mm dithiothreitol, 2% SDS, 10% glycerol and 50 mm Tris ⁄ HCl, adjusted to pH 6.8). The lysates were heated at 100 (cid:2)C for 10 min, sonicated, and the protein concentration was determined [33]. Identical amounts of lysate proteins (40 lg per sample) were loaded on to SDS ⁄ 10% polyacryla- mide gels, electrophoretically separated, and transferred to Immun-Blot poly(vinylidene difluoride) membranes (Bio- Rad, Milan, Italy). Membranes were blocked and cut at the level of the 50-kDa precoloured marker. The upper part was incubated with an anti-COX-2 mouse monoclonal IgG, and the lower part was stained with an anti-(b-actin) goat poly- clonal IgG, both at 1 lgÆmL)1 (Santa Cruz Biotechnology, Santa Cruz, CA, USA). Western blots were developed with
The radiolabelled oligonucleotide was then loaded and purified on a Sephadex G25 mini-column (Amersham), and
FEBS Journal 274 (2007) 60–73 ª 2006 The Authors Journal compilation ª 2006 FEBS
70
EMSA
S. Scarfı` et al.
Ascorbate-treated quartz enhances COX-2 expression
5¢-GGGTGCAGCGAACTTTATTGATGG-3¢
and mer) (reverse primer).
the elution fraction from the column centrifuged in a microfuge at 3800 g at room temperature (MICROcentri- fugette 4212, fixed angle rotor, ALC). The radioactivity of the eluted fraction was quantified with a b-Counter (Beckman Coulter Inc., Fullerton, CA, USA).
The sequences of the COX-2 (M64291) primers were: 5¢- CCAGCAAAGCCTAGAGCAAC-3¢ (forward primer) and (5¢-AGCACAAAACCAGGATCAGG-3¢) reverse primer.
To detect the PCR efficiency for each couple of primers, an amplification curve was performed, using four different dilutions of cDNA.
(Amersham)
Data analysis to detect the relative gene expression of COX-2, using the cDNA from untreated cells as calibra- tor sample, was performed with the comparative thresh- old Ct method [35] via gene expression analysis software for the iCycler iQ Real Time Detection System (Bio-Rad) [36].
The binding reaction was carried out at 25 (cid:2)C for 20 min in a final volume of 20 lL containing 10 lg nuclear extract, 0.25 lCi purified radiolabelled oligonucleotide and 0.5 lg in binding buffer (25 mm poly(dI)poly(dC) Hepes, pH 7.9; 0.5 mm EDTA; 0.5 mm dithiothreitol; 5% glycerol; 50 mm NaCl; 0.5 mm phenylmethanesulfonyl fluoride). Finally, the radiolabelled protein–DNA com- plexes were electrophoretically resolved on a 4.5% nonde- naturing polyacrylamide gel. The gel was dried on a Gel Dryer 543 (Bio-Rad), and the radioactive complexes were visualized and quantified with the Packard Cyclone Stor- age Phosphor System and optiquant acquisition and analysis software (PerkinElmer Inc., Boston, MA, USA).
Scavenger treatment
COX-2 expression in RAW 264.7 macrophages after stimu- lation with 15, 50 and 100 lgÆmL)1 AA-treated or untreated quartz was also assessed in the presence of 4000 UÆmL)1 catalase (Sigma), 50 mm mannitol (Sigma) and 2 mm desferrioxamine (Sigma). Cells were cultured as described above, and the scavengers were added together with the quartz particles for a total incubation time of 6 h. Subsequently, cells were processed for western blot analysis, as described above.
Quantitative RT-PCR
Total RNA from RAW 264.7 macrophages was extracted using Rnaeasy Mini Kit (Qiagen spa, Milan, Italy) and RNase-Free DNase Set (Qiagen) according to the manufac- from a starting material of 2 · 106 turer’s instructions, RAW 264.7 cells grown on 60 · 15 mm tissue culture dishes (Falcon BD) in the presence of 100 lgÆmL)1 quartz pretreated with distilled water or AA for 30 min, 60 min, 3 h and 18 h.
Statistical analysis
Total cell cDNA was synthesized from 1 lg RNA in the appropriate buffer containing 5 mm MgCl2, 40 U ribonuc- lease inhibitor (RNASEOUT; Invitrogen), 10 mm dithiothrei- tol, and 200 U SuperscriptTM III (Invitrogen), at 50 (cid:2)C for 50 min. Then complementary RNA was removed using 1 lL Escherichia coli RNase H (Invitrogen) at 37 (cid:2)C for 20 min.
In both Fig. 1A and 1B, data were square-root-transformed and analysed with analysis of variance, choosing P < 0.01 as basal level of significance as described by Underwood [37]. Where significant F-ratios were obtained with analysis of variance, multicomparison analyses were performed using the Tukey test.
COX-2 expression in RAW 264.7 cells (Fig. 1)
The amount of COX-2 mRNA, normalized to the relative GAPDH control, was determined by real-time quantitative PCR using a Chromo 4 instrument (MJ Research, Bio-Rad). PCR was performed in a 20-lL volume in nuclease-free water containing 10 lL 2 · master mix iQ SYBR Green(cid:3) (Bio-Rad), 0.2 lm each primer, and 0.5 lL cDNA or negat- ive control. All samples were analysed in triplicate.
In Fig. 2A, data were checked for normality and homosce- dasticity of variance with the Cochran test and analysed with analysis of variance. Where suitable, multicomparison analyses were performed using the Tukey test or Student– Newman–Keuls test; in Fig. 1B, data were log-transformed and analysed with analysis of variance. Again, where suit- able, multicomparison analyses were performed using the Tukey test or Student–Newman–Keuls test.
PGE2 production in RAW 264.7 cells (Fig. 2)
The following PCR conditions were used: 10 min initial denaturation, followed by 40 cycles with denaturation at 95 (cid:2)C for 15 s, annealing and elongation at 60 (cid:2)C for 60 s. The fluorescence was measured at the end of each elonga- tion step. The next step was slow heating (1 (cid:2)C per s) of the amplified product from 55 (cid:2)C to 92 (cid:2)C, in order to gen- erate a melting temperature curve. This curve served as a specificity control. The entire cycling process, including data analysis, was monitored using the dna engine opti- con(cid:3) 2 real-time detection system Software program (2.03 version).
In Fig. 3A, data were checked with the F-test and analysed with analysis of variance. Multicomparison analyses were performed using Student–Newman–Keuls test; in Fig. 3B,
The sequences of the GAPDH (M32599) primers were: (forward pri-
5¢-TCTCCCTCACAATTTCCATCCCAG-3¢
FEBS Journal 274 (2007) 60–73 ª 2006 The Authors Journal compilation ª 2006 FEBS
71
COX-2 expression and PGE2 production in rat alveolar macrophages (Fig. 3)
S. Scarfı` et al.
Ascorbate-treated quartz enhances COX-2 expression
data were analysed by Kruskal–Wallis analysis of variance and multicomparison analysis [38].
4 Kreyling WG (1992) Intracellular particle dissolution in alveolar macrophages. Environ Health Perspect 97, 121– 126.
5 Bavestrello A, Benatti U, Cerrano C, Cattaneo-Vietti R, Cortesogno L, Gaggero L, Giovine M, Tonetti M & Sara` M (1995) Quartz dissolution by the sponge Chon- drosia reniformis (Porifera, Demospongiae). Nature 378, 374–376.
Data were analysed with the Scheirer–Ray–Hare test and multicomparison analysis.
Time-course of COX-2 mRNA synthesis in RAW 264.7 macrophages (Fig. 4)
6 Fenoglio I, Martra G, Coluccia S & Fubini B (2000) Possible role of ascorbic acid in the oxidative damage induced by inhaled crystalline silica particles. Chem Res Toxicol 13, 971–975.
7 Gozal E, Ortiz LA, Zou X, Burow ME, Lasky JA &
Friedman M (2002) Silica-induced apoptosis in murine macrophage: involvement of tumor necrosis factor-alpha and nuclear factor-kappaB activation. Am J Respir Cell Mol Biol 27, 91–98.
8 Claudio E, Segade F, Wrobel K, Ramos S & Lazo PS
In Fig. 5A,B, data were checked with the F-test and analysed with analysis of variance and the Tukey test; the t-test was used to check differences between untreated and AA-treated quartz samples at the same concentra- tion. In Fig. 5C, data were square-root-transformed and analysed with analysis of variance and the Tukey test; the t-test was used to check differences between untreated and AA-treated quartz samples at the same concentra- tion.
(1995) Activation of murine macrophages by silica parti- cles in vitro is a process independent of silica-induced cell death. Am J Respir Cell Mol Biol 13, 547–554. 9 Giovine M, Pozzolini M, Fenoglio I, Scarfı` S, Ghiazza M, Benatti U & Fubini B (2003) Crystalline silica incu- bated in ascorbic acid acquires a higher cytotoxic poten- tial. Toxicol Ind Health 18, 249–255.
NF-jB, pCREB and AP-1 nuclear translocation in RAW 264.7 cells (Fig. 5)
10 Cao Y & Prescott SM (2002) Many actions of cyclooxy- genase-2 in cellular dynamics and in cancer. J Cell Phy- siol 190, 279–286.
In Fig. 6A–C, data were square-root-transformed and ana- lysed with analysis of variance, choosing P < 0.01 as the basal level of significance as described by Underwood [37]. Where significant F-ratios were obtained with analysis of variance, multicomparison analyses were performed using the Dunnett test.
COX-2 expression in the presence of ROS scavengers (Fig. 6)
Acknowledgements
11 Chen F, Sun S, Kuhn DC, Gaydos LJ, Shi X, Lu Y & Demers LM (1997) Involvement of NF-kappaB in silica-induced cyclooxygenase 2 gene expression in rat alveolar macrophages. Am J Physiol 272, L779–L786. 12 Zeidler PC, Roberts JR, Castranova V, Chen F, Butter- worth L, Andrew ME, Robinson VA & Porter DW (2003) Response of alveolar macrophages from indu- cible nitric oxide synthase knockout or wild-type mice to an in vitro lipopolysaccharide or silica exposure. J Toxicol Environ Health 66, 995–1013.
13 Wadleigh DJ, Reddy ST, Kopp E, Ghosh S & Hersch-
man HR (2000) Transcriptional activation of the cyclooxygenase-2 gene in endotoxin-treated RAW 264.7 macrophages. J Biol Chem 275, 6259–6266.
14 Castranova V (2004) Signaling pathways controlling the production of inflammatory mediators in response to crystalline silica exposure: role of reactive oxygen ⁄ nitro- gen species. Free Radic Biol Med 37, 916–925.
This work was partially supported by 2004 CIPE Regi- one Liguria and 2003 MURST-PRIN funds. We are deeply indebted to Professor Antonio De Flora and Professor Elena Zocchi for scientific discussion and critical reading of the manuscript. We acknowledge the Egenmann & Veronelli s.r.c. Company (Rho, Milan, Italy) for kindly providing Aerosil OX50, and the US Silica Company (Berkeley Springs, WV, USA) for pro- viding Min-U-Sil 5.
References
15 Skoza L, Snyder E & Kikkawa Y (1983) Ascorbic acid
in bronchoalveolar wash. Lung 161, 99–109.
1 Ding M, Chen F, Shi X, Yucesoy B, Mossman B &
Vallyathan V (2002) Diseases caused by silica: mecha- nisms of injury and disease development. Int Immuno- pharmacol 2, 173–182.
16 Ghio AJ, Kennedy TP, Crissman KM, Richards JH & Hatch GE (1998) Depletion of iron and ascorbate in rodents diminishes lung injury after silica. Exp Lung Res 24, 219–232.
2 Fubini B (1998) Surface chemistry and quartz hazard.
17 Titkova VA (1967) Effect of novocaine and vitamin C
Ann Occup Hyg 42, 521–530.
3 Donaldson K & Borm PJ (1998) The quartz hazard: a
on the fibrogenic action of quartz dust. Arch Pathol 29, 71–76.
variable entity. Ann Occup Hyg 42, 287–294.
FEBS Journal 274 (2007) 60–73 ª 2006 The Authors Journal compilation ª 2006 FEBS
72
S. Scarfı` et al.
Ascorbate-treated quartz enhances COX-2 expression
18 Chen F, Sun SC, Kuh DC, Gaydos LJ & Demers LM (1995) Essential role of NF-jb activation in silica- induced inflammatory mediator production in macro- phages. Biochem Biophys Res Commun 214, 985–992. 19 Chen F, Kuh DC, Sun SC, Gaydos LJ & Demers LM
29 Shi XL, Dalal NS & Vallyathan V (1988) ESR evidence for the hydroxyl radical formation in aqueous suspen- sion of quartz particles and its possible significance to lipid peroxidation in silicosis. J Toxicol Environ Health 25, 237–245.
(1995) Dependence and reversal nitric oxide production on NF-jb in silica and lipopolysaccharide-induced macrophages. Biochem Biophys Res Commun 214, 839–846.
30 Vallyathan V, Shi XL, Dalal NS, Irr W & Castranova V (1988) Generation of free radicals from freshly frac- tured silica dust. Potential role in acute silica-induced lung injury. Am Rev Respir Dis 138, 1213–1219.
20 Barrett EG, Johnston C, Oberdorster G & Finkelstein JN (1999) Antioxidant treatment attenuates cytokine and chemokine levels in murine macrophages following silica exposure. Toxicol Appl Pharmacol 158, 211–220. 21 Hinz B & Brune K (2002) Cyclooxygenase-2 10 years
31 Shi X, Dong Z, Huang C, Ma W, Liu KYeJ, Chen F, Leonard SS, Ding M, Castranova V & Vallyathan V (1999) The role of hydroxyl radical as a messenger in the activation of nuclear transcription factor NF-kap- paB. Mol Cell Biochem 194, 63–70.
later. J Pharmacol Exp Ther 300, 367–375.
22 Brown JR & DuBois RN (2004) Cyclooxygenase as a
32 Rojanasakul YYeJ, Chen F, Wang L, Cheng N, Castra- nova V, Vallyathan V & Shi X (1999) Dependence of NF-kappaB activation and free radical generation on silica-induced TNF-alpha production in macrophages. Mol Cell Biochem 200, 119–125.
target in lung cancer. Clin Cancer Res 10, 4266s–4269s. 23 Riese J, Hoff T, Nordhoff A, DeWitt DL, Resch K & Kaever V (1994) Transient expression of prostglandin endoperoxide synthase-2 during mouse macrophage acti- vation. J Leukoc Biol 55, 476–482.
33 Bradford MM (1976) A rapid and sensitive method for the quantitation of microgram quantities of protein util- izing the principle of protein-dye binding. Anal Biochem 72, 248–254.
34 Singh IS, He JR, Calderwood S & Hasday JD (2002)
A high affinity HSF-1 binding site in the 5¢-untranslated region of the murine tumor necrosis factor-a gene is a transcriptional repressor. J Biol Chem 277, 4981–4988.
24 Elias Z, Poirot O, Daniere MC, Terzetti F, Marande AM, Dzwigaj S, Pezerat H, Fenoglio I & Fubini B (2000) Cytotoxic and transforming effects of silica parti- cles with different surface properties in Syrian hamster embryo (SHE) cells. Toxicol In Vitro 14, 409–422. 25 Santini MT, Rainaldi G, Ferrante A, Romano R, Cle- mente S, Motta A, De Berardis B, Balduzzi M, Paoletti L & Indovina PL (2004) Environmental fine particulate matter (PM 2.5) activates the RAW 264.7 macrophage cell line even at very low concentrations as revealed by 1H NMR. Chem Res Toxicol 17, 63–74.
35 Aarskog NK & Vedeler CA (2000) Real-time quanti- tative polymerase chain reaction. A new method that detects both the peripheral myelin protein 22 duplica- tion in Charcot-Marie-Tooth type 1A disease and the peripheral myelin protein 22 deletion in hereditary neuropathy with liability to pressure palsies. Hum Genet 107, 494–498.
26 Johnston CJ, Driscoll KE, Finkelstein JN, Baggs R, O’Reilly MA, Carter J, Gelein R & Oberdorster G (2000) Pulmonary chemokine and mutagenic responses in rats after subchronic inhalation of amorphous and crystalline silica. Tox Sci 56, 405–413.
36 Vandesompele J, De Preter K, Poppe B, Van Roy N, De Paepe A & Speleman F (2002) Accurate normali- zation of real-time quantitative RT-PCR data by geometric averaging of multiple internal control genes. Genome Biol 3, 0034.1–0034.12.
37 Underwood AJ (1981) Techniques of analysis of vari-
27 Warheit DB, McHugh TA & Hartsky MA (1995) Dif- ferential pulmonary responses in rats inhaling crystal- line, colloidal or amorphous silica dusts. Scand J Work Environ Health 21, 19–21.
ance in experimental marine biology and ecology. Annu Rev Oceanogr Mar Biology 19, 513–605.
38 Siegel S & Castellan NJ (1988) Nonparametric Statistics for the Behavioural Sciences, 2nd edn. McGraw-Hill, New York, NY.
28 Ding M, Shi X, Dong Z, Chen F, Lu Y, Castranova V & Vallyathan V (1999) Freshly fractured crystalline silica induces activator protein-1 activation through ERKs and p38 MAPK. J Biol Chem 274, 30611– 30616.
FEBS Journal 274 (2007) 60–73 ª 2006 The Authors Journal compilation ª 2006 FEBS
73