RESEA R C H Open Access
miR-17-92 expression in differentiated
T cells - implications for cancer immunotherapy
Kotaro Sasaki
1,2†
, Gary Kohanbash
5,6†
, Aki Hoji
3,5
, Ryo Ueda
3,5
, Heather A McDonald
5
, Todd A Reinhart
6
,
Jeremy Martinson
6
, Michael T Lotze
4
, Francesco M Marincola
7
, Ena Wang
7
, Mitsugu Fujita
3,5
, Hideho Okada
2,3,4,5*
Abstract
Background: Type-1 T cells are critical for effective anti-tumor immune responses. The recently discovered
microRNAs (miRs) are a large family of small regulatory RNAs that control diverse aspects of cell function, including
immune regulation. We identified miRs differentially regulated between type-1 and type-2 T cells, and determined
how the expression of such miRs is regulated.
Methods: We performed miR microarray analyses on in vitro differentiated murine T helper type-1 (Th1) and T
helper type-2 (Th2) cells to identify differentially expressed miRs. We used quantitative RT-PCR to confirm the
differential expression levels. We also used WST-1, ELISA, and flow cytometry to evaluate the survival, function and
phenotype of cells, respectively. We employed mice transgenic for the identified miRs to determine the biological
impact of miR-17-92 expression in T cells.
Results: Our initial miR microarray analyses revealed that the miR-17-92 cluster is one of the most significantly
over-expressed miR in murine Th1 cells when compared with Th2 cells. RT-PCR confirmed that the miR-17-92
cluster expression was consistently higher in Th1 cells than Th2 cells. Disruption of the IL-4 signaling through either
IL-4 neutralizing antibody or knockout of signal transducer and activator of transcription (STAT)6 reversed the miR-
17-92 cluster suppression in Th2 cells. Furthermore, T cells from tumor bearing mice and glioma patients had
decreased levels of miR-17-92 when compared with cells from non-tumor bearing counterparts. CD4
+
T cells
derived from miR-17-92 transgenic mice demonstrated superior type-1 phenotype with increased IFN-gproduction
and very late antigen (VLA)-4 expression when compared with counterparts derived from wild type mice. Human
Jurkat T cells ectopically expressing increased levels of miR-17-92 cluster members demonstrated increased IL-2
production and resistance to activation-induced cell death (AICD).
Conclusion: The type-2-skewing tumor microenvironment induces the down-regulation of miR-17-92 expression in
T cells, thereby diminishing the persistence of tumor-specific T cells and tumor control. Genetic engineering of T
cells to express miR-17-92 may represent a promising approach for cancer immunotherapy.
Background
We have focused on the development of effective immu-
notherapeutic strategies for central nervous system
(CNS) tumors, such as glioblastoma multiforme (GBM).
Preclinical studies have demonstrated that tumor-speci-
fic T helper type-1 (Th1) and T cytotoxic type-1 (Tc1)
cells, but not type-2 counterparts, can efficiently traffic
into CNS tumor sites and mediate effective therapeutic
efficacy, recruited via the type-1 chemokine CXCL10
[1-3] and the integrin receptor, Very Late Antigen
(VLA)-4 [4-7]. Despite the importance of the type-1 T
cell response, cancers, including GBMs, secrete numer-
ous type-2 cytokines [8-10] that promote tumor prolif-
eration [11,12] and immune escape [13]. Hence, the
strategic skewing of existing type-2 to type-1 immunity
in glioma patients may be critical for the development
of more effective immunotherapy.
MicroRNAs (miRs) are a novel class of endogenous
small single-stranded RNA molecules which are 18-24
nucleotides in length [14]. Mature miRs repress mRNA
encoded protein translation and are highly conserved
between species, including viruses, plants and animals
* Correspondence: okadah@upmc.edu
†Contributed equally
2
Department of Immunology, University of Pittsburgh School of Medicine,
200 Lothrop Street, Pittsburgh, PA, 15213, USA
Sasaki et al.Journal of Translational Medicine 2010, 8:17
http://www.translational-medicine.com/content/8/1/17
© 2010 Sasaki et al; licensee BioMed Central Ltd. This is an Open Access article distributed under the terms of the Creative Commons
Attribution License (http://creativecommons.org/licenses/by/2.0), which permits unrestricted use, distribution, and reproduction in
any medium, provided the original work is properly cited.

[15]. There are over 700 miRs identified in the human
genome that collectively are predicted to regulate two-
thirds of all mRNA transcripts [14]. Findings over the
past several years strongly support a role for miRs in
the regulation of crucial biological processes, such as:
cellular proliferation [16], apoptosis [17], development
[18], differentiation [19], metabolism [20], and immune
regulation [21,22]. We recently reported that miR-222
and -339 in cancer cells down-regulate the expression of
an intercellular cell adhesion molecule (ICAM)-1,
thereby regulating the susceptibility of cancer cells to
cytotoxic T lymphocytes (CTLs) [23]. This is among the
first reports to demonstrate the role of miR in cancer
immunosurveillance.
In the current study, in an effort to understand the
potential roles of miRs in anti-tumor immunity, we
examined miRs differentially expressed in Th1 and Th2
cells. Our miR microarray and RT-PCR analyses revealed
that of all analyzed miRs, members of the miR-17-92
cluster (miR-17-92) are of the most significantly over-
expressed miRs in murine Th1 cells when compared with
Th2 cells. The miR-17-92 transcript encoded by mouse
chromosome14 (and human chromosome 13) is the pre-
cursor for 7 mature miRs (miR-17-5p, miR-17-3p, miR-
18a, miR-19a, miR-20a, miR-19b and miR-92) [24,25].
This cluster is also homologous to the miR-106a-363
cluster on the X chromosome and the miR-106b-25 clus-
ter on chromosome 5. Together, these three clusters con-
tain 15 miR stem-loops, giving rise to 14 distinct mature
miRs that fall into 5 miR families. The members in each
family have identical seed regions. This genomic organi-
zation is highly conserved in all vertebrates for which
complete genome sequences are available [26].
miRs in the miR-17-92 cluster are amplified in various
tumor types, including B cell lymphoma and lung cancer,
and promote proliferation and confer anti-apoptotic func-
tion in tumors, thereby promoting tumor-progression
[27-31]. Knockout and transgenic studies of the miR-17-
92 cluster in mice have demonstrated the importance of
this cluster in mammalian biology [25]. Transgenic mice
with miR-17-92 overexpressed in lymphocytes develop
lymphoproliferative disorder and autoimmunity but not
cancer [24]. These findings demonstrate a critical role for
miR-17-92 cluster in T cell biology.
We show here that miR-17-92 is up-regulated in Th1
cells when compared with Th2 cells. IL-4 and STAT6
signaling mediate the down-regulation of miR-17-92.
Tumor-bearing host conditions also suppress the miR-
17-92 cluster expression in T cells, which is associated
with a loss in ability to produce IFN-g. This led us to
hypothesize that miR-17-92 cluster overexpression
might enhance type-1 responses. Indeed, type-1 T cells
derived from miR-17-92 transgenic mice demonstrated a
more pronounced type 1 phenotype including enhanced
IFN-gproduction and increased VLA-4 expression when
compared with control type-1 T cells. These findings
suggest that miR-17-92 plays a critical role in type-1
adaptive immunity.
Materials and methods
Reagents
RPMI 1640, FBS, L-glutamine, sodium pyruvate, 2-mer-
captoethanol, nonessential amino acids, and penicillin/
streptomycin were obtained from Invitrogen Life Tech-
nologies. Recombinant murine (rm) IL-12 was pur-
chased from Cell Sciences Technologies. RmIL-4,
recombinant human (rh) IL-4 and rhIL-2 were pur-
chased from PeproTech. Purified monoclonal antibodies
(mAbs) against IL-12 (C15.6), IFN-g(R4-6A2), IL-4
(11B11), CD3 (145-2C11), CD4 (RM4-5), CD8 (53-6.7)
and CD49d (R1-2) were all purchased from BD Phar-
mingen. Purified mAbs against CD3 (UCHT1) and
CD28 (CD28.2) and IL-4 (MP4-25D2) were purchased
from Biolegend. RT-PCR reagents and primers were
purchased from Applied Biosystems and analyzed on a
BioRad IQ5. WST-1 reagent was purchased from Roche.
For isolation of T cells, immunomagenic isolation kits
from Miltenyi Biotec were used. All reagents and vectors
for lentiviral production were purchased from System
Biosciences with the exception of Lipofectamine 2000,
which was from Invitrogen.
Mice
C57BL/6 mice and C57BL/6 background STAT6 defi-
cient mice (B6.129S2 [C]-Stat6
tm1Gru
/J; The Jackson lab)
(both 5-9 wk of age) were purchased from The Jackson
Laboratory. C57BL/6-background miR-17-92 transgenic
(TG) mice (C57BL/6-Gt [ROSA]26Sor
tm3(CAG-MIRN17-92,-
EGFP)Rsky
/J; The Jackson Lab) were maintained in the
Hillman Cancer Center Animal Facility at University of
Pittsburgh as breeding colonies and bred to C57BL/6-
background mice transgenic for Cre recombinase gene
under the control of the Lck promoter (B6.Cg-Tg [Lck-
cre]548Jxm/J, the Jackson Lab) to obtain mice, in which
T cells expressed miR-17-92 at high levels (miR-17-92
TG/TG). For mouse tumor experiments, C57BL/6 mice
and C57BL/6 background STAT6
-/-
mice received sub-
cutaneous injection of 1 × 10
6
B16 tumor cells resus-
pended in PBS into the right flank. On day 15 following
tumor inoculation, mice were sacrificed and splenic T
cells were isolated. Animals were handled in the Hill-
man Cancer Center Animal Facility at University of
Pittsburgh per an Institutional Animal Care and Use
Committee-approved protocol.
T cells from Healthy Donors and Patients with GBM
This study was approved by the local ethical review board
of University of Pittsburgh. All healthy donors and
Sasaki et al.Journal of Translational Medicine 2010, 8:17
http://www.translational-medicine.com/content/8/1/17
Page 2 of 12

patients with GBM signed informed consent before blood
samples were obtained. To determine the impact of IL-4,
healthy donor-derived CD4
+
T cells were isolated with
immunomagentic-seperation and stimulated with 100 IU/
ml rhIL-2, anti-CD3 and anti-CD28 mAbs (1 μg/ml for
each) in the presence or absence of rhIL-4(10 ng/ml). RT-
PCR analyses were performed with both healthy donor-
and patient-derived T cells to determine the expression of
miR-17-92 as described in the relevant section.
Th1 and Th2 Cell Culture
Th1 and Th2 cells were differentiated from immuno-
magnetically-separated CD4
+
splenic T cells. Magnetic
activated cell separation (MACS) was carried out using
positive selection. Briefly, spleens were minced in com-
plete media, resuspended in red blood cell lysis buffer
and stained with immunomagnetically labeled anti-CD4
antibody. Cells were then washed and placed through
the magnetic column in 500 μl of MACS buffer. The
column was then washed 3 times with buffer and then
removed from the magnet and labeled cells were
extracted in 3 ml of MACS buffer.
For differentiation of T cells, purified CD4
+
cells were
stimulated in 48 well plates with anti-CD3 mAb (5 μg/
ml) in the presence of irradiated C57BL/6 spleen cells
(3000 Rad) as feeder cells. RmIL-12 (4 ng/ml), rmIFN-g
(4 ng/ml), anti-IL-4 (10 μg/ml) mAb and rhIL-2 (100
IU/ml) were added for Th1 development. Th2 cells were
generated from the same CD4
+
cell precursors stimu-
lated with anti-CD3 mAb and feeder cells in the pre-
sence of rmIL-4 (50 ng/ml), two anti-IFN-gmAbs (10
μg/ml), anti-IL-12 mAb (10 μg/ml) and rhIL-2 (100 IU/
mL). After 10 days cells were stained for IL-4 and IFN-g
to confirm differentiation. Neutral cell culture included
anti-CD3, feeder cells and rhIL-2. For studies involving
IL-4 blockade, 12.5 ng/ml anti-human IL-4 mAb (Biole-
gend) was used in human experiments and 2.5 μg/ml
anti-mouse IL-4 mAb (11B11) in murine studies. IFN-g
and IL-4 in the culture supernatants were measured
using specific ELISA kits (R&D Systems). For FACs ana-
lysis, cells were incubated with mAb at 4°C for 30 min,
washed twice in staining buffer, and fixed in 500 μlof
2% paraformaldehyde in PBS. Cells were stored in the
dark at 4°C until analysis. Flow cytometry was carried
out on the Coulter XL four-color flow cytometer at the
flow cytometry core facility of the University of Pitts-
burgh Cancer Institute.
miR Microarray
Total RNA was isolated from Th1 and Th2 cells using
the Trizol reagent and quality was confirmed with an
A260/A280 ratio greater than 1.85. Two μgoftotal
RNA was labeled with either Hy5 (red; Th1) or Hy3
(green; Th2) fluorescent dyes using miRCURY LNA
microRNA labeling kit (Exiqon, Woburn, MA) accord-
ing to manufacturer’s protocol. Labeled miR samples in
duplicate were cohybridized on to miR array slides, a
custom spotted miR array V4P4 containing duplicated
713 human, mammalian and viral mature antisense
microRNA species (miRBase: http://microrna.sanger.ac.
uk/, version 9.1) plus 2 internal controls with 7 serial
dilutions printed in house (Immunogenetics Laboratory,
Department of Transfusion Medicine, Clinical Center,
National Institutes of Health) [32]. After washing, raw
intensity data were obtained by scanning the chips with
GenePix scanner Pro 4.0 and were normalized by med-
ian over entire array. Differentially expressed miRs were
definedbymean(n=2)foldchange(Th1/Th2signal
intensity) >2.
Quantitative RT-PCR
Total RNA was extracted using the Qiagen RNeasy kit
and quality was confirmed with a A260/A280 ration
greater than 1.85. RNA was subjected to RT-PCR analy-
sis using the TaqMan microRNA Reverse Transcription
Kit, microRNA Assays (Applied Biosystems), and the
Real-Time thermocycler iQ5 (Bio-Rad). The small
nucleolar SNO202 was used as the housekeeping small
RNA reference gene for all murine samples and RNU43
for human samples. All reactions were done in triplicate
and relative expression of RNAs was calculated using
the ∆∆C
T
method [33].
WST-1 Proliferation Assay
For WST-1 proliferation assays, 1 × 10
4
cells were cul-
tured in a 96 well plate for 24-48 hours in 100 μlof
complete media. Then, 10 μl of WST-1 reagent was
added to each well. Cells were incubated at 37°C, 5%
CO
2
for 4 hours, and placed on a shaker for 1 min. The
plates were then read on a micro plate reader with a
wavelength of 420 nm and a reference at 620 nm.
Assays using Jurkat lymphoma cells transduced with
miR-17-92
Jurkat human T cell leukemia cells (American Type
Culture Collection) were transduced by either one of
the following pseudotype lentiviral vectors: 1) control
vector encoding GFP; 2) the 17-92-1 expression vector
encoding miR-17 18 and 19a, or 3) the 17-92-2 expres-
sion vector encoding miR 20, 19b-1, and 92a-1. All vec-
tors were purchased from SBI. Lentiviral particles were
produced by co-transfecting confluent 293TN cells (SBI)
with pPACK-H1 Lentivirus Packaging Kit (SBI) and the
miR containing expression vectors (SBI) noted above
using Lipofectamine 2000 reagent (Invitrogen). Superna-
tant was collected after 48 hour incubation at 37°C with
5% CO
2
and placed at 4°C with PEG-it Virus Concen-
tration Solution (SBI) for 24 hrs. Supernatants/PEG
Sasaki et al.Journal of Translational Medicine 2010, 8:17
http://www.translational-medicine.com/content/8/1/17
Page 3 of 12
solutions were then centrifuged and the pellet was
resuspended in a reduced volume of media as viral
stock. Jurkat cells were further resuspended in the viral
stock together with polybrene (8 μg/ml) for 24 hrs.
Fresh media was then added to the cells and transduc-
tion efficiency was evaluated by GFP expressing cells.
For IL-2 production, transduced Jurkat cells were stimu-
lated with Phorbol 12-myristate 13-acetate (PMA) (10
ng/ml) and ionomycin (500 nM) for overnight and
supernatant was assayed for IL-2 by a human IL-2
ELIZA kit. For activation induced cell death (AICD),
cells were treated with 10 μg/ml purified anti-CD3 mAb
(UCHT1) from Biolegend for 24 hours and then cell via-
bility was measured using WST-1 reagent.
Statistical Methods
All statistical analyses were carried out on Graphpad
Prism software. The statistical significance of differences
between groups was determined using student t- test.
We considered differences significant when p< 0.05. A
post test for linear trend test was used to determine lin-
ear trend and we considered p< 0.05 to be significant.
Results
miR-17-92 and its paralogs are overexpressed in Th1 cells
compared with Th2 cells
To identify differentially expressed miRs between Th1
and Th2 cells, we performed a miR microarray analysis.
From mouse splenic CD4
+
T cells, Th1 and Th2 cells
were generated as described in Materials and Methods.
These T cells exhibited expected cytokine profiles with
Th1 cells dominantly producing IFN-gbut not IL-4,
while Th2 cells produce mostly IL-4 (Fig. 1A). Total
RNA was extracted from these T cells, and analyzed for
differential miR expression by miR microarray for 714
miRs (Fig. 1B). Hierarchical clustering of differentially
expressed miRs revealed distinct miR expression profiles
between the Th1 and Th2 cells. Eleven of the miRs
from the miR-17-92 cluster and its paralogs were
expressed at higher levels in Th1 cells than in Th2 cells.
Next, we ranked the miRs preferentially expressed in
Th1 cells according to the fold difference of expression
when compared with Th2 cells (Fig. 1C). Interestingly,
members of miRs in the miR-17-92 clusters were identi-
fied as the most differentially expressed of all miRs in
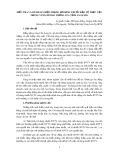
Figure 1 Microarray analysis demonstrates up-regulation of miR-17-92 in Th1 cells.(A), Intracellular IFN-gvs. IL-4 expression of Th1 and
Th2 cells induced from mouse CD4
+
splenic T cells in vitro.(B), Differentially expressed miRs were analyzed by hierarchical clustering of the log2
value of Th1/Th2 pair of miR microarray signal. Red indicates up-regulation in Th1; green, up-regulation in Th2. (C), miRs were ranked by relative
fold expression in Th1/Th2 cells. Arrows indicate members of the miR-17-92 cluster or paralog clusters. miRs with a relative expression of >2.35
fold in Th1 are shown. (B and C), hsa- and mmu- indicate human and mouse miR probes, respectively. Hsa-probes can hybridize with most
mouse miR due to the high homology and mmu-signals are shown only when murine miR has unique sequence compared to its human
counterpart. (D), Ideogram of mouse chromosome 14 showing the location and order of the miR-17-92 cluster (adapted from NCBI Blast).
Sasaki et al.Journal of Translational Medicine 2010, 8:17
http://www.translational-medicine.com/content/8/1/17
Page 4 of 12
Th1 cells compared to Th2 cells. Since miR-17-92 clus-
ters appear to be transcribed as single polycistronic
transcripts (Fig. 1D), we expected that all the miRs from
the miR-17-92 cluster would be consistently expressed
at higher levels in Th1 cells than in Th2 cells, which
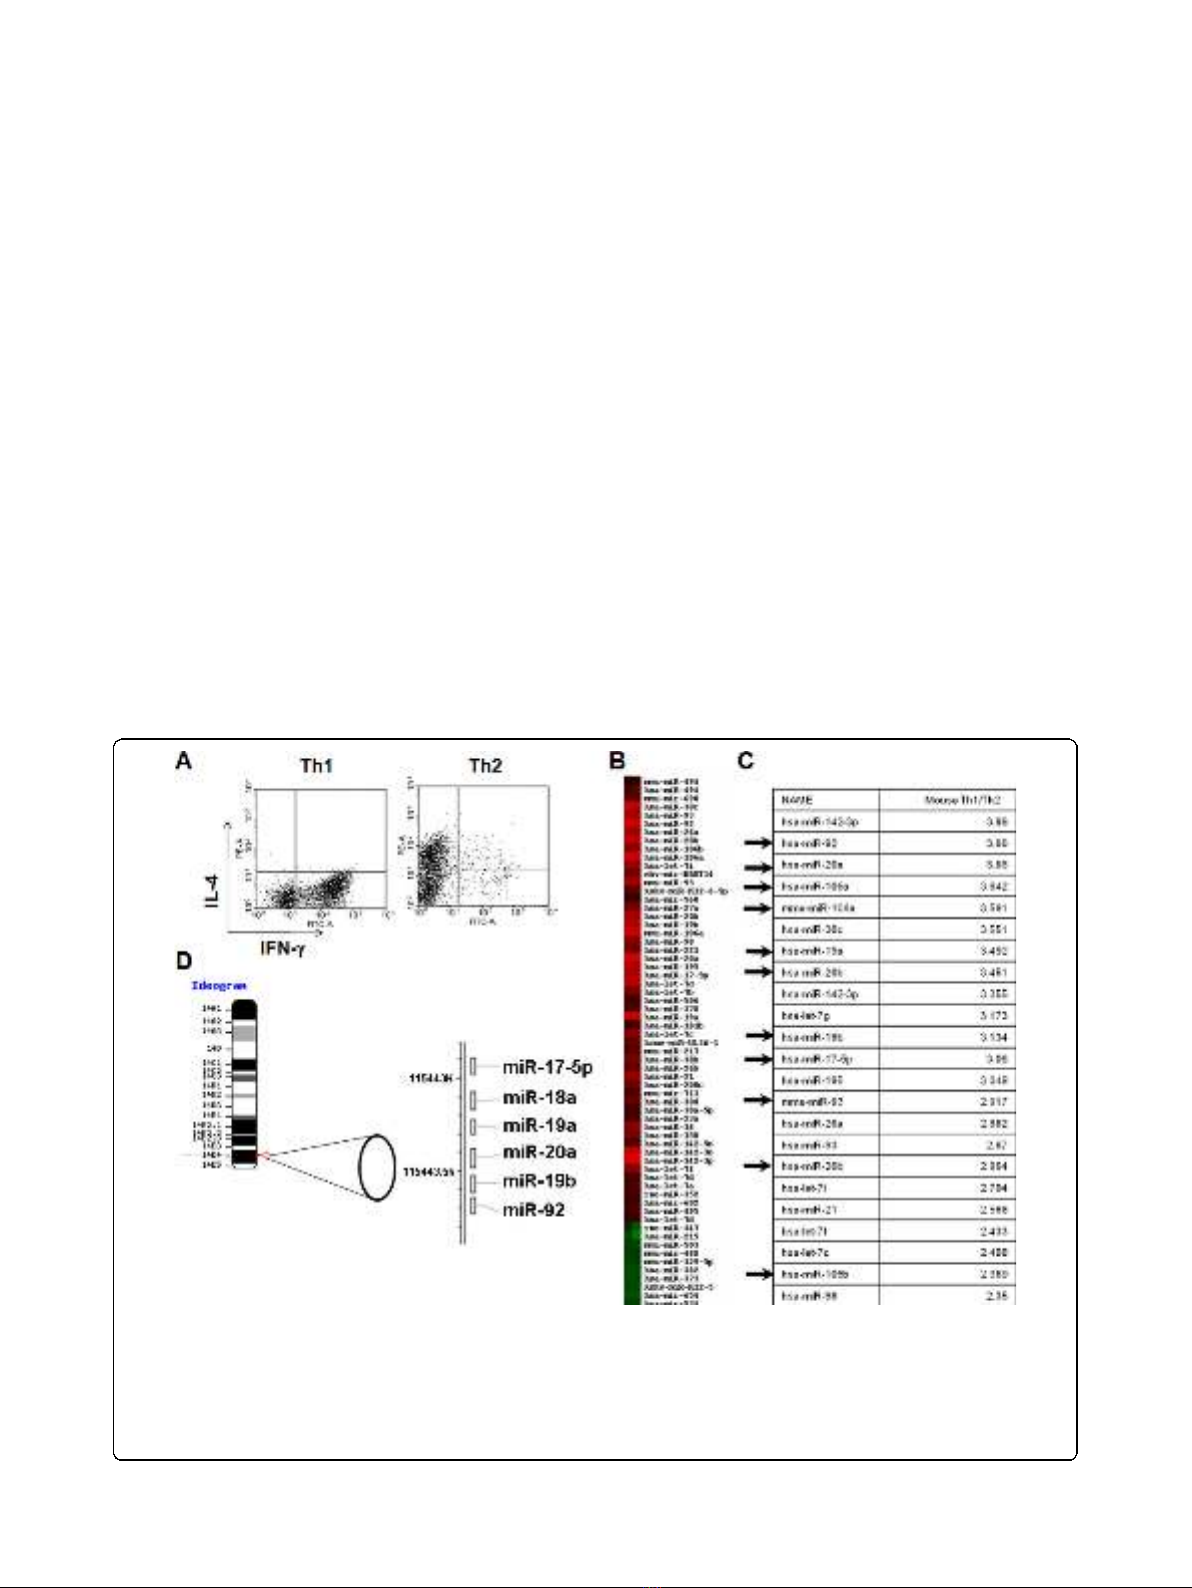
was confirmed by RT-PCR analysis (Fig. 2A).
The miR-17-92 cluster has 2 paralog clusters: miR-
106a-363 and miR-106b-25. These paralog clusters tar-
get similar mRNAs as the miR-17-92 cluster due to high
sequence homology [34]. To establish if these paralog
miR clusters are also overexpressed in our Th1 vs. Th2
cells, we next performed RT-PCR for miRs in each of
these clusters. Representative for these paralog clusters
are miR-106a and miR106b (Fig. 2B). These data
demonstrate that the paralog clusters of miRs were also
up-regulated in Th1 cells over Th2.
Neutralization of endogenous IL-4 up-regulates miR-17-92
cluster miRs in T-cells
In order to identify factors that contribute to the differ-
ential expression of miR-17-92 cluster miRs between
Th1 and Th2 cells, we next sought to determine
whether a prototypical type-2 inducing cytokine, IL-4,
would affect miR-17-92 expression in CD4
+
T cells.
Neutralization of endogenous IL-4 by specific mAb
against IL-4 up-regulated miR-17-92 cluster miRs in
CD4
+
T cells stimulated with IL-2 without addition of
Th1-inducing factors IL-12 or IFN-g, by approximately
50% (Fig. 3A). The anti-IL-4 mAb also up-regulated
miR-17-92 in Th2 culture conditions as well (data not
shown). To determine whether there is an IL-4 dose-
dependent suppression of miR-17-92 cluster, we next
treated CD4
+
T cells with increasing doses of IL-4 at 0,
10, 50 or 100 ng/ml and measured miR-17-5p expres-
sion by RT-PCR (Fig. 3B). miR-17-92 suppression was a
dose-dependent phenomenon.
Up-regulated miR-17-92 expression in STAT6 deficient
T cells
To further elucidate the effect of IL-4 signaling on miR-
17-92 cluster expression, we next cultured CD4
+
T cells
under Th1 or Th2 skewing conditions from mice deficient
Figure 2 Enhanced expression of miRs from the miR-17-92 cluster in Th1 cells. Data represent relative expression of mature miRs in Th1
compared with Th2 cells. SNO202 was used as the internal control and ∆∆C
T
method was used to examine expression relative to the Th2 cell
value. Relative expression is shown for (A), miR-17-92 cluster members or (B), representative paralog cluster members, miR-106a and -106b. Error
Bars indicate standard deviation of the triplicate samples. Each experiment was repeated at least 3 times. Up-regulation in Th1 vs. Th2 is
significant in (A) with p < .01 for miR-92 and p < .0001 for all other miRs and in (B), with p < .001 for miR-106a and p < .05 for miR106b using
the student t test.
Sasaki et al.Journal of Translational Medicine 2010, 8:17
http://www.translational-medicine.com/content/8/1/17
Page 5 of 12


![Vaccine và ứng dụng: Bài tiểu luận [chuẩn SEO]](https://cdn.tailieu.vn/images/document/thumbnail/2016/20160519/3008140018/135x160/652005293.jpg)