Topology, tinkering and evolution of the human transcription factor network Carlos Rodriguez-Caso1,2, Miguel A. Medina2 and Ricard V. Sole´ 1,3
1 ICREA-Complex Systems Laboratory, Universitat Pompeu Fabra, Barcelona, Spain 2 Department of Molecular Biology and Biochemistry, Faculty of Sciences, Universidad de Ma´laga, Spain 3 Santa Fe Institute, Santa Fe, New Mexico, USA
Keywords human; molecular evolution; protein interaction; tinkering; transcription factor network
Correspondence Ricard V. Sole´ , ICREA - Complex System Laboratory, Universitat Pompeu Fabra, Dr Aiguader 80, 08003 Barcelona, Spain Fax: +34 93 221 3237 Tel: +34 93 542 2821 E-mail: ricard.sole@upf.edu
(Received 5 August 2005, revised 25 October 2005, accepted 31 October 2005)
doi:10.1111/j.1742-4658.2005.05041.x
Patterns of protein interactions are organized around complex heterogene- ous networks. Their architecture has been suggested to be of relevance in understanding the interactome and its functional organization, which per- vades cellular robustness. Transcription factors are particularly relevant in this context, given their central role in gene regulation. Here we present the first topological study of the human protein–protein interacting transcrip- tion factor network built using the TRANSFAC database. We show that the network exhibits scale-free and small-world properties with a hierarchi- cal and modular structure, which is built around a small number of key proteins. Most of these proteins are associated with proliferative diseases and are typically not linked to each other, thus reducing the propagation of failures through compartmentalization. Network modularity is consistent with common structural and functional features and the features are gener- ated by two distinct evolutionary strategies: amplification and shuffling of interacting domains through tinkering and acquisition of specific interact- ing regions. The function of the regulatory complexes may have played an active role in choosing one of them.
Early
topological
studies of
Living cells are composed of a large number of differ- ent molecules interacting with each other to yield com- plex spatial and temporal patterns. Unfortunately, this reality is seldom captured by traditional and molecular biology approaches. A shift from molecular to modular biology seems unavoidable [1] as biological systems are defined by complex networks of interacting compo- nents. Such networks show high heterogeneity and are typically modular and hierarchical [2,3]. Genome-wide gene expression and protein analyses provide new, powerful tools for the study of such complex biological phenomena [4–6] and new, more integrative views are required to properly interpret them [7]. Such an inte- grative approach is obtained by mapping molecular interactions into a network, as is the case for metabolic and signalling pathways. In this context, biological databases provide a unique opportunity to characterize biological networks under a systems perspective.
cellular networks revealed that genomic, proteomic and metabolic maps share characteristic features with other real-world networks [8–12]. Protein networks, also called inter- actomes, were studied thanks to a massive two-hybrid system screening in unicellular Saccharomyces cerevisiae [9] and, more recently, in Drosophila melanogaster [13] and Caenorhabditis elegans [10]. The networks have a nontrivial organization that departs strongly from sim- ple, random homogeneous metaphors [2]. The network structure involves a nested hierarchy of levels, from large-scale features to modules and motifs [1,14]. This is particularly true for protein interaction maps and gene regulatory nets, which different evolutionary for- ces from convergent evolution [15] to dynamical con- straints [16,17] have helped shape. In this context, protein–protein interactions play an essential role in regulation, signalling and gene expression because they
Abbreviations ER, Erdo¨ s-Re´ nyi; HTFN, human transcription factor network; SF, scale free; SW, small world; TF, transcription factor.
FEBS Journal 272 (2005) 6423–6434 ª 2005 The Authors Journal compilation ª 2005 FEBS
6423
C. Rodriguez-Caso et al.
Human transcription factor network topology
allow the formation of supramolecular activator or inhibitory complexes, depending on their components and possible combinations.
Transcription factors (TFs) are an essential subset of interacting proteins responsible for the control of gene expression. They interact with DNA regions and tend to form transcriptional regulatory complexes. Thus, the final effect of one of these complexes is determined by its TF composition.
the same structural
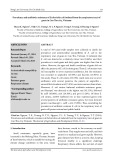
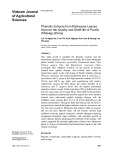
Fig. 1. Human transcription factor network built from data extracted from the TRANSFAC 8.2 database. Numbered black filled nodes are the highest connected transcription factors. 1, TATA-binding protein (TBP); 2, p53; 3, p300; 4, retinoid X receptor a (RXRa); 5, retinoblastoma protein (pRB); 6, nuclear factor NFjB p65 subunit (RelA); 7, c-jun; 8, c-myc; 9, c-fos.
The number of TFs varies among organisms, although it appears to be linked to the organism’s complexity. Around 200–300 TFs are predicted for [18] and Saccharomyces [19,20]. By Escherichia coli contrast, comparative analysis in multicellular organ- isms shows that the predicted number of TFs reaches 600–820 in C. elegans and D. melanogaster [20,21], and 1500–1800 in Arabidopsis (1200 cloned sequences) [20–22]. For humans, around 1500 TFs have been documented [21] and it is estimated that there are 2000–3000 [21,23]. Such an increase in the number of TFs is associated with higher control of gene regula- tion [24]. Interestingly, such an increase is based on the use of types of proteins. Human transcription factors are predominantly Zn fin- gers, followed by homeobox and basic helix–loop–helix [21]. Phylogenetic studies have shown that the amplifi- cation and shuffling of protein domains determine the growth of certain transcription factor families [25–28]. Here, a domain can be defined as a protein sub- structure that can fold independently into a compact structure. Different domains of a protein are often associated with different functions [29,30].
When dealing with TF networks, several relevant questions arise. How are these factors distributed and related through the network structure? How important has the protein domain universe been in shaping the network? Analysis of global patterns of network organization is required to answer these questions.
filtering according to criteria given in Experimental Procedures, a graph of N ¼ 230 interacting human TFs was obtained (Fig. 1). This can be understood as the architecture of the regulatory backbone. It pro- vides a topological view of the interaction patterns among the elements responsible for gene expression. This corresponds to the protein hardware that carries out genomic instructions. The remaining TFs con- tained in the database did not form subgraphs and appeared isolated. The relatively small size of the con- nected graph compared with all the entries in the data- base might be due, at least in part, to the current degree of knowledge of this transcriptional regulatory network, with only sparse data for many of its compo- nents. Although a number of possible sources of bias are present, it is worth noting that the topological pat- tern of organization reported from different sources of protein–protein interactions seems consistent [32].
To this end, we explored, for the first time, the human transcription factor network (HTFN) obtained from the protein–protein interaction information avail- able in the TRANSFAC database [31], using novel tools of network analysis. We show that this approxi- mation allows us to propose evolutionary considera- tions concerning the mechanisms shaping network architecture.
Results and Discussion
Topological analysis
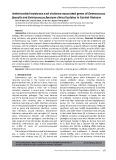
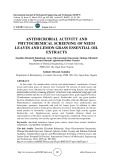
Topological analysis of HTFN is summarized in Table 1 showing that HTFN is a sparse, small-world graph. The degree distribution (Fig. 2A) and clustering (Fig. 2B) show a heterogeneous, skewed shape remind- ing us of a power–law behaviour, indicating that most TFs are linked to only a few others, whereas a handful of them have many connections. The average between- shows well-defined power–law ness
centrality (b)
Data compilation from the TRANSFAC transcription factor database provided 1370 human entries. After
FEBS Journal 272 (2005) 6423–6434 ª 2005 The Authors Journal compilation ª 2005 FEBS
6424
C. Rodriguez-Caso et al.
Human transcription factor network topology
Table 1. Topological parameters of some real networks: Human transcription factor network (HTFN); Erdo¨ s-Re´ nyi (ER) null model network with N identical to that of the present study, proteome network from yeast [9] and Internet (year 1999) [33,64]. For the ER model, we have used ÆCæ ¼ k ⁄ N and L ¼ log(N) log)1Ækæ [67]. For completeness we also add the total number of links (l).
HTFN
Yeast ER model
Proteome
Internet
N l Ækæ ÆCæ L r
230 851 3.70 0.17 4.50 )0.18
230 851 3.70 0.015 4.15 )0.005
1870 4488 2.40 0.07 6.81 )0.15
10 100 38 380 3.80 0.24 3.70 )0.19
N total number of nodes, l total number of links, Ækæ average degree, ÆCæ average clustering, L average path length, r assortative mixing.
scaling (Fig. 2C). Also, the network displays well- defined correlations among proteins depending on their degree. As with other complex networks, we found that the HTFN is disassortative: high-degree proteins attach to low-degree ones [33]. This is an important property as it is connected with the presence of modu- lar organization (see below). Because hubs are linked to many other elements but tend not to link them- selves, disassortativeness allows large parts of the net- work to be separated and thus partially isolated from different sources of perturbation.
Fig. 2. Distributions for (A) degree, (B) betweenness centrality and (C) clustering. Power–law fittings are shown in insets (see details for definitions in Experimental Procedures). Linear regression coeffi- cient: (A) r2 ¼ 0.96; (B, inset) betweenness centrality, r2 ¼ 0.94; (C, inset) clustering coefficient r2 ¼ 0.74.
gram of relations where we can see also a hierarchy, because modules are not related at the same level as would be expected in a pure modular network [2].
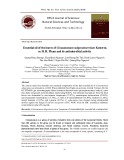
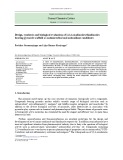
Figure 3A,B shows the obtained correlation profiles. They are similar to that previously obtained for a pro- tein interaction network of yeast proteome [34]. As shown in Fig. 3A, highly connected nodes associated with poorly connected ones are more abundant than predicted by a null model. By contrast, links between highly connected nodes tend to be under-represented, indicating a reduced likelihood of direct links between hubs. SF networks exhibit a high degree of error toler- ance, yet they are vulnerable to attacks against hubs [35]. It seems that this has been attenuated in biomo- lecular networks by avoiding direct links between hubs [34]. This type of pattern is a sign of modularity: groups of proteins can be identified as differentiated parts of the web, allowing for functional diversity. Modularity can be properly detected and measured using the so-called topological overlap matrix [36]. Figure 3C shows the topological overlap matrix for HTFN. The array shows a nested, hierarchical struc- ture with small modules as dark boxes across the diag- onal, which have a large overlap. However, there are some weak connections between modules, as shown by the tiny lines in the topological overlap matrix. The algorithm weights the (topological) association of any node to the others, and it is possible to build a dendro-
It is noteworthy that the presence of a high level of self-interaction is a prominent feature of this TF web, from other real networks. Indeed, distinguishing it self-interactions. Here 17.8% of
proteins
have
FEBS Journal 272 (2005) 6423–6434 ª 2005 The Authors Journal compilation ª 2005 FEBS
6425
C. Rodriguez-Caso et al.
Human transcription factor network topology
C
A
B
Fig. 3. Topological analysis of the HTFN. Correlation profile analysis (A) taking into account self-interactions and (B) avoiding them (Z-score is defined in Experimental Procedures). (C) Topological overlap matrix and dendogram. A–G are the topological groups defined by tracing of a dashed line through the dendogram. See Table 3 for biological and functional features of each group.
recombination leads
self-interaction is understood as the interaction between proteins of the same type, i.e. homo-oligomerization, regardless of the number of monomers involved. To evaluate their importance, we compared correlation profiles with and without self-interactions (Fig. 3A and B, respectively). Changes in the whole profile are evi- dent, suggesting that nodes with self-interactions are distributed along the whole range of degree values. It is particularly remarkable that the intense signal around degree values of 2–3 in the profile with self-interactions (Fig. 3A) is attenuated in the corresponding profile fol- lowing their deletion (Fig. 3B). Such a striking differ- ence can be explained by an overabundance of proteins able to form homo-oligomers and to establish connec- tions with one or two more proteins. This can be related to the small but highly integrated modules observed in the topological overlap matrix (Fig. 3C). A simple explanation for these observations can be given based on biological constrains derived from the evolu- tion of TFs, and is discussed below.
Functional, evolutionary and topological constrains
network those factors that have the highest number of interactions (so-called hubs). In a biological con- text, hubs can have important roles. In metabolic net- works, essential metabolites such as pyruvate and coenzyme A have been identified as hubs [36]. In rela- tion to TFs, it has been suggested that p53 is a hub integrating regulatory interactions involving cell cycle, cell differentiation, DNA repair, senescence or angio- genesis [37]. Perhaps not surprisingly, this gene is considered a so-called Achilles’ heel of cancer [38]. Table 2 summarizes the most highly connected factors in HTFN and their related diseases. They are also highlighted in the HTFN graph (Fig. 1). It should be stressed that TATA binding protein (TBP) has the highest degree. TBP is considered a key factor for transcription initiation [39]. Its essentiality is highligh- ted by the fact that an aberrant version of TBP cau- ses spinocerebellar ataxia [40] and the lack of TBP by homologous to growth arrest and apoptosis at the embryonic blastocyst stage [41]. Other hubs, such as p53 (the second in degree) and retinoblastoma protein (pRB) are tumour suppressor proteins. Most of these highly connected factors are related to cancer.
Biological function of topological relevant elements
In order to clarify the relation between biological function and topology of HTFN, we identified in the
We have seen that highly connected nodes have essential biological roles. However, because regulation can occur at different levels, such as target specificity
FEBS Journal 272 (2005) 6423–6434 ª 2005 The Authors Journal compilation ª 2005 FEBS
6426
C. Rodriguez-Caso et al.
Human transcription factor network topology
Table 2. Description and functionality of transcriptions factor hubs. Transcription factor (TF), degree (k), betweenness centrality (b).
TF
Description
Associate disease
k
b · 103
TBP p53 P300 RXR-a pRB
Spinocerebellar ataxia [40] Proliferative disease [68] May play a role in epithelial cancer [69] Hepatocellular carcinoma [70] Proliferative disease Bladder cancer.
27 23 18 18 15
17.3 18.5 20.2 8 27.1
Osteosarcoma [71]
RelA c-jun c-myc c-fos
Basal transcription machinery initiator Tumor suppressor protein Coactivator. Histone acetyltransferase Retinoid X-a receptor retinoblastoma suppressor protein. Tumour suppressor protein NF-jB pathway AP-1 complex (activator). Proto-oncogen Activator. Proto-oncogen AP-1 complex (activator). Proto-oncogen
Hepatocyte apoptosis and foetal death [72] Proliferative disease [73] Proliferative disease [74] Proliferative disease [75]
14 14 13 12
6.6 4.1 10.5 2
or via control of TF expression, less connected factors may also be relevant to cell survival.
a complex, by varying their function and affinity to DNA. This is the case of the bHLH–bZip proto-onco- gen c-myc [44], or the Zn finger retinoid X receptor RXR [45].
Functional and structural patterns from topology
From a topological viewpoint, connections by self- interacting domains would imply high clustering and modularity, because all these proteins share the same rules and they have the potential to give a highly inter- connected subgraph (i.e. a module). According to this, the high clustering of HTFN (see Fig. 1) could be explained as a by-product of the overabundance of self-interacting domains.
In order to reveal the mechanisms that shape the struc- ture of HTFN, we studied its topological modularity in relation to the function and structure of TFs from available information. From a structural point of view, the overabundance of self-interactions is associated with a majority group of 55% of basic helix–loop– helix (bHLH) and leucine zippers (bZip), 17.5% of Zn fingers and 22.5% corresponding to a more hetero- geneous group, the ‘beta-scaffold factor with minor groove contact’ (according to the TRANSFAC classifi- superclass, which includes Rel homology cation) regions, MADS factors and others.
Such structures
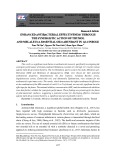
We wondered whether the HTFN modular architec- ture (Fig. 3C) might include both functionality and structural similarity. In order to simplify the study of modularity, we traced an arbitrary line identifying seven putative protein groups (dashed line in Fig. 3C). Nodes of each group were identified by different col- ours in the HTFN graph (Fig. 4A) where we visualize the modules defined by the topological overlap algo- rithm. We note that a consequence of the hierarchical component of HTFN is that not all factors in each group have the same level of relation. Unlike a simple modular network, the combination of hierarchy and modularity cannot give homogeneous groups. Figure 4B shows the HTFN core graph, highlighting its modularity, the under-representation of connections between hubs and the overabundance of highly con- nected nodes linked to poorly connected ones (both observed in the correlation profile). The central role of the hubs in topological groups defined in Fig. 3A should be stressed, such hubs are those described in Table 2, with the exception of E12 (with k ¼ 11), which is involved in lymphocyte development [46].
that
features of
can be understood as protein domains, which can be found alone or combined to give rise to TFs. These domains are responsible for relevant properties, such as TF–DNA or TF–TF bind- ing. In this context, self-interactions can be explained by the presence of domains with the ability to bind between them as is the case of bHLH and bZip. They follow a general mechanism to interact with DNA based on protein dimerization [42]. Zn finger domains are common in TFs, allowing them to bind DNA, but not to interact with other protein regions [42]. This group of self-interacting Zn finger proteins is a subset of the nuclear receptor superfamily (steroid, retinoid and thyroid, as well as some orphan receptors) [26,43]. They obey a general mechanism in which Zn finger TFs have to form dimers in order to recognize tandem sequences in DNA [42]. In fact, regulation at the level of formation of transcriptional regulatory complexes is linked to a homo ⁄ heterodimerization of TFs contain- ing these self-interacting domains. Attending to this simple rule of domain self-interaction, relative levels of these proteins could determine the final composition of
An analysis of the topological modules of the Fig. 3 they include structural (labelled A–G) shows features. Table 3 summarizes the and ⁄ or functional main structural and functional these groups. In agreement with the structural homogeneity
FEBS Journal 272 (2005) 6423–6434 ª 2005 The Authors Journal compilation ª 2005 FEBS
6427
C. Rodriguez-Caso et al.
Human transcription factor network topology
Fig. 4. Colour map representation of those topological groups defined in Fig. 3C for HTFN graph (A) and the core graph with a kc ¼ 11 (B).
of TFs, the most representative groups are A and B and F followed by group C with two main structural domains. By contrast, the groups with the highest structural heterogeneity are D, E and G (see details in Table 3).
factors involved in the NFjB pathway and other func- tional related factors, such as p300 and CBP. Group D contain factors related to cell cycle and DNA repair-related factors (p53 and its direct interactors, and BCRA). It is noteworthy that it contains the struc- tural and functional E2F ⁄ pRB pathway, which is made of a group of fork-head transcription factors (E2F and DP factors) and retinoblastoma proteins (pRB, p107 and p130) [53]. Moreover, it also appears related to histone deacetylases. This topological homogeneous module involves the regulatory mechanism by means of which pRB interacts with E2F proteins and is involved in the recruitment of histone deacetylases in order to carry out the transcriptional repression [54]. Factors involved in DNA repair, such as p53 (and its direct interactors) and BCRA, appear also close in the dendogram.
Evolutionary implications of the HTFN topology
In relation to functionality, group B exhibits a clear homogeneity because is made of the so-called c-myc ⁄ mad ⁄ max network (bHLH–bzip domains) [47] and other related factors such as rox [48], mxi [47], miz-1 [49] TRRAP, GNC5, bin-1 [50]. Group F contains 90% of the members of the nuclear receptor hormone superfamily of the HTFN (they also are Zn finger pro- teins) [26]. In these groups, functionality and structural homogeneity appear to be related. Group E is made of TATA-binding protein-associated proteins, represent- ing the conserved basal transcription machineries for different promoter types from yeast to humans [51]. Other factors in group E are not part of these basal machineries but are closely related to the TBP. Thus, we can say that group E has clear functionality in transcription initiation. Unlike other groups, its com- ponents do not show structural similarities, with the exception of some TAFII and NC2 and NF-Y factors that have histone fold motifs [52]. Group G is a small subset that contains all the SMAD proteins of the HTFN and APC and b-catenin-related factors.
Groups C and D involve smaller functional sets. Group C contains the Rel family and CRE binding
Phylogenetic studies about the main protein structure types in HTFN such as the Zn finger nuclear receptor and bHLH domains suggest that they were expanded by a diversification process derived from common ancestral genes via duplication and exon shuffling [28,55]. They are believed to have expanded together with the appearance of multicellularity, becoming required for the new functional regulations derived
FEBS Journal 272 (2005) 6423–6434 ª 2005 The Authors Journal compilation ª 2005 FEBS
6428
C. Rodriguez-Caso et al.
Human transcription factor network topology
Table 3. Structural and functional features of the groups obtained from topological overlap matrix.
Group No. of TF Structural features
Functional features
TFs
A
22
77% bHLH domains.
Lyl-1, Lmo2, Lmo1, MEF-2, MEF-2DAB, ITF-1, E12, E47, ITF-2, HEB, Id2, Tal-1, MyoD, Myf-4, Myf-5, Myf-6, Tal-1b,Tal-2, MASH-1, AP-4, INSAF, HEN1
B
19
47% bHLH-bZip domains.
C
30
36% rel homology regio´ n 40% bZip domains.
Muscle and neural tissue specific, sex determination. Includes E proteins family related to lymphocyte differentiation [46,55]. Includes E-box type A TF. c-myc related factors (59%). Includes E-box type B TF. Related to cell proliferation [55]. TF involved in NFjB pathway, AP1 complex and others
D
38
24% fork head domains.
Max1, Max2, AP-2aA, YB-1, Nmi, MAZ, SSRP1, Miz-1, Bin1, TRRAP, c-myc, dMax, Mxi1, MAd1, N-Myc, L-Myc(long form), Rox, GCN5, ADA2 IRF-5, c-rel, NF-jB2 precursor, IjB-a, ATF-a, p65d, NF-jB2(p49), NF-jB1 precursor, CRE-BPa, ATF3, HMGY, Fra-2, CEBPb, ATF-2, RelA, c-fos, c-jun, p300, CBP, USF2, XBP-1, NRL, GR-a, GR-b, Ref-1, CEBPa, CEBPd, ATF4, NF-AT1, NF-AT3 SRF, AR, STAT3, TFII-I, Net, Elk-1, SAP-1a,
E2F ⁄ pRB pathway, histone deacetylases (HDAC) [53,54]. PRB and p53 isoforms. . .
E
45
22% histone folding.
Major part of specific interacting regions
Basal transcriptional machinery for promoters type I, II, III, PTF ⁄ SNAP complex and TBP related factors [39,51,52].
F
57
42% Zn finger domains.
It contains the 90% of the
members of nuclear receptor superfamily (they are Zn fingers also) of the HTFN.
G
19
31% MAD domains.
SMAD family proteins and b-catenin and APC related factors.
MHox(K-2), Fli-1 o Egr-B, SAP-1b, BRIP1, pRB, p130, DP-1, DP-2, E2F-1, E2F-2, E2F-3, p107, E2F-4, E2F-5, E2F-6, HDAC3, HDAC1, HDAC2, YAF2, ADA3, BRCA1, WT1, 53BP1, PML-3, MTA1-L1, BAF47, p53, YY1, TGIF, GATA-2, HDAC5 TFIIA-ab precursor(major), AREB6, TFIIB, TFIIF-a, TAF(II)31, T3R-a1, 14-3-3e, CTF-1, TFIIF-b, TBP, TAF(II)70-a, TAF(II)30, TAF(II)70-b, Sp1, TAF(II)135, TAF(II)55, TAF(II)100, TAF(II)250, TAF(II)20, TAF(II)28, TAF(II)18, PU.1, ELF-1, CLIM2, POU2F2, TAF(I)110, TAF(I)63, TAF(I)48, NC2, PTFc, PTFd, PTFb, PC4, TFIIA-c, USF1, USF2b, CP1A, RFX5, CP1C, RFXANK, CIITA, NF-YA, ZHX1, TFIIE-a, TFIIE-b 14-3-3 zeta, STAT1a, STAT1b, dCREB, ATF-1, FTF, NCOR2, RBP-Jj, TFIIH-p80, NCOR1, RXR-a, TFIIH-p90, TFIIH-p62, TFIIH-CyclinH, TFIIH-MO15, TFIIH-MAT1, RXR-b, RARa1, RAR-c1, POU2F1, TFIIH-p44, OCA-B, SRC-3, T3R-b1, RARc, RAR-b, VDR, SHP, PPAR-c1, PPAR-b, ARP-1, RAR-b2, LXR-a, FXR-a, CREB, STAT2, JunB, PPAR-c2, FOXO3a, STAT6, SYT, TIF2, HNF-4, AhR, ER-a, COUP-TF1, BRG1, MOP3, ERR1, HIF-1a, Arnt, SRC-1, HNF-4a2, EPAS1, HNF-4a3, HNF-4a1 ER-b, ZER6-P71, CtBP1, PGC-1, SKIP, Smad2, Smad3, Smad4, b-catenin, HOXB13, LEF-1, Evi-1, TCF-4E, TCF-4B, Pontin52, APC, Smad1, Smad6, Smad7
from the acquisition of a new level of complexity [25,26,28].
logical constrain derived from the evolution of this family.
It has been suggested that Zn finger nuclear recep- tors (group E) are derived from a common ancestral gene [26]. In the case of bHLH TFs, it is remarkable that topological groups A and B are made of TFs belonging to the phylogenetic E-box types A and B [55], respectively. It suggests that phylogeny can also be retained by the topology. They made a topological group due to the self-interacting property of the bHLH domains. Therefore, this seems to be a topo-
Evolution based on domain reusing might explain the abundance of certain protein domains and is a way of easily increasing the number of TFs, as appears to have occurred through evolution. Functionality can be linked to structure, as is the case of DNA-binding and Zn finger domains, or the fork-head DNA-binding domains in the E2F ⁄ pRB pathway [56]. Another exam- ple is the enzymatic activity of histone deacetylases, contained in this network.
FEBS Journal 272 (2005) 6423–6434 ª 2005 The Authors Journal compilation ª 2005 FEBS
6429
C. Rodriguez-Caso et al.
Human transcription factor network topology
Conclusion
the nature of
Regulation based on protein interactions makes it possible in the to find ‘transcriptional adaptors’ network. They are linking proteins with no other function. In fact, such transcriptional adaptors do appear in this web. This is the case of the previously described example, where pRB is unable to bind DNA alone [54] and interacts with E2F proteins in order to recruit histone deacetylases. Another exam- ple is NC2, a complex that acts as a general negat- class II and III promoter gene ive regulator of expression, dimerizing via histone-fold structural motifs [51].
HTFNs share topological properties with other real networks. We have shown that the highly connected nodes are related to essential functions, and topologi- cal features retain functionality and phylogeny. How- ever, the connections between these factors needs to be understood at the level of the pro- the HTFN tein domain. The global properties of topology are partially due to specific interacting pro- tein regions associated with the spatial and dynamical coordination of essential functions, together with tin- kering processes based on protein domains reuse under initially slight selection pressures.
to genome regulation,
The evolution of HTFN could be also constrained by protein domain properties and their distribution along the proteins. In fact, using domain–domain coexistence in proteins as a way to establish links, it is possible to build a scale-free network in which very few domains are found related with many others [57]. In this context, it has been shown that some folds and superfamilies are extremely abundant, but most are rare [58]. Such heterogeneous distribution might sug- that only few domains have been suitable to gest undergo amplification.
Future work must explore the dynamical context associated to the HTFN explored here at the topologi- cal level. A better picture of its robustness and how it relates to gene regulation will be obtained by consider- ing networks dynamics. Also, given the special rele- vance of our elements the dynamical effects on network stability after removing some particular components of the network can shed light into further evolutionary and biomedical ques- tions.
Experimental procedures
features. Group D (basal
Protein network data acquisition
is another
[52]
HTFN was built using a specific transcription factor data- base (TRANSFAC 8.2 professional database) [31]. We restricted our search to Homo sapiens using the database OS (organism) field. Information concerning to physical interactions, derived from bibliographical sources, could be extracted from the database IN (interacting factor) field. TRANSFAC contains, as entries, not only single transcrip- tion factors but also some entries for well-described transcription complexes. To avoid identifying a protein complex as a single protein, which could cause false and redundant interactions, we eliminated those complexes by selecting only entries with SQ field (protein sequence), which is only present in single transcription factors.
Although tinkering based on domain reuse appears to be involved in shaping HTFN, part of the modular- ity cannot be explained by means of common struc- tural transcriptional machinery) is a clear functional module lacking a homogeneous structural pattern. Proteins of this group form a bridge between RNA polymerases and cis ele- ments in gene promoters. Initiation of transcription is an essential process pervading all other transcriptional- regulation events. Although histone-like folding in cer- reusing tain TAFII example of pre-existing solutions, it is remarkable that most of these complexes have been assembled by specific inter- acting regions. Such interaction could be given by a random process of optimization in which physical interaction was a solution (either directly or through molecular adaptors) to guarantee the colocalization of proteins that have to work together to perform a given function.
Graph measures
compromising
essential
Protein–protein interaction maps are complex networks. These networks are defined as sets of N nodes (the proteins, indicated as Pi, i ¼ 1, .. ., N) and l links among them. Two nodes will be linked only if they interact physically. The most basic parameters to describe such a network are as follows. (a) Degree (ki) of a node defined as the number of links of such a node. The average degree Ækæ will be simply defined as Ækæ ¼ 2l/N. (b) Clustering coefficient (Ci); for a
By contrast, bHLH and bZip domains have only the ability to bind DNA. Therefore, their essential role should be placed in their gene targets. Such systems emerged in order to improve regulation and may functions, evolve without because they did not use the same type of connections of the basal machinery or other essential regulatory complexes. In this context, modularity should also be seen as a topological substrate in which the evolution- ary trials would not compromise functionality of the whole network.
FEBS Journal 272 (2005) 6423–6434 ª 2005 The Authors Journal compilation ª 2005 FEBS
6430
C. Rodriguez-Caso et al.
Human transcription factor network topology
systems
N X
node Pi, it is the number of neighbouring of li links between nodes divided by the total number allowed by its degree, ki (ki –1). Ci tells us how interconnected the neighbours are. The clustering coefficient of the whole network is formally defined as:
i¼1
hCi ¼ 1 N 2li kiðki (cid:1) 1Þ
i
Compared with pure random ER and SF networks, bio- molecular webs show the characteristic modular and hierar- chical organization of biological [36], where clustering decays with the degree as C(k) ~ k)1 [63]. This property is believed to confer additional stability, because failures in separate modules do not compromise the stabil- ity of the whole system. In this context, a related measure of network correlations associated to modular organization is provided by the coefficient r of assortative mixing [33]. This coefficient actually weights the correlation among the degrees of connected elements in a graph. It is defined as: (c) The average path length (L) indicates the average num- ber of nodes that separates each node from any other. If dmin (Pi, Pj) is the length of the shortest path connecting proteins Pi and Pj, then L is defined as: (cid:2)2
X
r ¼ (cid:2)2
L ¼
dminðPi; PjÞ
i
i
1 2 ðji þ kiÞ 1 2 ðji þ kiÞ
L(cid:1)1 P (cid:1) i jiki (cid:1) L(cid:1)1 P (cid:1) i Þ (cid:1) L(cid:1)1 P i þ k2 L(cid:1)1 P 1 2 ðj2
2 NðN (cid:1) 1Þ
i>1
(d) Betweenness centrality (bm) for a node Pm is the number of short paths connecting each pair of nodes that contain the node Pm [59]. Specifically, for the m-th protein, it is the sum
X
bm ¼
thus displaying hubs
Cði; m; jÞ Cði; jÞ
i6¼j
where ji and ki are the degrees of the nodes located at the ends of the i-th link, with i ¼ 1 .. . L. Defined in this way, it is such that )1 £ r £ +1, with negative values indicating disassortativeness and positive values indicating assortative- ness. Most complex networks have been found to be disas- sortative, that are not directly connected among them.
Graph distributions
information about
where G(i, m, j) is the number of the shortest paths between proteins Pi and Pj, passing through Pm, whereas G(i, j) is the total number of paths between those two proteins. The ratio G(i, m, j)/G(i, j) (assuming G(i, j) > 0) weights how crucial the role of Pm is connecting Pi and Pj. Average degree Ækæ, clustering ÆCæ and betweenness centrality Æbæ give us global the network. Using these parameters, it is possible to identify relevant properties of a complex web. and clustering centrality Degree, betweenness and clustering distribution are shown in Fig. 2. We plot the distribution of these measures vs. degree on a log-log scale. Degree distribution (Fig. 2A) was measured using the cumulative frequency n(k) of nodes for each degree. In Fig. 2B,C we display the distribution of against degree, betweenness respectively.
Both degree and betweenness centrality distributions are calculated by using the network dataset taking into account self-interactions. In any case, we obtained minor differences in the fitting of these distributions when self-interactions were not included. For the case of clustering, we show the network measures without interaction, because taking into account self-interaction leads to an overestimation of this measure. Power–law fitting was done using the cumulative degree distribution and the average value for betweenness centrality and clustering.
Real networks share the so-called ‘small-world’ beha-
viour (SW) [60,61], different to that shown by an Erdo¨ s-
Re´ nyi (ER) random network null model
[62]. Typically,
LSW (cid:2) LER and ÆCSWæ >> ÆCERæ. Real networks also exhi-
bit scale-free (SF) distributions of links, where the fre-
quency of nodes with degree k, f(k), decays according to a
power-law distribution, i.e. f(k) ¼ Ak–c, with 2
Topological algorithms
nðkÞ (cid:3)
Ak(cid:1)cdk (cid:2) k(cid:1)cþ1:
k
Correlation profiles
FEBS Journal 272 (2005) 6423–6434 ª 2005 The Authors Journal compilation ª 2005 FEBS
6431
For SF networks, most of the nodes are poorly connected and very few nodes (the so-called hubs) are highly connec- ted. It has been shown that SF networks also exhibit power–law correlations for clustering and betweenness vs. degree [63,64]. Moreover, SF networks exhibit high home- ostasis when nodes are removed at random. In contrast, if the most connected nodes are successively eliminated, the network becomes fragmented. However, a similar fragility is observed both if the nodes are removed at random or in order of increasing degree in random webs [61]. The so-called correlation profile algorithm, defined in Maslov & Sneppen [34], compares the studied network with randomized versions of it with the same size and degree dis- tribution. The so-called Z-score quantifies the difference between the studied network and an ensemble of random- ized networks. Z is defined as Z(k0, k1) ¼ (P(k0, k1)) PR(k0, k1)) ⁄ rR(k0, k1), where P(k0, k1) is the relative frequency of a pair of given link degrees, PR(k0, k1) is the same frequency but for a randomized network with the
C. Rodriguez-Caso et al.
Human transcription factor network topology
same degree distribution than the studied one and, finally, rR(k0, k1) is the standard deviation of those ensemble rand- omized networks [34]. 5 Butcher RA & Schreiber SL (2005) Using genome-wide transcriptional profiling to elucidate small-molecule mechanism. Curr Opin Chem Biol 9, 25–30.
Topological overlap matrix
6 Wang Y, Klijn JG, Zhang Y, Sieuwerts AM, Look MP, Yang F, Talantov D, Timmermans M, Meijer-van Geld- er ME, Yu J et al. (2005) Gene-expression profiles to predict distant metastasis of lymph-node-negative pri- mary breast cancer. Lancet 365, 671–679. 7 Kitano H (2002) Computational systems biology. Nature 420, 206–210. 8 Lee TI, Rinaldi NJ, Robert F, Odom DT, Bar-Joseph
Z, Gerber GK, Hannett NM, Harbison CT, Thompson CM, Simon I et al. (2002) Transcriptional regulatory networks in Saccharomyces cerevisiae. Science 298, 799–804. This algorithm gives information concerning network mod- ularity. It arranges the nodes depending on the number of neighbours that they share. Afterwards, they are drawn in a bidimensional symmetric array where the strength of the relation between nodes is shown with a black to white gra- dient [36]. This algorithm also allows building a dendro- gram that reflects the hierarchical relations between nodes. Other algorithms [65,66] have been tested providing similar results.
Scaffold graph analysis
9 Jeong H, Mason SP, Barabasi AL & Oltvai ZN (2001) Lethality and centrality in protein networks. Nature 411, 41–42.
10 Li S, Armstrong CM, Bertin N, Ge H, Milstein S, Box- em M, Vidalain PO, Han JD, Chesneau A, Hao T et al. (2004) A map of the interactome network of the meta- zoan C. elegans. Science 303, 540–543.
11 Jeong H, Tombor B, Albert R, Oltvai ZN & Barabasi AL (2000) The large-scale organization of metabolic networks. Nature 407, 651–654. This algorithm allows us to obtain a well-defined subgraph containing all the hub connections, and their interaction partners. One pair of connected proteins is conserved, in the so-called k-scaffold graph, if the degree of at least one protein of this pair is bigger than a predefined cut-off kc. By using this algorithm, both hubs and connectors among hubs are retained.
Acknowledgements
12 Han JD, Bertin N, Hao T, Goldberg DS, Berriz GF, Zhang LV, Dupuy D, Walhout AJ, Cusick ME, Roth FP et al. (2004) Evidence for dynamically organized modularity in the yeast protein–protein interaction net- work. Nature 430, 88–93.
13 Giot L, Bader JS, Brouwer C, Chaudhuri A, Kuang B, Li Y, Hao YL, Ooi CE, Godwin B, Vitols E et al. (2003) A protein interaction map of Drosophila melano- gaster. Science 302, 1727–1736. 14 Bornholdt S & Schuster HG (2002) Handbook of Graphs and Networks. Wiley-VHC, Weinheim. 15 Conant GC & Wagner A (2003) Convergent evolution of gene circuits. Nat Genet 34, 264–266. 16 Sole RV, Pastor-Satorras R, Smith ED & Kepler T
Thanks to Dr J. Aldana-Montes and members of Kha- os group research of the University of Ma´ laga for their help in data acquisition. Thanks to P. Fernandez and S. Valverde from the ICREA-Complex Systems Labor- atory for their help at different stages of this work. Thanks to Dr F. Sa´ nchez-Jime´ nez for her suggestions in manuscript preparation. This work was supported by grants SAF2002-02586, FIS2004-05422, P2256704 and CVI-267 group (Andalusian Government), a MECD fellowship (CRC) and by the Santa Fe Insti- tute (RVS).
(2002) A model of large-scale proteome evolution. Adv Complex Systems 5, 43–54.
References
1 Hartwell LH, Hopfield JJ, Leibler S & Murray AW 17 Pastor-Satorras R, Smith E & Sole RV (2003) Evolving protein interaction networks through gene duplication. J Theor Biol 222, 199–210.
(1999) From molecular to modular cell biology. Nature 402, C47–C52.
18 Perez-Rueda E & Collado-Vides J (2000) The repertoire of DNA-binding transcriptional regulators in Escheri- chia coli K-12. Nucleic Acids Res 28, 1838–1847. 19 Wyrick JJ & Young RA (2002) Deciphering gene 2 Barabasi AL & Oltvai ZN (2004) Network biology: understanding the cell’s functional organization. Nat Rev Genet 5, 101–113. expression regulatory networks. Curr Opin Genet Dev 12, 130–136.
FEBS Journal 272 (2005) 6423–6434 ª 2005 The Authors Journal compilation ª 2005 FEBS
6432
3 Sole RV & Pastor-Satorras R (2002) Complex networks in genomics and proteomics. Handbook of Graphs and Networks (Bornholdt S & Schuster HG, eds). Wiley- VHC, Weinheim. 4 Lim MS & Elenitoba-Johnson KS (2004) Proteomics in pathology research. Lab Invest 84, 1227–1244. 20 Riechmann JL, Heard J, Martin G, Reuber L, Jiang C, Keddie J, Adam L, Pineda O, Ratcliffe OJ, Samaha RR et al. (2000) Arabidopsis transcription factors: genome- wide comparative analysis among eukaryotes. Science 290, 2105–2110.
C. Rodriguez-Caso et al.
Human transcription factor network topology
(1999) A neurological disease caused by an expanded CAG trinucleotide repeat in the TATA-binding protein gene: a new polyglutamine disease? Hum Mol Genet 8, 2047–2053. 21 Messina DN, Glasscock J, Gish W & Lovett M (2004) An ORFeome-based analysis of human transcription factor genes and the construction of a microarray to interrogate their expression. Genome Res 14, 2041–2047. 22 Guo A, He K, Liu D, Bai S, Gu X, Wei L & Luo J
(2005) DATF: a database of Arabidopsis transcription factors. Bioinformatics 21, 2568–2569. 41 Martianov I, Viville S & Davidson I (2002) RNA poly- merase II transcription in murine cells lacking the TATA binding protein. Science 298, 1036–1039. 42 Branden C & Tooze J (1999) Introduction to Protein Structure. Garland, New York.
23 Venter JC, Adams MD, Myers EW, Li PW, Mural RJ, Sutton GG, Smith HO, Yandell M, Evans CA, Holt RA, et al. (2001) The sequence of the human genome. Science 291, 1304–1351. 24 Levine M & Tjian R (2003) Transcription regulation 43 Gronemeyer H, Gustafsson JA & Laudet V (2004) Prin- ciples for modulation of the nuclear receptor superfam- ily. Nat Rev Drug Discov 3, 950–964. and animal diversity. Nature 424, 147–151.
44 Sakamuro D & Prendergast GC (1999) New Myc-inter- acting proteins: a second Myc network emerges. Onco- gene 18, 2942–2954. 25 Ledent V, Paquet O & Vervoort M (2002) Phylogenetic analysis of the human basic helix–loop–helix proteins, Genome Biol 3, RESEARCH0030.
45 Zhang XK & Pfahl M (1993) Hetero- and homodimeric receptors in thyroid hormone and vitamin A action. Receptor 3, 183–191.
26 Laudet V (1997) Evolution of the nuclear receptor superfamily: early diversification from an ancestral orphan receptor. J Mol Endocrinol 19, 207–226. 27 Sharrocks AD (2001) The ETS-domain transcription factor family. Nat Rev Mol Cell Biol. 2, 827–837. 46 Quong MW, Romanow WJ & Murre C (2002) E pro- tein function in lymphocyte development. Annu Rev Immunol 20, 301–322.
47 Luscher B (2001) Function and regulation of the tran- scription factors of the Myc ⁄ Max ⁄ Mad network. Gene 277, 1–14. 28 Amoutzias GD, Robertson DL, Oliver SG & Bornberg- Bauer E (2004) Convergent networks by single-gene duplications in higher eukaryotes. EMBO Report 5, 274–279. 29 Baron M, Norman DG & Campbell ID (1991) Protein modules. Trends Biochem Sci 16, 13–17. 30 Sonnhammer EL & Kahn D (1994) Modular arrange-
ment of proteins as inferred from analysis of homology. Protein Sci 3, 482–492. 31 Wingender E, Chen X, Fricke E, Geffers R, Hehl R, 48 Meroni G, Reymond A, Alcalay M, Borsani G, Tani- gami A, Tonlorenzi R, Nigro CL, Messali S, Zollo M, Ledbetter DH et al. (1997) Rox, a novel bHLHZip pro- tein expressed in quiescent cells that heterodimerizes with Max, binds a non-canonical E box and acts as a transcriptional repressor. EMBO J 16, 2892–2906. 49 Wanzel M, Herold S & Eilers M (2003) Transcriptional repression by Myc. Trends Cell Biol 13, 146–150.
Liebich I, Krull M, Matys V, Michael H, Ohnhauser R et al. (2001) The TRANSFAC system on gene expres- sion regulation. Nucleic Acids Res 29, 281–283. 32 Wagner A (2003) How the global structure of protein 50 Telfer JF, Urquhart J & Crouch DH (2005) Suppression of MEK ⁄ ERK signalling by Myc: role of Bin-1. Cell Signal 17, 701–708.
interaction networks evolves. Proc Biol Sci 270, 457–466. 33 Newman ME (2002) Assortative mixing in networks. 51 Lee TI & Young RA (1998) Regulation of gene expres- sion by TBP-associated proteins. Genes Dev 12, 1398– 1408. Phys Rev Lett 89, 208701.
34 Maslov S & Sneppen K (2002) Specificity and stability in topology of protein networks. Science 296, 910–913. 52 Gangloff YG, Romier C, Thuault S, Werten S & David- son I (2001) The histone fold is a key structural motif of transcription factor TFIID. Trends Biochem Sci 26, 250–257. 53 Dimova DK & Dyson NJ (2005) The E2F transcrip- 35 Albert R, Jeong H & Barabasi AL (2000) Error and attack tolerance of complex networks. Nature 406, 378–382. tional network: old acquaintances with new faces. Onco- gene 24, 2810–2826.
36 Ravasz E, Somera AL, Mongru DA, Oltvai ZN & Bar- abasi AL (2002) Hierarchical organization of modularity in metabolic networks. Science 297, 1551–1555. 37 Vogelstein B, Lane D & Levine AJ (2000) Surfing the 54 Thiel G, Lietz M & Hohl M (2004) How mammalian transcriptional repressors work. Eur J Biochem 271, 2855–2862. p53 network. Nature 408, 307–310. 38 Vogelstein B & Kinzler KW (2001) Achilles’ heel of can- cer? Nature 412, 865–866. 55 Morgenstern B & Atchley WR (1999) Evolution of bHLH transcription factors: modular evolution by domain shuffling? Mol Biol Evol 16, 1654–1663. 39 Davidson I (2003) The genetics of TBP and TBP-related factors. Trends Biochem Sci 28, 391–398.
FEBS Journal 272 (2005) 6423–6434 ª 2005 The Authors Journal compilation ª 2005 FEBS
6433
40 Koide R, Kobayashi S, Shimohata T, Ikeuchi T, Maruy- ama M, Saito M, Yamada M, Takahashi H & Tsuji S 56 Krek W, Livingston DM & Shirodkar S (1993) Binding to DNA and the retinoblastoma gene product promoted by complex formation of different E2F family members. Science 262, 1557–1560.
C. Rodriguez-Caso et al.
Human transcription factor network topology
57 Wuchty S (2001) Scale-free behavior in protein domain 68 Vousden KH & Prives C (2005) P53 and prognosis: new networks. Mol Biol Evol 18, 1694–1702. insights and further complexity. Cell 120, 7–10. 69 Gayther SA, Batley SJ, Linger L, Bannister A, Thorpe
58 Koonin EV, Wolf YI & Karev GP (2002) The structure of the protein universe and genome evolution. Nature 420, 218–223. K, Chin SF, Daigo Y, Russell P, Wilson A, Sowter HM et al. (2000) Mutations truncating the EP300 acetylase in human cancers. Nat Genet 24, 300–303.
59 Newman ME, Strogatz SH & Watts DJ (2001) Random graphs with arbitrary degree distributions and their applications. Phys Rev E 64, 026118. 60 Watts DJ & Strogatz SH (1998) Collective dynamics of ‘small-world’ networks. Nature 393, 440–442. 70 Okuno M, Kojima S, Matsushima-Nishiwaki R, Tsuru- mi H, Muto Y, Friedman SL & Moriwaki H (2004) Retinoids in cancer chemoprevention. Curr Cancer Drug Targets 4, 285–298. 61 Strogatz SH (2001) Exploring complex networks. Nature 71 Liu H, Dibling B, Spike B, Dirlam A & Macleod K 410, 268–276. (2004) New roles for the RB tumor suppressor protein. Curr Opin Genet Dev 14, 55–64. 62 Erdo¨ s P & Re´ nyi A (1960) On the evolution of Random 72 Joyce D, Albanese C, Steer J, Fu M, Bouzahzah B & graphs. Math Inst Hung Acad Sci 5, 17–60. 63 Dorogovtsev SN, Goltsev AV & Mendes JF (2002)
Pestell RG (2001) NF-kappaB and cell-cycle regulation: the cyclin connection. Cytokine Growth Factor Rev 12, 73–90. Pseudofractal scale-free web. Phys Rev E Stat Nonlin Soft Matter Phys 65, 066122. 64 Va´ zquez A, Pastor-Satorras R & Vespignani A (2002)
73 Hartl M, Bader AG & Bister K (2003) Molecular tar- gets of the oncogenic transcription factor jun. Curr Cancer Drug Targets 3, 41–55. Large-scale topological and dynamical properties of the Internet. Phys Rev E Stat Nonlin Soft Matter Phys 65, 066130. 65 Palla G, Derenyi I, Farkas I & Vicsek T (2005) Unco- 74 Pelengaris S & Khan M (2003) The many faces of c-MYC. Arch Biochem Biophys 416, 129–136.
75 Sunters A, Thomas DP, Yeudall WA & Grigoriadis AE (2004) Accelerated cell cycle progression in osteoblasts overexpressing the c-fos proto-oncogene: induction of cyclin A and enhanced CDK2 activity. J Biol Chem 279, 9882–9891. vering the overlapping community structure of complex networks in nature and society. Nature 435, 814–818. 66 Radicchi F, Castellano C, Cecconi F, Loreto V & Parisi D (2004) Defining and identifying communities in net- works. Proc Natl Acad Sci USA 101, 2658–2663. 67 Newman M (2002) Random graphs as models of net-
FEBS Journal 272 (2005) 6423–6434 ª 2005 The Authors Journal compilation ª 2005 FEBS
6434
works. Handbook of Graphs and Networks (Bornholdt, S & Schuster, HG, eds). Wiley-VHC, Weinheim.