doi:10.1046/j.1432-1033.2002.03227.x
Eur. J. Biochem. 269, 5088–5100 (2002) (cid:1) FEBS 2002
The inhibitory region of troponin-I alters the ability of F-actin to interact with different segments of myosin
Valerie B. Patchell1, Clare E. Gallon2, Matthew A. Hodgkin3, Abdellatif Fattoum4, S. Victor Perry1 and Barry A. Levine1,2 1Department of Physiology, School of Medicine and 2School of Biosciences, University of Birmingham, Birmingham, UK; 3School of Biological Sciences, University of Warwick, Warwick, UK; 4CRBM, CNRS, INSERM U249, F-34090 Montpellier, France
tropomyosin strengthens
the myosin peptides do not bind in an identical manner to F-actin. It is concluded that the binding of the inhibitory region of troponin I to F-actin produces a conformational change in the actin monomer with the result that inter- action at different locations of F-actin is impeded. These observations are interpreted to indicate that a major conformational change occurs in actin on binding to troponin I that is fundamental to the regulatory process in muscle. The data are discussed in the context of tropo- myosin’s ability to stabilize the actin filament and facilitate the transmission of the conformational change to actin monomers not in direct contact with troponin I.
Keywords: Cardiac troponin I, tropomyosin, myosin pep- tides, actin, conformational change.
Peptides corresponding to the N-terminus of skeletal myosin light chain 1 (rsMLC1 1–37) and the short loop of human cardiac b-myosin (hcM398–414) have been shown to interact with skeletal F-actin by NMR and fluorescence measurements. Skeletal the binding of the myosin peptides to actin but does not interact with the peptides. The binding of peptides cor- responding to the inhibitory region of cardiac troponin I (e.g. hcTnI128–153) to F-actin to form a 1 : 1 molar complex is also strengthened in the presence of tropomyo- sin. In the presence of inhibitory peptide at relatively lower concentrations the myosin peptides and a troponin I peptide C-terminal to the inhibitory region, rcTnI161–181, all dissociate from F-actin. Structural and fluorescence evidence indicate that the troponin I inhibitory region and
possesses properties that are very similar to the intact molecule in that it binds to troponin C, and in the presence of tropomyosin the inhibition of the MgATPase of actomyosin by the peptide is markedly increased [7]. The inhibitory peptide in the presence of tropomyosin is about 50% as effective as the intact TnI molecule when assayed under similar conditions. Only about half of the residues of IP, as originally isolated, appear to be essential for this property because a synthetic duodecapeptide comprising residues 104–115 (short IP) has equivalent inhibitory activity [8]. Recent evidence suggests that additional regions of TnI, C-terminal to the IP, may be required to obtain inhibitory activity equal to the intact molecule [9,10].
The property of troponin I (TnI) of being able to inhibit the MgATPase of actomyosin in a manner that can be neutralized by the calcium-binding protein troponin C in the presence of calcium ions suggests that TnI occupies a key position in the regulation of contraction in striated muscle. In the absence of tropomyosin and the other components of the troponin complex, TnI inhibits the MgATPase of actomyosin maximally when there is approximately one molecule of TnI per actin monomer [1,2]. This implies that TnI prevents the interaction of actin with the myosin head that leads to the activation of the MgATPase. In the presence of tropomyosin, the inhibitory influence of TnI is much increased and the maximum effect is obtained when the stoichiometry approaches one mole- cule of TnI to seven actin monomers [1–5]. When troponin C and troponin T are absent this inhibition is calcium insensitive [6] but otherwise corresponds to the (cid:1)off(cid:2) state in intact muscle.
The region of rabbit fast skeletal TnI represented by residues 96–116, known as the inhibitory peptide (IP),
The mechanism of action of TnI on the regulation of the contractile process is not as yet understood (see [11] for a review). Despite the inhibitory properties of TnI the current view is that tropomyosin regulates the actomyosin ATPase in situ by a steric mechanism [12–14] and it has been suggested that the role of TnI is to induce the binding of tropomyosin to actin [3]. Nevertheless the ability of TnI to bind to actin must be of special significance, as by blocking the binding site it could prevent the interaction with myosin that leads to the activation of the MgATPase. Alternatively binding could involve an allosteric mechanism whereby a conformational change is induced in the actin monomer that results in regions elsewhere on the molecule no longer being able to interact with myosin to activate the MgATPase. Any proposed mechanism must explain the ability of tropo- myosin to extend the inhibitory activity of the troponin I molecule from one to seven actin monomers.
Correspondence to S. V. Perry, Department of Physiology, School of Medicine, University of Birmingham, Birmingham B15 2TT. Fax: + 44 121414 6919, Tel.: + 44 121414 6930, E-mail: S.V.Perry@bham.ac.uk Abbreviations: IP, inhibitory peptide; TnI, troponin I; ATPase, adenosinetriphosphatase; MLC1, myosin light chain 1; IAEDANS, 5-((((2-iodoacetyl)amino)ethyl)amino)napthalene-1-sulfonic acid; SPR, surface plasmon resonance (Received 14 June 2002, revised 19 August 2002, accepted 5 September 2002)
F-actin interactions inhibited by Troponin-I (Eur. J. Biochem. 269) 5089
(cid:1) FEBS 2002
TnI. The myosin peptides are displaced from F-actin by the indeed their binding is IP but not by tropomyosin; strengthened in the presence of the latter protein. Evidence is provided for the induction of conformational changes in at least two regions of the actin molecule on binding the inhibitory domain of TnI to a third independent site. These observations have important significance for understanding the role of TnI in the regulation of contraction in striated muscle.
Some aspects of this work have been briefly described in
abstract form [26].
M A T E R I A L S A N D M E T H O D S
Peptides
in altered kinetic properties of
The nature of the interaction of the myosin head with actin is still a matter for discussion but it is clearly complex and may involve more than one actin monomer (for review see [15]). The major contacts of myosin with actin appear to involve several regions of the myosin heavy chain. It is considered that there is a large primary contact site on the surface of actin flanked on three sides by additional contacts involving myosin surface loops [16]. One of these loops, Pro402–Lys415, is modelled as interacting with actin near residues 331–332 [16] at the junction of subdomains 1 and 3 of actin and appears to be important for normal muscle activity. Deletion of this loop region resulted in the loss of strong binding of myosin to actin [17] while a single amino acid residue change, ArgfiGln, in this loop region of the b-chain of human cardiac myosin is associated with familial hypertrophic cardiomyopathy [18,19] and has been reported to result the myosin subfragment 1 ATPase [20].
The N-terminal region of the myosin light chain (MLC1), residues 1–37, was prepared as described by Henry et al. [27]. The peptides encompassing the inhibitory region of human cardiac TnI, hcTnI128–153, dansylated hcTnI128– 153 (T128 replaced by a dansyl group), hcTnI136–148 and the other peptides used in this study (Table 1) were synthesized by Alta Bioscience (Birmingham University) using Fmoc polyamide chemistry and purified as described previously [28]. The peptide comprising residues 398–414 of human cardiac b-myosin was synthesized by Syntem (Montpellier) and purified as reported previously [29]. The composition and purity of all peptides was confirmed by NMR and mass spectral analysis.
Muscle proteins
Although there is no doubt that tropomyosin moves on contraction it is difficult, in view of the somewhat limited knowledge of the nature of the actin–myosin interaction, to decide on the role of actin in the activation process. X-ray analysis provides some evidence for movement of the actin domains during contraction [21] and it is likely that in model systems using mutant proteins the movement of tropo- myosin observed in the presence of myosin and troponin is a consequence of conformational changes in actin [22,23]. The binding of ligands at discrete and specific binding sites on actin during the contractile cycle would be expected to induce conformational changes that influence its interaction with myosin. Cross linking studies with the zero length carbodiimidate reagent specific for lysine–carboxylate con- tacts suggest that one such ligand, TnI, binds close to the region represented by residues 1–12 of actin [24]. Proton MR studies have indicated that IP interacts with residues 1–7 and 24–25 of the N-terminal region of actin [25]. These observations and the fact that only about half of the residues of the IP are required for inhibitory activity suggest that the interaction of only a small region of TnI with the N-terminal region of actin is the minimum requirement to prevent activation of the myosin MgATPase.
Freeze dried actin prepared by the method of Spudich and Watt [30] was dissolved in 5 mM triethanolamine/HCl, pH 8.0, 0.2 mM CaCl2, 0.2 mM ATP, 0.2 mM dithiothreitol, and dialysed for 3 h against the same buffer until fully depolymerized. It was then centrifuged at 30 000 g for 30 min and the concentration of the G-actin in the supernatant determined by measuring absorbance at 290 nm using an absorption coefficient of 0.63 mgÆ mL)1Æcm)1. The G-actin was polymerized by making the solution 2 mM with respect to MgCl2 and 50 mM with respect to KCl. The F-actin was then dialysed overnight against several changes of 5 mM sodium phosphate buffer, pH 7.0, in H2O or [2H]2O. F-actin–tropomyosin complex was made by adding G-actin prepared as described above to
To throw light on the role of TnI and its relation to that of tropomyosin in the regulatory process we have studied how the actin-binding properties of peptides representing regions of the myosin molecule are affected by the interaction of actin with peptides incorporating the inhibitory domain of
Table 1. Peptides used in this study. Unless otherwise indicated the N-terminus is acetylated and the C-terminus is in the amide form. The N-terminus of the long MLC1 peptide is trimethylalanine. The trimethylalanine of wild type MLC 1–13 was replaced by N-acetyl alanine. The HA peptide corresponds to the well characterized immunodominant epitope of influenza haemagglutinin, residues 306–318. TnI numbering based on N-acyl terminus as occurs in vertebrate proteins and not methionine as occurs in recombinant TnI.
Name Sequence
hcTnI128–153 hcTnI128–147 (IP) hcTnI136–147 (short IP) rcTnI161–181 (C-terminal to IP) hcTnI161–181 (C-terminal to IP) hcM398–414 (myosin loop) rsMLC1 1–37 (MLC1) rsMLC1 1–13 (MLC1) HA306–318 (HA peptide) TQKIFDLRGKFKRPTLRRVRISADAM TQKIFDLRGKFKRPTLRRVR GKFKRPTLRRVR AKETLDLRAHLKQVKKEDTEK AKESLDLRAHLKQVKKEDTEK GLCHPRVKVGNEYVTKG APKKDVKKPAAAAAAPAPAPAPAPAPAKPKEEKIDL APKKDVKKPAAAA PKYVKQATLKLAT
5090 V. B. Patchell et al. (Eur. J. Biochem. 269)
(cid:1) FEBS 2002
a stock solution of 1 mgÆmL)1 rabbit skeletal tropomyosin in 50 mM Tris/HCl, pH 7.6, 100 mM KCl, to give a final concentration of 2.5 mgÆmL)1 actin, 0.5 mgÆmL)1 tropo- myosin, i.e. a molar ratio of actin : tropomyosin of approximately 7 : 1. The complex was dialysed into several changes of 5 mM phosphate buffer, pH 7.0, in H2O or [2H]2O. Complex formation and the absence of free protein was confirmed by comparison of the electrophoretic patterns of the free proteins by electrophoresis on 10% nondenaturing polyacrylamide gels run in 10% (v/v) glycerol, 25 mM Tris)80 mM glycine, pH 8.3.
analysis to evaluate the association and dissociation rate constants, Ka and Kd respectively, for the binding of the peptide to immobilized F-actin using a BIAcore 3000 system. F-actin or BSA was covalently linked to carboxy- methyldextran surfaces using standard amine coupling. One surface was derivatized in the absence of protein. Following immobilization the chip surfaces were capped with ethanolamine and subject to surface equilibration (BIApplications Handbook, 1993). Non-specific binding was monitored using the control BSA and underivatized flow cells. Sensorgrams were obtained using different immobilization densities and the binding of the TnI inhibitory peptide was assessed at various flow rates (5–30 lLÆmin)1) and over a range of concentrations (1–50 lM). Sensorgrams were analysed using BIAEVALUA TION 3 software taking account of the small amount of nonspecific binding of the TnI peptide to the control surfaces. The association and dissociation rate constants were obtained from these sensorgrams by fitting the experimental data to a model obeying 1 : 1 complex formation and the Langmuir binding isotherm. The apparent equilibrium constant (dissociation constant Kd) was calculated as Kd/Ka. There was no significant change in the Kd derived for the peptide concentrations in the range 1–10 lM. Curve fitting of the dissociation phase for each concentration was also separately carried out as for an AB complex dissociation.
NMR studies
Actin labelled at Cys374 with IAEDANS was prepared according to the method of Miki et al. [31]. F-actin (2 mgÆmL)1) in 5 mM triethanolamine/HCl, pH 8, 0.2 mM ATP, 0.2 mM CaCl2 (Buffer A) to which 50 mM KCl and 2 mM MgCl2 had been added was incubated with 10-fold molar excess of IAEDANS for 2 h at room temperature. The reaction was terminated by the addition of dithiothreitol to 2 mM. The actin was then centrifuged at 100 000 g for 1 h and the pellet resuspended in Buffer A. This was dialysed extensively against Buffer A to remove excess IAEDANS. The concentration of the resulting G-actin was determined using an absorption coefficient of 0.63 mgÆmL)1Æcm)1 at 290 nm. A correction for the IAEDANS contribution at 290 nm was made using absorbance at 290 nm ¼ 0.21 · absorbance at 336 nm, for bound IAEDANS. The concentration of IAEDANS was determined using )1Æcm)1 at 336 nm. The the absorption coefficient of 6100 M labelling was normally 0.8–0.9 molÆmole)1 extent of G-actin. The labelled G-actin was polymerized by making the solution 50 mM with respect to KCl, 2 mM with respect to MgCl2, and stored frozen in aliquots.
Fluorescence measurements
All fluorescence emission spectra were obtained using a Perkin-Elmer LS50B fluorescence spectrometer interfaced to a computer. The excitation wavelength for tryptophan was 280 nm and the IAEDANS probe was excited at 340 nm. The fluorescence emission spectra of the dansylated TnI peptide was recorded between 400 and 550 nm after excitation of the dansyl group at 340 nm. Emission fluorescence intensity values were corrected for the corres- ponding solvent emission fluorescence values and the dilution effects (< 5%) resulting from the titration carried out. The dissociation constants (Kd) for the complexes formed were calculated by using a nonlinear regression procedure fitting the fluorescence data obtained in three separate titrations in each case to a 1 : 1 binding curve in combination with the use of a reciprocal linear plot (Fo)Fmin)/(Fo)F) vs. (concentration of added peptide))1. For all calculations it was assumed that the fractional change in fluorescence was directly proportional to the fraction of the complexes formed. The accuracy of the Kd values was gauged from curve fit obtained, the associated R2 value (> 0.95) and the requirement that iterative fit of the linear representation of the experimental data extrapolated to an intercept value of 1.
Surface plasmon resonance
The NMR spectral assignment of peptide resonances was carried out using standard TOCSY and NOESY proce- dures. Spectra were obtained at 500 MHz on a Bruker spectrometer at a sample temperature of 285K. Titration of the peptides with F-actin was carried out by addition of aliquots of F-actin (10 mgÆmL)1) or F-actin–tropomyosin (5 mgÆmL)1 F-actin). Titration of the inhibitory peptide with F-actin or F-actin–tropomyosin was also carried out by the addition of small aliquots (1–5 lL) of a stock solution of the peptide to 0.5 mL of solution containing F-actin at a concentration of 2.5–4.0 mgÆmL)1. The broad signals of the spectrum of F-actin obtained at these concentrations contributed relatively little to the spectra of the peptides in the presence of actin. Two-pulse spin-echo spectra (1024 transients) were obtained using a (180-t-90-t) sequence with a delay time, t ¼ 60 ms, and an overall interpulse delay of 3 s to enable complete magnetization recovery. Signal amplitude in these experiments is modu- lated by the corresponding coupling constant and relax- ation time of each resonance and is a very sensitive indicator of the effect of binding. As observed in previous studies of actin binding [25,28] interaction results in marked reduction of the bound peptide ligand resonances consistent with the high molecular weight and slow tumbling of the complex. Both direct signal linewidth and the signal intensity in the two-pulse spin-echo spectra were used therefore to evaluate the perturbation resulting from interaction with actin. The spectral changes were also visualized by difference spectra taken at each stage of the titration. Quantification of the binding stoichiometry and affinity of complex formation was confirmed by equilibrium fluorescence measurements and by surface plasmon resonance studies.
Direct binding of the TnI inhibitory peptide to actin was investigated using surface plasmon resonance (SPR)
F-actin interactions inhibited by Troponin-I (Eur. J. Biochem. 269) 5091
(cid:1) FEBS 2002
R E S U L T S
(Table 1) indicates that residues 165–174 represent that part of the peptide rcTnI161–181 whose molecular motions are most restricted by binding to the surface of F-actin.
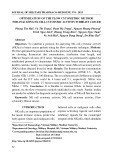
The interaction of the different peptides with F-actin was assayed using a variety of biophysical techniques to characterize their interaction affinity, to determine the nature of the residues involved and the extent of any competition between the peptides on binding. A diagnostic test for the binding of a peptide ligand to F-actin or tropomyosin is the observation of significant broadening of the ligand resonances detected in the NMR spectrum. The flexibility in a peptide ligand is manifest in the narrow line widths of the peptide NMR resonances since linewidth is a monotonic function of the effective correlation time [32]. Upon complex formation the bound groups of the peptide ligand would experience the longer rotational correlation time of the macromolecular assembly and a decrease in segmental mobility. Interaction is therefore apparent from changes in the linewidth of the peptide resonances since complex formation results in an increased relaxation rate due to the longer correlation time of the protein and the motional constraints imposed by binding of the peptide to the protein surface. Spectral linewidth increases on addition of F-actin to inhibitory regions of troponin I and caldesmon have been reported elsewhere [25,33]. Resonance line width changes can also originate, however, from any increase in solution viscosity that significantly alters the rotational diffusion of the ligand. As F-actin solutions have significant viscosity we therefore first studied the effect of an increase in solution viscosity on the linewidth characteristics of the IP. Minimal spectral effects were observed for the hcTnI128– 153 peptide over a concentration range of 0–500 lM in 10% (v/v) deuterated glycerol (MSD Isotopes). These observa- tions indicated that viscosity effects on resonance and linewidth in the peptide spectrum were not significant. Evidence for the absence of viscosity effects on peptide resonance and linewidth as a result the presence of actin were obtained by comparing the spectrum of a control peptide, the HA peptide (Table 1), in the presence and absence of F-actin (Fig. 1). The absence of detectable alterations in the spectrum of the peptide indicated that any changes in viscosity due to the presence of F-actin have negligible effects on the rotational diffusion in solution and hence linewidth of the peptide resonances. These results (Fig. 1) also served as control data indicating that there was no nonspecific HA peptide interaction with F-actin.
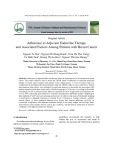
The possibility of nonspecific binding of the TnI peptides to protein was examined using BSA. As shown in Fig. 2 the presence of an equimolar concentration of the protein did not give rise to any significant changes in the spectrum of peptide hcTnI128–147 indicating the absence of nonspecific interaction with the protein. Clearly resolved in the spectra is the composite signal of the five Arg dCH2 groups of the inhibitory peptide ((cid:2) 3.2 p.p.m., Fig. 2) that, as in the case of rcTnI161–181 peptide (Fig. 1), can be used to monitor the effect of F-actin on the spectrum of the peptide. The arginine residues of the IP are located in the central portion of the region associated with inhibitory activity.
Interaction of the cardiac inhibitory peptide region with F-actin
To investigate the interaction between actin and the inhibitory region of TnI, we monitored the NMR spectral
Inspection of the spectrum of the HA peptide in the presence of F-actin also indicates that although interaction did not occur, there is a detectable contribution to signal the relatively high intensity deriving from F-actin at concentrations of the protein used in this control experiment (Fig. 1). The broad signals of the spectrum of F-actin did not, however, mask the resonances of other peptides used in this study due to the lower protein concentrations required to induce spectral broadening. Figure 1 shows that specific resonance broadening occurred during titration of the rcTnI161–181 peptide with F-actin indicating complex formation characterized by fast exchange between the free and actin-bound states of the peptide. Most markedly altered by interaction with F-actin are the sidechain signals of Arg168, His170, Gln173 and the composite methyl group resonance while the sidechain resonance deriving from the five lysine residues of the peptide remained relatively unperturbed. Correlation with the peptide sequence
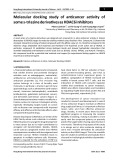
Fig. 1. Proton magnetic resonance spectra demonstrating that the presence of F-actin does not result in broadening of signals of peptide in the absence of complex formation whilst interaction with F-actin results in specific spectral changes. Spectra determined in 5 mM sodium phosphate buffer, pH 7.4, T ¼ 285K. (A) HA306–318 peptide, 200 lM, (B) HA306–318 peptide, 200 lM, in the presence of F-actin, 200 lM. The spectral region between 1.2 and 1.4 p.p.m. under these conditions is shown on an expanded scale as inset. The fine structure for the HA306–318 peptide resonances is retained indicating lack of interaction with F-actin and the absence of broadening due to non- specific viscosity effects over the actin concentration range studied (0–8 mgÆmL)1). Peak at 1.34 p.p.m. in inset B is due to actin. (C) rcTnI161–181 peptide, 200 lM. (D) rcTnI161–181 peptide, 200 lM, in the presence of F-actin, 35 lM. Specific resonance broadening occurs during titration of the peptide rcTnI161–181 with increasing concen- trations of F-actin indicating complex formation characterized by fast exchange between the free and actin-bound states of the peptide population. The residues whose signals are most markedly affected by interaction (e.g. Arg168, His170 and Gln173) indicate the region of the peptide whose molecular motions are most restricted by binding to the surface of F-actin.
5092 V. B. Patchell et al. (Eur. J. Biochem. 269)
(cid:1) FEBS 2002
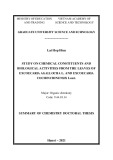
Fig. 2. Proton magnetic resonance spectra demonstrating the absence of non-specific interaction of the TnI inhibitory peptide with BSA. Spectra determined in 5 mM sodium phosphate buffer, pH 7.4, T ¼ 285K. (A) peptide hcTnI128–147, 120 lM. (B) BSA, 120 lM. (C) 120 lM peptide hcTnI128–147, in the presence of 120 lM BSA. This spectrum is indistinguishable from the algebraic sum of the individual spectra (A + B) indicating lack of nonspecific interaction with BSA. Signals deriving from the hcTnI128–147 are labelled.
changes during titration with F-actin of two peptides, hcTnI128–153 and hcTnI136–147, corresponding to over- lapping regions of human cardiac TnI (Table 1). Peptide hcTnI128–153 comprises the inhibitory region of TnI with the additional six residue C-terminal sequence, ISADAM, which is present in all of the mammalian isoforms of TnI sequenced so far and may be of functional significance. The smaller peptide, hcTnI136–147 represents the region cor- responding to the minimal inhibitory sequence of TnI [8].
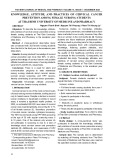
in the range 1–10 lM gave an off rate constant of (cid:2)103Æs)1 consistent with the NMR observation of fast exchange on the relaxation time scale. The equilibrium constant for the interaction was obtained by fitting the sensorgram data to a model employing 1 : 1 complex formation. The value of the dissociation constant derived, 3 lM (Table 2) was consistent with an analysis of the dependence of the equilibrium plateau signal on the concentration of the TnI inhibitory peptide.
Tropomyosin enhances the affinity of the TnI inhibitory peptide for F-actin
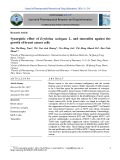
Addition of F-actin to the human cardiac inhibitory peptide in molar excess produced a marked reduction in resonance intensity of the side chain groups of the free peptide, indicating that interaction had occurred (Fig. 3). The progressive variation in linewidth and intensity for the peptide signals occurred in the absence of any chemical shift change as is characteristic of relatively rapid exchange on the relaxation time scale [32,34]. The marked reduction of the peptide ligand resonance intensity upon addition of F-actin is consistent with the high molecular weight and slow tumbling of the complex formed. Similar results were reported earlier [25] for the binding to F-actin by the inhibitory peptide from rabbit fast skeletal muscle TnI (residues 96–116) that differs from the homologous human cardiac peptide by four conservative replacements. Since almost all the resonances of the peptide hcTnI128–153 were affected in the presence of F-actin (Fig. 3) the extent of the spectral changes suggests that the entire length of the peptide is constrained by attachment to the actin filament. The kinetics of the interaction of the TnI inhibitory region with actin were characterized using surface plasmon resonance to monitor binding to immobilized F-actin. The sensorgrams obtained recorded the association and disso- ciation phases of the interaction (Fig. 4A). Analysis of the dissociation phase for hcTnI128–153 peptide concentrations
Titrations of F-actin with peptide hcTnI128–153 were carried out with the molar ratio peptide : actin varied over the range of 1 : 1 to 6 : 1 in the presence and absence of tropomyosin. As shown in Fig. 4B, a steady change was observed in the signal corresponding to the side chains of arginine as the molar ratio of peptide to actin was increased. The broad resonance linewidth of the bound peptide reduced to that of the free peptide as the ratio of the bound to free peptide decreased during titration with the peptide. In the presence of tropomyosin the continuous reversion of the signal lineshape to that of the free peptide is found to saturate at close to a 1 : 1 molar ratio. In the presence of tropomyosin, saturation occurred at a lower peptide : actin ratio than was the case in the absence of tropomyosin. (Fig. 4B). The rate of the exchange process between actin- bound and free peptide is therefore altered by the presence
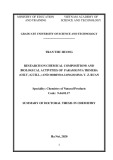
Fig. 3. Interaction of the human cardiac TnI inhibitory peptide with F-actin illustrated by proton magnetic resonance spectroscopy to show the residues involved in complex formation. Spectra determined in 5 mM sodium phosphate buffer, pH 7.2, T ¼ 293K. (A) peptide hcTnI128– 153, 200 lM, (B) hcTnI128–153, 200 lM, in the presence of F-actin, 18 lM. (C) hcTnI128–153, 200 lM, in the presence of F-actin, 50 lM. (D) difference spectrum, A–C, highlighting the residues whose side- chain signals are perturbed by binding to F-actin. Signals of the hcTnI128–153 are labelled. Complex formation characterized by rel- atively fast exchange between the free and actin-bound states of the peptide population is indicated by the resonance broadening that occurs during titration with increasing concentrations of F-actin. Note that the lack of spectral change for the signal originating from the buffer (*) confirms the absence of nonspecific viscosity effects.
F-actin interactions inhibited by Troponin-I (Eur. J. Biochem. 269) 5093
(cid:1) FEBS 2002
M
)1Æs with curve fitting of the association phase.
Fig. 4. Interaction of the TnI inhibitory peptide with F-actin determined by surface plasmon resonance (25 mm Hepes, pH 7.4, 150 mM NaCl) and by proton magnetic resonance spectroscopy (5 mm sodium phosphate buffer pH 7.2). (A) Sensorgrams showing the kinetics of binding of the human cardiac TnI128–153 inhibitory peptide to immobilized F-actin at the peptide concentrations indicated. The fit of these data to 1 : 1 complex formation yielded a dissociation constant of 3 ± 2 lM for the F-actin complex (Table 2). (B) The cardiac TnI inhibitory peptide forms a complex with F-actin whose affinity is enhanced by tropomyosin as shown by the influence of tropomyosin on the change in resonance line width of the composite signal of the dCH2 groups of the arginine residue side chains of the inhibitory peptide as a function of the peptide : actin molar ratio. j, F-actin-tropomyosin (molar ratio 7 : 1), m, F-actin. The concentration of actin was in each case was 40 lM with < 5% dilution during titration with the inhibitory peptide up to a concentration of 160 lM, pH 7.2. Saturation of the linewidth change at lower molar ratios of actin–tropomyosin compared to actin alone is indicative of the enhanced affinity of F-actin for the peptide in the presence of tropomyosin. The dotted lines show that in the presence of tropomyosin the return to the linewidth of the free peptide occurred at approximately a 1 : 1 ratio of peptide : F-actin–tropomyosin indicative of 1 : 1 complex formation.
)6)
Table 2. Dissociation constants for the different peptide complexes with F-actin determined from fluorescence and surface plasmon resonance meas- urements. The Kd values quoted were derived from the nonlinear regression fit (GraphPad Prism) of the fluorescence data to a 1 : 1 binding curve for peptide–actin complex formation. The corresponding standard errors are quoted. The Kd obtained for the myosin loop peptide, hcM398–414, upon interaction with F-actin is consistent with the value previously reported using a peptide labelled at Cys400 [29]. The Kd quoted for the unlabelled TnI inhibitory peptide was obtained by curve fitting of the dissociation phase of the SPR data to derive the off-rate constant and an on-rate of 5 · 108
)6)
F-actin–tropomyosin (M F-actin (M
13 ± 3
Table 2). Dansyl emission was unaltered in the presence of tropomyosin alone while competition with unlabelled IP reversed the enhancement seen in the presence of F-actin or F-actin–tropomyosin in a manner consistent with the derived affinity of the IP (Table 2). These data confirmed that the IP formed a 1 : 1 complex with F-actin the affinity of which is enhanced by tropomyosin.
Interaction of the myosin light chain N-terminal peptide with actin and reversal by the TnI inhibitory peptide
of tropomyosin. The observation that in the presence of tropomyosin the signal linewidth returned to that of the free peptide at a 1 : 1 ratio and altered more dramatically at low peptide : actin ratios indicates a retarded exchange process and tighter binding of hcTnI128–153 to actin–tropomyosin. In this intermediate exchange range, the rate of the exchange process also contributes to the relaxation process and resonance linewidths are expected on this exchange time- scale to revert to those of the free peptide in a manner dependent upon the exchange off-rate constant [34–36]. The NMR data are therefore consistent with a 1 : 1 complex formation between the IP and actin–tropomyosin and an increase in affinity for actin resulting from the presence of tropomyosin.
To supplement the binding data obtained from the NMR investigations fluorescence studies using dansylated hcTnI128–153 were undertaken to evaluate binding stoi- chiometry and affinity. The intrinsic fluorescence emission of actin tryptophan residues was not significantly altered by the presence of the IP whereas titration of the dansylated peptide with F-actin or F-actin–tropomyosin resulted in enhancement of the emission intensity of the dansyl group (Fig. 5). The titration data gave excellent fits to a 1 : 1 binding curve and provided direct evidence of a significant increase in affinity in the presence of tropomyosin (Fig. 5,
The effect of the IP on the interaction with F-actin of the myosin light chain peptides, MLC1 1–37 and MLC1 1–13 was studied in view of the evidence that this region, localized to the head of the myosin molecule, can bind to the C-terminal of actin [15,37,38]. The MLC1 peptides were found to bind to F-actin both in the absence and presence of tropomyosin with the interaction resulting in the reduction of the NMR resonance intensity for the majority of the peptide sidechain signals (Fig. 6). Tropomyosin alone did not affect the MLC1 peptide spectra nor did it result in the dissociation of the MLC1 peptides from F-actin. On the contrary it increased their affinity. The progressive changes observed with increasing concentrations of F-actin reflected complex formation in fast exchange and indicated the
Dansylated inhibitory peptide, hcTnI128-153 Inhibitory peptide, hcTnI128–153 Myosin loop peptide, hcM398–414 28 ± 5 3 ± 2 32 ± 5 18 ± 5
5094 V. B. Patchell et al. (Eur. J. Biochem. 269)
(cid:1) FEBS 2002
Fig. 5. The TnI inhibitory peptide forms a 1 : 1 complex with F-actin whose affinity is enhanced by tropomyosin as indicated by fluorescence emission spectra. The experimental conditions were 5 mM phosphate buffer, pH 7.2, T ¼ 293K. The relative fluorescence intensity is shown in arbitrary units. Excitation was at 340 nm and the spectra were recorded from 420 to 600 nm. (A) Fluorescence emission spectra of dansylated TnI inhibitory peptide complexed with F-actin-tropomyosin. Titration of the dansylated TnI inhibitory peptide with F-actin or F-actin–tropomyosin (molar ratio of actin : tropomyosin of (cid:2) 7 : 1) resulted in enhancement of the fluorescence emission intensity of the dansyl group. Shown are fluorescence emission spectra of 10 lM dansylated hcTnI128–153 in the presence of increasing concentrations of F-actin–tropomyosin (2, 5, 20 and 60 lM actin, in traces 2–5, respectively). Competition by 2 lM unlabelled hcTnI128–153 in the presence of 60 lM actin led to a reduction in emission enhancement, trace 6, consistent with the dissociation constant (Table 2) derived from curve fitting of the data to 1 : 1 complex formation with F-actin–tropomyosin. (B) Fluorescence changes observed upon titration of 10 lM dansylated hcTnI128–153 with F-actin (j), or F-actin–tropo- myosin (m) (molar ratio of actin : tropomyosin of (cid:2) 7 : 1). The binding curves shown are the nonlinear regression fits obtained (R2 > 0.97) for 1 : 1 complex formation using data obtained in three separate titrations in each case.
involvement of the N-terminal residues of MLC1 in actin binding both in the absence and presence of tropomyosin. (Fig. 6i).
Addition of hcTnI128–153 at a much lower relative con- centration than either MLC1 peptide brought about disso- ciation of the latter from F-actin and F-actin–tropomyosin.
Fig. 6. The interaction of the N-terminal region of MLC1 with F-actin is weakened by the binding of the TnI inhibitory region. Spectra determined in 5 mM sodium phosphate buffer, pH 7.2, T ¼ 293K. (i) Proton magnetic resonance spectra of the MLC1 1–13 peptide during titration with F-actin and upon subsequent addition of hcTnI136–147. (A) MLC1 1–13 peptide, 200 lM, (B) MLC1 1–13 peptide, 200 lM, in the presence of F-actin, 60 lM. (C) As for (B) but in the presence of 55 lM hcTnI136–147. (D) MLC1 1–13 peptide as in (A), but spectrum acquired by the use of a two- pulse spin-echo sequence. (E) MLC1 1–13 peptide in the presence of F-actin as in (B) but spectrum acquired by the use of a two-pulse spin-echo sequence. Spectral accumulation in this way is sensitive to even small changes in signal linewidth resulting in readily detectable changes in intensity. The linebroadening of the MLC1 peptide signals resulting from interaction with F-actin is markedly diminished by the presence of hcTnI136–147. (ii) Spectra of MLC1 1–37 during titration with F-actin and upon subsequent addition of hcTnI128–153. (A) 200 lM peptide MLC1 1–37, in the presence of 25 lM F-actin. (B) As for A and upon addition of 10 lM cardiac inhibitory peptide, hcTnI128–153. (C) Difference spectrum, B-A, showing the sidechain groups of MLC1 1–37 whose resonances displayed actin-dependent broadening that is reversed by the presence of the inhibitory peptide. The increase in signal intensity of the proton NMR spectra of the MLC1 peptide indicates that its interaction with F-actin is abolished in the presence of the inhibitory peptide.
F-actin interactions inhibited by Troponin-I (Eur. J. Biochem. 269) 5095
(cid:1) FEBS 2002
alternative value for the binding affinity using as a readout the spectral properties of a probe located on subdomain 1 of actin in the vicinity of the presumed binding site. Addition of hcM398–414 led to quenching of IAEDANS emission with an overall intensity reduction of some 3% at saturation (Fig. 7B). Comparable quenching effects were observed in the presence of tropomyosin (1 : 7, tropomyosin : actin) while the titration data were consistent with 1 : 1 complex formation as judged by the goodness of fit of the data to a 1 : 1 binding curve. The derived Kd values were similar to those obtained by monitoring the actin–tryptophan fluor- escence changes on the addition of the hcM398–414 peptide (Table 2).
This was clearly indicated by the reversal of the actin- associated spectral changes for resonances unique to the MLC1 peptide, e.g. the trimethylalanine signal (Fig. 6ii). Taken together these results suggested that, while tropo- myosin on its own did not hinder the binding of MLC1 to actin, the dissociation of the MLC1 1–37 by the IP binding to F-actin or F-actin–tropomyosin may have resulted from a conformational change in subdomain 1 of actin rather than as a consequence of competition for binding at identical or overlapping sites. The possibility that the IP produced its effect by inducing a conformational change in actin was explored further by studying its influence on the binding of the loop peptide hcM398–414. This region of the myosin molecule is believed to dock at the junction between subdomain 1 and 3 of actin [16,39] whereas the LC1 peptide binds close to the C terminus of actin.
Interaction of the myosin loop peptide, residues 398–414, with F-actin occurs at a region that does not overlap with the binding site for the TnI inhibitory peptide
Titration of IAEDANS-labelled F-actin with the inhi- bitory peptide, hcTnI128–153 was also carried out in the absence and presence of tropomyosin. Under both condi- tions the inhibitory peptide led to enhancement of the IAEDANS emission ((cid:2) 16% enhancement at saturation, Fig. 7B) with a shift of the fluorescence emission maximum from 475–470 nm. These titration data were consistent with 1 : 1 complex formation and yielded Kd values similar to those obtained using unlabelled F-actin (Table 2). The observations that binding of the TnI inhibitory region led to fluorescence enhancement and a blue-shift of the emission maximum are consistent with the IAEDANS label on Cys374 experiencing a less polar environment upon complex formation. This contrasts with the change in environment of the label upon interaction of actin with the hcM398–414 myosin loop peptide. The markedly different response of the IAEDANS label to the binding of the two peptides provides direct experimental evidence that the myosin loop and the TnI inhibitory peptides bind on different sites on F-actin.
Characterization of the interaction of cardiac b-myosin residues 398–414 with F-actin was carried out so as to explore any influence of tropomyosin on the inhibitory region of TnI. The binding affinity of the myosin loop peptide hcM398–414 to F-actin and F-actin–tropomyosin was initially determined from the changes in intrinsic tryptophan fluorescence of F-actin observed upon titration with the peptide. The dissociation constant for the F-actin complex formed was calculated using a nonlinear regression procedure in each case to fit the data to a 1 : 1 binding curve (Fig. 7A). The Kd value obtained in the presence of tropomyosin was 18 ± 4 lM. The affinity of the complex with the peptide was higher than that found for F-actin alone (Table 2) indicating that tropomyosin enhanced the binding of hcM398-414 to F-actin.
Resolution of the nature of the residues of the hcM398–414 myosin loop peptide involved in interaction with F-actin was achieved by monitoring the NMR spectral changes resulting from complex formation in the presence and absence of tropomyosin. As was the case with the other peptides used in this study that bound to F-actin and F-actin–tropomyosin, peptide hcM398–414 did not interact with tropomyosin alone under the conditions described. Titration of peptide hcM398–414 with F-actin resulted in marked spectral broadening of the readily identifiable sidechain resonances
Since the loop region of the myosin head, comprising residues 398–414, is believed to interact near the C-terminus of actin, F-actin labelled with 1,5 IAEDANS at Cys374 was titrated with increasing concentrations of the hcM398-414 peptide. This was undertaken in order to determine an
Fig. 7. The binding of hcM398–414 and hcTnI128–153 to F-actin as monitored by intrinsic (A) and extrinsic (B) fluorescence emission changes. Experimental conditions were 5 mM sodium phosphate buffer, pH 7.4, T ¼ 293K. (A) Intrinsic tryptophan fluorescence emission spectra of the F-actin–tropomyosin complex during titration with hcM398–414. The inset shows the decrease in fluorescence emission observed as a function of increasing hcM398–414 concentration (0–50 · 10)6 M). The curve shown is the fit of the data to 1 : 1 complex formation at an F-actin concen- tration of 5 · 10)6 M. (B) Variation of the IAEDANS emission upon titration of Cys374-labelled F-actin with hcM398–414 (m) or hcTnI128–153 (j), at a concentration of F-actin equal to 5 · 10)6 M. The curves shown are the nonlinear regression fits to 1 : 1 complex formation. The derived dissociation constants are reported in Table 2.
5096 V. B. Patchell et al. (Eur. J. Biochem. 269)
(cid:1) FEBS 2002
and hcTnI136–147
of His401, Arg403, Asn408, Tyr410 and Thr412 that indicated complex formation with F-actin (Fig. 8). Less notably perturbed is the sidechain signal of Val411. The nature of the residues affected was unchanged upon interac- tion with F-actin–tropomyosin while the increased broaden- ing effects observed at low peptide : actin in the presence of tropomyosin are consistent with an enhanced affinity result- ing from a decrease in peptide dissociation kinetics.
The binding of the TnI inhibitory region simultaneously displaces peptides bound at nonoverlapping sites on actin
Titration of the hcTnI128–153 inhibitory peptide into this system up to a concentration equimolar to that of F-actin resulted in the dissociation of both hcM398–414 and rcTnI161–181 from actin whether in the absence or presence of tropomyosin (Fig. 9i). This dissociation was also induced by the shorter peptides encompassing the TnI inhibitory region, hcTnI128–147 although consistent with its lower actin affinity (Table 2), higher hcTnI136–147 peptide : actin ratios were required to achieve dissociation of hcM398–414 and rcTnI161–181. Their simultaneous displacement was readily seen from the reappearance of the signals unique to these peptides that had been broadened by their interaction with F-actin in the absence of the inhibitory peptide (Fig. 9i). At the same time signals unique to the IP broadened in the manner described above (Figs 3 and 4). Since the TnI inhibitory peptide forms a 1 : 1 complex with F-actin these observations indicate that the association of the TnI inhibitory region with F-actin antagonized the binding of the myosin loop peptide and rcTnI161–181 to their individual binding sites on actin. These effects cannot be ascribed to site competition and simple steric displacement.
Competition experiments were carried out to monitor the ability of different peptides to simultaneously bind to F-actin. The peptide derived from TnI, rcTnI161–181, bound to F-actin in the presence or absence of tropomyosin without displacing the myosin loop peptide (Fig. 9i). This TnI peptide represents a region C-terminal to the IP of TnI and has been proposed as an additional actin-binding site [9,10]. Binding of the rcTnI161–181 peptide was judged from the spectral broadening of its clearly distinguishable sidechain signals (e.g. His170, c.f. Fig. 1) that occurred without any concurrent changes in the resonances unique to the hcM398–414 myosin loop peptide (His401 and Tyr410, c.f. Fig. 8). Competition from the myosin loop peptide with peptide rcTnI161–181 for interaction with actin would have resulted in its displacement and the consequent appearance of signals broadened as a consequence of interaction with F-actin. These results indicated that the myosin loop peptide and rcTnI161–181 are bound simultaneously at different sites on actin as might be expected from the differences in the composition of the two peptides.
Since the binding of the TnI inhibitory peptide appeared to induce a conformational change in the actin molecule that altered the ability of F-actin to interact with different segments of myosin we went on to monitor the binding of hcM398–414 at an actin : Tm : TnI peptide ratio of 7 : 1 : 1 over a range of myosin peptide concentrations. Figure 9ii presents data obtained using a myosin peptide concentration of 50 lM. The presence of the TnI inhibitory peptide (0.55 lM) led to a decrease in the amount of myosin peptide bound to F-actin–tropomyosin (with hcM398–414 at (cid:2) 100-fold excess over TnI peptide). This is seen from the
Fig. 8. Proton MR spectral changes upon titration of hcM398–414 with F-actin identifying the residues involved in complex formation. Spectra determined in 5 mM sodium phosphate buffer, pH 7.2, T ¼ 293K. (i) (A) Peptide hcM398–414 (200 lM). (B) In the presence F-actin, 28 lM. (C) Difference spectrum, A-B, highlighting the residues whose sidechain signals are perturbed by binding to F-actin. (ii) as in (i) but spectra acquired by the use of a two-pulse spin-echo sequence. Spectral accumulation in this way distinguishes signals on the basis of their J-coupling patterns and highlights even small changes in signal linewidth resulting in readily detectable changes in intensity. Signals of hcM398–414 are labelled. Complex formation characterized by relatively fast exchange between the free and actin-bound states of the peptide population is indicated by the resonance broadening that occurs during titration with increasing concentrations of F-actin. The unique sidechain resonances of His401, Arg403, Tyr410, Val411 and Thr412 display marked perturbation upon complex formation.
F-actin interactions inhibited by Troponin-I (Eur. J. Biochem. 269) 5097
(cid:1) FEBS 2002
change in the myosin peptide signals, for example, Arg403, Val411 and Thr412 that, as highlighted by difference spectroscopy (Fig. 9ii), revert towards those of the free peptide in the presence of hcTnI128–147 at an actin : Tm : TnI peptide ratio of 7 : 1 : 1. These observa- tions reinforce the suggestion that conformational changes which occur when one molecule of troponin I interacts with the actin monomer are transmitted to other actin monomers in the filament not associated with TnI.
Fig. 9. (i) The TnI inhibitory region displaces both peptide hcM398–414 and peptide rcTnI161–181 that interact concurrently with F-actin at distinct binding locations. The aromatic sidechain NMR resonances are shown since these provide unique reporter signals for each of the peptides. Spectra determined in 5 mM phosphate buffer, pH 7.2, T ¼ 293K. (A) Myosin loop peptide (hcM398–414), 108 lM. (B) hcM398–414, 108 lM in the presence of 74 lM F-actin. The signals of His401 and Tyr410 of the myosin loop peptide are markedly broadened by complex formation. (C) As for (B), but upon the addition of 186 lM rcTnI161–181. Binding of this TnI peptide is indicated by broadening of its His171 resonances. No displacement of the myosin loop peptide has occurred since its signals remain broad. The two peptides are therefore concurrently bound to F-actin. (D) As for (C) but upon titration with inhibitory peptide hcTnI128–153 (here 102 lM). The reappearance of the myosin loop peptide signals and those of rcTnI161–181 indicates their simultaneous displacement by the inhibitory peptide. The signals unique to the inhibitory peptide, Phe132 and 138, are broad indicating that the peptide is bound to F-actin. (ii) The binding of hcM398–414 to F-actin–tropomyosin is altered by the presence of hcTnI128–153 at an actin : Tm : nI inhibitory peptide ratio of 7 : 1 : 1. This is detected by the increased spectral contribution of free hcM398–414 signals clearly identified by difference spectroscopy. The two-pulse spin-echo spectra shown (c.f. Fig. 8ii) were obtained in 5 mM phosphate buffer, pH 7.2, T ¼ 293K. (A) Myosin loop peptide (hcM398–414), 50 lM, (B) as for (A) but in the presence of F-actin–tropomyosin (3.7 lM F-actin). (C) As for (A) but in the presence of an actin : Tm : TnI inhibitory peptide ratio of 7 : 1 : 1 (0.55 lM hcTnI128–153). (D) Difference spectrum (C-B) showing the reappearance of the myosin loop peptide signals.
D I S C U S S I O N
The NMR data clearly indicate that peptides corres- ponding to the N-terminus of myosin LC1 interact speci- fically with F-actin in the absence of inhibitory peptide derived from TnI. This conclusion is consistent with the results of earlier NMR investigations [38,39] and cross linking studies [37,41] that the N-terminal region of skeletal LC1 is one of the sites involved in the interaction of myosin with actin. From these studies and electron microscopy of C-terminally labelled actin [42] it can be concluded that the N-terminus of MLC1 binds close to the C-terminus of actin. The N-terminal region APKK (residues 1–4) of MLC1 appears to be particularly important since modification of these residues by recombinant DNA technology results in changes in the kinetics of the actomyosin MgATPase [41]. Other residues at the N-terminus of MLC1 are involved in binding and have indeed been shown to be important for the activity of cardiac myosin. A peptide corresponding to residues 5–14 of human ventricular MLC1 increased the contractility of intact and skinned human heart fibres [43] and a similar peptide added to rat cardiac myofibrils induced a supramaximal increase in the MgATPase activity at submaximal calcium levels [44].
The TnI inhibitory region is an early example of a growing family of short peptide sequences capable of emulating the ability of the parent proteins to interact with their physio- logical targets. The biological activity characteristic of the whole molecule is held to derive from the retention of specific protein–protein recognition by such isolated pep- tides and their resulting ability to inhibit receptor/effector interactions. Examples of such intervention range from the inhibition of the replication of simian virus 40 DNA by the Proliferating Cell Nuclear Antigen-binding peptide of p21WAF1 [40] to the myosin loop peptide, hcM398–414, used in this study. In keeping with its apparent contribution to the actomyosin interface [16,17,20] the latter peptide inhibited actin-activated MgATPase activity [29] while the short TnI inhibitory peptide, some 6% of the parent molecule, preserves both the inhibitory and the tropomyosin accentuation effects characteristic of troponin-I.
The NMR and fluorescence studies both indicate inter- action of F-actin with another region of myosin, the loop peptide, hcM398–414. The interaction appears to occur at a region on F-actin that is different from that involved in binding the TnI inhibitory peptide as shown by the distinctive response of the IAEDANS probe to each peptide. This is consistent with the earlier observations that
5098 V. B. Patchell et al. (Eur. J. Biochem. 269)
(cid:1) FEBS 2002
the inhibitory peptide interacts at the actin N-terminus and with modelling studies that have placed the myosin loop residues hcM398–415 close to actin residues 332–334 [16,39].
Under the conditions of low ionic strength at which these studies were carried out there was no evidence that tropomyosin inhibited the binding of either myosin peptide, indeed the evidence was that their affinity for actin was increased. This implies that the binding site(s) occupied by these peptides are different from those involved in binding tropomyosin.
interaction had taken place between actin and tropomyosin low ionic strength and in the absence of added at magnesium. Earlier reports of the stimulatory effect of tropomyosin on the inhibitory action of TnI on the actomyosin MgATPase were also carried out at low ionic strength [2]. The results obtained with IPs in this study likewise indicate that interaction occurs under these condi- tions. It would appear that the interaction of tropomyosin with actin is much more subtle than has been supposed and that the standard procedure for evaluating actin–myosin interaction by co-centrifugation has its limitations. Further, under the conditions in which our results have shown that tropomyosin interacts with F-actin, the peptides represent- ing presumptive binding regions on myosin and TnI can still bind to actin. This suggests that in the presence of tropomyosin regions of the actin monomer are available for interaction with intact TnI and myosin.
The results of the competition experiments and the observations that the affinities of the TnI inhibitory peptide and the myosin peptides for actin are all very similar suggest that displacement does not explain our results. A more likely explanation is that all the peptides have specific binding sites and that the binding of the IP in a 1 : 1 complex induces a conformational change that is wide- spread in the actin molecule leading to the dissociation of the MLC1–37, hcM398–414 and rcTnI161–181 peptides (Fig. 10). On the other hand any conformational change induced in actin by binding of the myosin loop peptide or rcTnI161–181 is more restricted since any allosteric effect does not extend from the regions of actin where these peptides are bound.
Both NMR and fluorescence studies indicate that tropo- myosin enhances the binding of the inhibitory peptide region to actin presumably by enabling slower dissociation of the peptide. From the results of early ultracentrifugation in which tropomyosin–actin binding was studies [3,45] assayed by co-centrifugation it has been assumed that these two proteins did not interact at low Mg concentration and low ionic strength. The fact that the Kds for the actin– peptide complexes reported in this communication had all decreased in the presence of tropomyosin implies that
It would appear that the ligand responsible for modula- ting the interaction with myosin is the inhibitory region of TnI which on binding to actin renders the molecule unable to bind to the N-terminus of MLC1 and the myosin loop peptide and possibly other sites of interaction with myosin essential for activation of the MgATPase. The results reported here strongly suggest that the binding of IP or TnI to an actin monomer produces conformational changes at least two other sites on the actin molecule. Although other regions were not probed in this study it is possible that widespread conformational changes in the actin monomer occur on interaction with TnI. Inspection of the actin structure indeed reveals intramonomer contacts within actin subdomain 1 that may underlie the ability of the inhibitory region of TnI to influence the surface activity of actin towards other actin binding proteins. The site of binding of the inhibitory region is the N-terminal of actin that is structurally linked to the C-terminal and residues 99–101. Displacement of myosin contacts would therefore be facilitated by small conformational changes distributed through the residue network making intramolecular con- tacts between the N- and C-terminal regions on subdomain 1 of actin.
To maintain the integrity of
the F-actin filament structure after interaction with TnI with a monomer it would be expected that the conformational changes would be transmitted to neighbouring actin monomers. These could take place through the contact points between actin monomers in the F-actin filament, of which it has been postulated that there are at least four per actin monomer [46]. Biochemical and physiological data suggest that the response of the actin protein assembly involves longitu- dinal cooperativity along the thin filament. The regulatory interactions would be expected to be the same as the nearest neighbour interactions that govern the actin monomer contacts upon which thin filament assembly is based. Several studies have suggested that structural changes in the actin monomer result from polymerization to form F-actin [47,48]. These changes may be fundamen- tal for the longitudinal cooperativity observed in func- tioning F-actin filaments.
The results obtained in this study suggest that the role of tropomyosin in the myofibrillar system may not be to block sites on actin that interact with myosin to activate the MgATPase but rather to stabilize the F-actin filament and facilitate the transmission of conformational changes
Fig. 10. Schematic representation of the interaction sites on rabbit fast skeletal actin. Outline of actin monomer taken from Kabsch et al. 1990 [52]. Domains are labelled and the C and N termini of actin are identified by bold letters. Full arrows indicate regions of interaction whereas dotted arrows represent suggested allosteric effects on the actin molecule. Although the position of the second TnI binding site on actin is placed in domain 1 in the scheme the actual location of this site is not known.
F-actin interactions inhibited by Troponin-I (Eur. J. Biochem. 269) 5099
(cid:1) FEBS 2002
10. Rarick, H.M., Tu, X.-H., Solaro, R.J. & Martin, A. (1997) The C terminus of cardiac troponin I is essential for full inhibitory activity and Ca2+ sensitivity of rat myofibrils. J. Biol. Chem. 272, 26887–26892. 11. Perry, S.V. (1999) Troponin I: Inhibitor or facilitator. Mol. Cell Biochem. 190, 9–32.
12. Haselgrove, J.C. (1972) X-ray evidence for a conformational change in the actin-containing filaments of vertebrate striated muscle. Cold Spring Harbor Symp Quant Biol. 37, 341–352. 13. Huxley, H.E. (1972) Structural changes in the actin- and myosin- containing filaments during contraction. Cold Spring Harbor Symp Quant Biol. 37, 361–378.
14. Parry, D.A.D. & Squire, J.M. (1973) Structural role of tropo- myosin in muscle regulation: analysis of the x-ray diffraction patterns from relaxed and contracting muscles. J. Mol. Biol. 75, 35–55.
between the actin monomers that are induced by interaction with TnI and myosin. While care should be exercised in extrapolating the results obtained with peptides to those associated with the intact proteins in the functioning myofibril, nevertheless there is now widespread evidence that certain properties of intact proteins are preserved in peptide fragments derived from them [49]. Further, a number of observations have been reported that are explained by conformational changes occurring in actin [2,21,22,50–52] while it has been reported [28] that the affinity of the myosin loop peptide, hcM398–414, for F-actin was enhanced by the presence of myosin subfrag- ment-1 at a concentration substoichiometric with respect to F-actin. These data also suggest that a conformational change is propagated along the actin filament. The studies described here provide direct of evidence of sites of interaction and of conformational changes occurring in actin that are an important aspect of the regulatory process (Fig. 10). They also imply that the role of tropomyosin in filament function may be to stabilize the actin filament and facilitate its cooperative function rather than directly blocking the interaction of actin with myosin as postulated by the steric hypothesis.
15. Milligan, R.A. (1996) Protein–protein interactions in the rigor actomyosin complex. Proc. Natl Acad. Sci. USA 93, 21–26. 16. Rayment, I., Holden, H.M., Whittaker, M., Yohn, C.B., Lorenz, M., Holmes, K.C. & Milligan, R.A. (1993) Structure of the actin– myosin complex and its implications for muscle contraction. Science 261, 58–65.
17. Sasaki, N., Asukagawa, H., Yasuda, R., Hiratsuka, T. & Sutoh, K. (1999) Deletion of the myopathy loop of Dictyostelium myosin II and its impact on motor functions. J. Biol. Chem. 274, 37840– 37844.
A C K N O W L E D G E M E N T S
18. Cuda, G., Fananapazir, L., Zhu, W.S., Sellers, J.R. & Epstein, N.D. (1993) Skeletal-muscle expression and abnormal function of beta-myosin in hypertrophic cardiomyopathy. J. Clin. Invest. 91, 2861–2865.
The work described has been supported by grants from the British Heart Foundation and the Wellcome Trust. The work is part of the Bioinformatics Initiative at the University of Birmingham supported by the Medical Research Council.
R E F E R E N C E S
19. Geisterfer-Lowrance, A.A.T., Kass, S., Tanigawa, G., Vosberg, H.P., McKenna, W., Seidman, C.E. & Seidman, J.G. (1990) A molecular basis for familial hypertrophic cardiomyopathy – a beta-cardiac myosin heavy-chain gene missense mutation. Cell 62, 999–1006.
1. Schaub, M.C. & Perry, S.V. (1971) The regulatory proteins of the myofibril. Characterisation and properties of the inhibitory factor (Troponin B). Biochem. J. 123, 367–377.
20. Cuda, G., Fananapazir, L., Epstein, N.D. & Sellers, J.R. (1997) The in vitro motility activity of beta-cardiac myosin depends on the nature of the beta-myosin heavy chain gene mutation in hypertrophic cardiomyopathy. J. Muscle Res. Cell Motil. 18, 275–283. 21. Squire, J.M. & Morris, E.P. (1998) A new look at thin filament regulation in vertebrate striated muscle. FASEB J. 12, 761–771. 2. Perry, S.V., Cole, H.A., Head, J.F. & Wilson, F.J. (1972) Loca- lisation and mode of action of the inhibitory component of the troponin complex. Cold Spring Harbor Symp Quant Biol. 37, 251– 262.
22. Rosol, M., Lehman, W., Craig, R., Landis, C., Butters, C. & Tobacman, L.S. (2000) Three-dimensional reconstruction of thin filaments containing mutant tropomyosin. Biophys. J. 78, 908– 917. 3. Eaton, B.L., Kominz, D.R. & Eisenberg, E. (1975) Correlation between the inhibition of the acto-heavy meromyosin ATPase and the binding of tropomyosin to F-actin: effects of Mg2+, KCl, troponin I and troponin C. Biochem. 14, 2718–2725.
23. Lehman, W., Hatch, V., Korman, V., Rosol, M., Thomas, L., Maytum, R., Geeves, M.A., Van Eyk, J.E., Tobacman, L.S. & Craig, R. (2000) Tropomyosin and actin isoforms modulate the localisation of tropomyosin strands on actin filaments. J. Mol. Biol. 302, 593–606. 4. Lehrer, S.S., Chai, M. & Geeves, M.A. (1997) Effect of troponin I (TnI) on actin S1 ATPase and S1 binding in the absence and presence of rabbit skeletal tropomyosin. Biophys. J. 72, MP198. 5. Geeves, M.A., Chai, M. & Lehrer, S.S. (2000) Inhibition of actin- myosin ATPase activity by troponin I and IC: relationship to the thin filament states of muscle. Biochemistry 39, 9345–9350.
24. Grabarek, Z. & Gergely, J. (1987) Troponin-I binds to the N-terminal 12-residue segment of actin. Biophys. J. 51, A331. 25. Levine, B.A., Moir, A.J.G. & Perry, S.V. (1988) The interaction of troponin-I with the N-terminal region of actin. Eur. J. Biochem. 172, 389–397. 6. Hartshorne, D.J., Schaub, M.C. & Perry, S.V. (1967) A protein factor inhibiting the magnesium activated adenosine tripho- sphatase activity of desensitised actomyosin. Biochem. J. 104, 907– 913.
26. Patchell, V.B., Gallon, C., Hodgkin, M.A., Fattoum, A., Perry, S.V. & Levine, B.A. (2001) The inhibitory region of troponin I is able to block binding at different locations on F-actin. J. Muscle Res. Cell Motil. 22, 594–595.
7. Syska, H., Wilkinson, J.M. & Perry, S.V. (1976) The relationship between biological activity and primary structure of troponin I of white skeletal muscle of the rabbit. Biochem. J. 153, 375–387. 8. Talbot, J.A. & Hodges, R.S. (1981) Synthetic studies on the inhibitory region of rabbit skeletal troponin I. J. Biol. Chem. 256, 2798–2802.
27. Henry, G., Trayer, I.P., Brewer, S. & Levine, B.A. (1985) The widespread distribution of alpha-N-trimethylalanine as the N-terminal amino-acid of light chains from vertebrate striated myosins. Eur. J. Biochem. 148, 75–82.
28. Levine, B.A., Moir, A.J.G., Patchell, V.B. & Perry, S.V. (1990) The interaction of actin with the N-terminal region of dystrophin. FEBS Lett. 263, 159–162. 9. Tripet, B., Van Eyk, J.E. & Hodges, R.S. (1997) Mapping of a second actin tropomyosin and a second troponin C binding site within the C terminus of troponin I, and their importance in the Ca2+-dependent regulation of muscle contraction. J. Mol. Biol. 271, 728–750.
5100 V. B. Patchell et al. (Eur. J. Biochem. 269)
(cid:1) FEBS 2002
41. Timson, D.J., Trayer, H.R., Smith, J.S. & Trayer, I.P. (1999) Size and charge requirements for kinetic modulation and actin binding by alkali 1-type myosin essential light chains. J. Biol. Chem. 274, 18271–18277. 29. Bartegi, A., Roustan, C., Chavanieu, A., Kassab, R. & Fattoum, A. (1997) Interaction of F-actin with synthetic peptides spanning the loop region of human cardiac beta-myosin heavy chain con- taining Arg403. Eur. J. Biochem. 250, 484–491.
42. Milligan, R.A., Whittaker, M. & Safer, D. (1990) Molecular structure of F-actin and location of surface binding sites. Nature 348, 217–221. 30. Spudich, J.A. & Watt, S. (1971) The regulation of rabbit skeletal muscle contraction. Biochemical studies of the interaction of the tropomyosin-troponin complex with actin and the proteolytic fragments of myosin. J. Biol. Chem. 246, 4866–4487.
43. Morano, I., Ritter, O., Bonz, A., Timek, T., Vahl, C.F. & Michel, G. (1995) Myosin light–chain actin interaction regulates cardiac contractility. Circ. Res. 76, 720–725.
31. Miki, M., Dos Remedios, C.G. & Barden, J.A. (1987) Spatial relationship between the nucleotide-binding site, Lys-61 and Cys- 374 in actin and a conformational change induced by myosin subfragment-1 binding. Eur. J. Biochem. 168, 339–345. 32. Jardetzky, O. & Roberts, G.C.K. (1981) NMR in Molecular Biology p.59. Academic Press, New York/London. 44. Rarick, H.M., Opgenorth, T.J., von Geldern, T.W., Wu-Wong, J.S.R. & Solaro, R.J. (1996) An essential myosin light chain peptide induces supramaximal stimulation of cardiac myofibrillar ATPase activity. J. Biol. Chem. 271, 27039–27043.
45. Martonosi, A. (1962) Studies on actin VII. Ultracentrifugal ana- lysis of partially polymerised actin solutions. J. Biol. Chem. 237, 2795–2803. 46. Holmes, K.C., Popp, D., Gebhard, W. & Kabsch, W. (1990) Atomic model of the actin filament. Nature 347, 44–49. 47. Steinmetz, M.O., Stoffler, D. & Hoenger, A. (1997) Actin: From 33. Huber, P.A.J., Gao, Y., Fraser, I.D.C., Copeland, O., El-Mez- gueldi, M., Slatter, D.A., Keane. N.E., Marston, S.B. & Levine, B.A. (1998) Structure-activity studies of the regulatory interaction of the 10 kilodalton C-terminal fragment of caldesmon with actin and the effect of mutation of caldesmon residues 691–696. Biochemistry 37, 2314–2326. cell biology to atomic detail. J. Struct. Biol. 119, 295–320.
34. Lian, L.-Y. & Roberts, G.C.K. (1993) Effects of chemical exchange on NMR spectra. In NMR of Macromolecules (Roberts, G.C.K., ed.), pp 151–182. IRL Press, Oxford.
48. Moraczewska, J., Wawro, B., Seguro, K. & Strzelecka- Golaszewska, H. (1999) Divalent cation, nucleotide and poly- merization-dependent changes in the conformation of subdomain 2 of actin. Biophys. J. 77, 373–385. 49. Peptides as probes in Muscle Research. (1991) (J.C. Ruegg, ed.), 35. Jardetzky, O. & Jardetzky, C.D. (1962) Introduction to magnetic resonance spectroscopy methods and biological applications. Methods Biochem. Anal. 9, 225. pp 1–174. Springer-Verlag, Berlin. 36. McConnell, H.M. (1958) Reaction rates by nuclear magnetic resonance. J. Chem. Phys. 28, 430–431. 37. Sutoh, K. (1982) Identification of myosin-binding sites on the actin sequence. Biochemistry 21, 3654–3661. 50. Bremel, R.D. & Murray, J.M. (1972) and. Weber. Manifestations of cooperative behaviour in the regulated actin filament during actin-activated ATP hydrolysis in the presence of calcium. Cold Spring Harbor Symp Quant. Biol. 37, 267–275. 51. Butters, C.A., Willasden, K.A. & Tobacman, L.S.
38. Trayer, I.P., Trayer, H.R. & Levine, B.A. (1987) Evidence that the N-terminal region of A1-light chain of myosin interacts directly with the C-terminal region of actin – a proton magnetic resonance study. Eur. J. Biochem. 64, 259–266. (1993) Cooperative interactions between adjacent troponin-tropomyosin complexes may be transmitted through the actin filament. J. Biol. Chem. 268, 15565–15570.
39. Timson, D.J., Trayer, H.R. & Trayer, I.P. (1998) The N-terminus of A1-type myosin essential light chains binds actin and modulates myosin motor function. Eur. J. Biochem. 255, 654–662. 52. Levine, B.A., Patchell, V.B. & Perry, S.V. (1999) Troponin I and conformational changes in actin. J. Muscle Res. Cell Motil. 20, 828–829.
53. Kabsch, W., Mannherz, H.G., Suck, D., Pai, E.F. & Holmes, K.C. (1990) Atomic structure of the actin – DNase-I complex. Nature 347, 37–44. 40. Warbrick, E., Lane, D.P., Glover, D.M. & Cox, L.S. (1995) A small peptide inhibitor of DNA replication defines the site of interaction between the cyclin-dependent kinase inhibitor p21WAF1 and proliferating cell nuclear antigen. Current Biol. 5, 275–282.