152
Journal of Medicine and Pharmacy, Volume 12, No.07/2022
Comparison of colour improvement and stability of white spot lesions
following infiltration, micro-abrasion, or CPP-ACP treatments in vitro
Phan Anh Chi1*, Le Thi Nhat Linh1, Dang Khac An1
(1) Faculty of Ondonto -Stomatology, University of Medicine and Pharmarcy, Hue University
Abstract
Objective: The objective was to compare the colour improvement of white spot lesion and the colour
stability of treated enamel to after discolouration in vitro. Method: Artificial WSLs (2*2 mm) were created on
the outer surface of 60 permanent premolars and randomly allocated to 4 groups. Specimens were treated with
infiltration (RI), CPP-ACP (CPP), and micro-abrasion (MA) or remained untreated (UT).Groups were discoloured
for 24 hours in tea or tea + citric acidVisible colour changes (ΔE) were measured spectrophotometrically on
following time points: immediately after lesion formation, immediately after treatment, after 30 days of
immersion in artificial saliva, anh aftere discolouration. Data were analyzed using SPSS 20 software. Results:
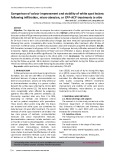
WSL formation increased in all groups. ΔE1 is creater 3.7 in all groups but only infiltration reduced this effect
to baseline. Highest ΔE4was obtained by CPP-ACP and resin infiltration is lowest. Between the RI and MA
treatment groups, ΔE4 did not differ significantly. The improvement was more stable for infiltration and micro
abrasion during discolouratio compare to the others (ΔE4 < 3.7). Conclusions: The method of infiltration
improves the aesthetics of white spot lesions immediately after treatment and maintains treatment results
during the follow-up period. Micro abrasion improved white spot aesthetics during the follow-up period.
These two methods WSLs were stable following discolouration challenge.
Key words: white spot lesion, infiltration, micro abrasion, CPP-ACP
1. INTRODUCTION
White spot lesions are not only early sign of caries
formation, but also are side-effect of orthodontic
treatment because of plaque accommodation on
teeth or around braces. Lesions are milky white due
to demineralization resulting in a porous surface
beneath the surface layer, altering the normal light
reflectivity of the enamel [1]. This lesion becomes
more recognizable when affected by exogenous
pigments that affect the patient’s aesthetics [2].
Occurently, reported rates vary from 2 to 96%,
depending on methods and detection criteria
as well as patient compliance with precautions.
These lesions often persist long after the braces
are removed and white spots can sometimes be
detected even 12 years after treatment. The recent
methods of white spots treatment are divided into
two main groups of methods: remineralization
measures and colour improvement measures.
Remineralization measures include methods such
as Fluoride or Casein phosphopeptide - Amorphous
calcium phosphate. Other methods to improve
color include micro-abrasive methods, resin
penetration or bleaching [3]. Currently, there are
some studies to evaluate the effectiveness of white
spot lesions treatment methods such as the study
of Yetkiner et al (2014), the study of Dam Minh
Tuan (2016), the study of by Vo Truong Nhu Ngoc
et al (2017), research by Yadav et al (2019) [2], [4],
[5], [6]. However, most of these studies have only
evaluated the effectiveness of a single method,
while studies comparing different treatments
are limited. Therefore, we compared to colour
improvement and stability of white spot lesions
following infiltration, micro-abrasion, or cpp-acp
treatments in vitro in our study.
2. MATERIALS AND METHODS
2.1. Research design and subjects
The research is in vitro study, carried out at the
Preclinical Department of Odonto-Stomatology,
Hue University of Medicine and Pharmacy from
September 2021 to April 2022 with pre-molars
extracted for orthodontic reasons.
2.2. Selection criteria
The following selection criteria were used in
the research:
Inclusion criteria
The tooth remains in the shape of the crown.
Exclusion criteria
- Teeth had caries, enamel hypoplasia, cracks, worn
teeth.
- Teeth infected with Fluoride, Tetracycline,
teeth with enamel hypoplasia.
Corresponding author: Phan Anh Chi, email: pachi@huemed-univ.edu.vn
Recieved: 5/11/2022; Accepted: 1/12/2022; Published: 30/12/2022
DOI: 10.34071/jmp.2022.7.21
153
Journal of Medicine and Pharmacy, Volume 12, No.07/2022
2.3. Research size
60 teeth were randomly divided into 4 groups
including: resin infiltration (RI), micro-abrasion
(MA), cpp-acp (CPP) and untreated (UT).
2.4. Research methods
Sample preparation
The tooth samples suitable to inclusion and
exclusion criteria, were cleaned and preserved in
saline solution and stored in a refrigerator at 50C.
The acid resistant coating was used to cover the
entire surface of the enamel crowns of each tooth,
leaving only two enamel windows on the buccal
surface sized 2x2mm. They applied transparent nail
polish (Kim Nghia, Viet Nam) 2 times each tooth.
pH cycle
White spot lesions were generated based on the
modified pH cycle of Featherstone et al (1986)[7].
The samples were soaked in a demineralized solution
(consisting of calcium nitrate 2 mmol/L, potassium
dihydrogen phosphate 2mmol/L and acetic acid
75mmol/L) for 3 hours with a pH of 4.3. Then the
samples were washed thoroughly with distilled
water for 30 min (approximately 15 s for each tooth).
The teeth were expose remineralization solution
(including calcium nitrate 2 mmol/L, potassium
dihydrogen phosphate 2 mmol/L, potassium chloride
130 mmol/L and Trisaminomethane 100 mmol/L)
for 20 hours with pH 7, then wash thoroughly with
distilled water for 30 min before reintroducing
it into the demineralization solution. The cycle
was repeated daily for 5 days and maintained at
37°C. The samples were then immersed in the
remineralization solution for the next 2 days.
Colour improvement methods
After the pH cycle finished, the acid resistant
coating was removed from all teeth by aceton, and
soaking them back in distilled water then randomly
distributed into 4 groups that consisted of 15 teeth.
CPP group: the teeth were bloted and applied
CPP-ACP gel to study windows 2 times a day, 4
minutes each time. Then they are placed back
in artificial saliva solution without rinsing and
maintained within 2 months.
MA group: White spot was treated with micro
abrasion by placing a layer of the mixture (6.6% HCl
and silicon carbide) approximately 1mm over the
white spot lesion and using the same rubber pad
and slow handpiece with medium pressure at about
300 rpm for 60 seconds polishing for 20 seconds.
RI group: the teeth were gently applied an
appropriate amount of Icon etch (15% hydrochloric
acid) to the affected area for 120 seconds. Then
rinsing off the residue with water for 30 seconds and
blowing dry. They were pumped onto the surface an
amount of ICON Dry (ethanol 99%) and wait for 30
seconds before blowing dry. The resin (ICON) was
then injected onto the lesion, left for 180 seconds,
and illuminated for 60 seconds. Continue injecting
the second layer of ICON, leave for 60 seconds and
light up for 40 seconds then polising with the rubber
band for 20 seconds.
UT group: un treated
The samples were soaked in artificial saliva
(Salisol, Hago, Vietnam) for 30 days to evaluate the
post-treatment color stability. The artificial saliva
solution is renewed daily.
Dicolouration process
The teeth are soaked in a mixed solution of tea
and coffee for 5 minutes a day. As the rest time,
the teeth are soaked in artificial saliva. This staining
process is done in 5 days. The coloring solution is
prepared by brewing 20 grams of tea and 20 grams
of coffee in 2 liters of boiled water and then filtering.
After five days, the samples were washed and gently
brushed with a soft-bristled brush to remove the
outer yellow layer, then rinsed with water and dried.
Image analysis
The teeth were colored using a Crystaleye
spectrophotometer (Olympus, Tokyo, Japan).
Captured images are transferred via a cable that
connects the stand and a computer with the
dedicated Crytaleye Application Master software
(Version 1.4). Colors are displayed in three values
L*, a*, b* in the CIELAB color space defined by the
International Commission on Illumination (1976)
[8]. L* valuerepresents the luminance value from 0
(complete black) to 100 (complete white). a and b
value represent saturation, relative to the red-green
and yellow-blue axes, with a positive a indicating red
tones, and positive b indicating yellow tones [9].
Parameters of color and brightness (L*, a*, b*)
were analyzed and recorded by the software at the
time before treatment (T0), when white spot lesions
were formed (T1). , immediately after treatment
(T2), 30 days after treatment (T3), after soaking in
colored solution (T4). The color change is calculated
using the formula:
154
Journal of Medicine and Pharmacy, Volume 12, No.07/2022
If E value is greater than 3.7, the color is clinically recognizable to the naked eye [13]. The color change
is calculated between time points:
E1 (T1-T2); E2 (T2-T3); E3 (T3-T4), E4 (T0-T3).
Data analysis
Data was statistically analyzed using SPSS software ver 20.0. Calculate mean and standard deviation of
measured value was analyzed by Paired samples test. Comparing 4 independent groups by ANOVA, Kruskall-
Wallis test and using Mann-Whitneys U test to compare 2 independent values in the same group on different
time.
3. RESULTS
3.1. Comparison of colour improvementof white spot leisons
Chart 1. Mean and standard deviation of the values E1, ΔE2, E4
of the three treatment groups CPP, MA, and RI
*: The difference is statistically significant
NS: The difference is statistically non significant
When making comparison, the ∆E1 color change is highest in the RI group. The MA group has a lower
∆E1 value than RI group and the lowest is the CPP group. The ΔE1 color change of 3 groups CPP, MA, RI
show p<0.05 and the difference between groups is statistically significant. After soaking teeth for 30 days
in artificial saliva, the MA group has the largest ∆E2 color change. The result of comparing the ∆E2color
change between CPP and MA has p<0.05 so the difference is statistically significant, while others (MA and
RI), (CPP and RI) show p>0.05. The color change between time points (T0-T3) shows that the CPP group has
the greatest difference in ∆E4. The result of comparing the ΔE4color change between the MA and RI groups
has p>0.05 while remain groups: (MA, CPP) and (RI, CPP) have p<0.05 and show the statistically significant
difference.
3.2. Comparison of stability of white spot leisons
Table 2. Mean and standard deviation of values of 4 groups at time points T3, T4
Method CPP MA RI UT
Values at
time points
T3, T4
LT3 77.83 ± 3.09 72.03 ± 1.83 69.57 ± 2.11 79.90 ± 2.55
T4 70.74 ± 2.74* 69.14 ± 2.47* 68.18 ± 2.56NS 72.02 ± 1.78*
aT3 2.18 ± 1.38 0.60 ± 0.89 1.40 ± 0.82 0.97 ± 0.99
T4 1.96 ± 1.36NS 0.92 ± 1.03* 1.91 ± 0.80* 1.27 ± 0.86*
bT3 10.64 ± 2.17 15.99 ± 2.69 17.39 ± 2.35 10.51 ± 1.90
T4 13.56 ± 1.87* 16.27 ± 2.07NS 18.71 ± 1.63* 13.89 ± 1.82*
∆E3 8.82 ± 2.37 8.06 ± 1.35 3.46 ± 2.35 2.54 ± 1.15
155
Journal of Medicine and Pharmacy, Volume 12, No.07/2022
Use Paired samples test with *: p<0.05 and
NS: p>0.05 when comparing L, a, b values at two
consecutive time points.
After soaking in the colored solution, L* values of
all groups UT, CPP, MA, RI decrease, a values of the
UT, MA, and RI groups increase while the CPP group
remains unchanged. At the same time, the UT, CPP,
and RI group show increase in b valuewhile the MA
group do not change. The ΔE3 mean of the groups
has p<0.05, the difference is statistically significant.
4. DISCUSSION
4.1. Comparison of colour improvementof
white spot leisons
The ΔE1 value represents the color change
before and after treatment. Immediately after
treatment, ∆E1 values of three groups are higher
than 3.7. It means that all three methodsare
effective in improving white spot color. The
E1 values comparisonof three groups shows a
statistically significant difference (p<0.05). And
when comparing in pairs (CPP and MA), (MA and
RI), (CPP and RI), the results points out statistically
significant differences (p<0.05).These demonstrate
the effectiveness of color improvement methods in
varying levels. The highestΔE1 mean in the RI group
shows that the resin infiltration is most effective. It
fits into the study of Yetkiner et al (2014) and the
study of Yadav et al (2019) [2], [6].
The E2 value represents the color change
between two time points: immediately after
treatment and after 30 days of soaking in the
artificial saliva. The E2 mean of the MA group
is highest demonstrating effectiveness of micro-
abrasion method in white spot lesions treatment.
This can be explained that the micro-abrasion
method removes the surface layer of the lesion and
allows the remineralization agent in the artificial
saliva to contact the central area of the lesion [11].
The surface layer of the lesion, which is 10-30 µm in
dense has a mineral content to be similar to intact
enamel. Meanwhile, micro-abrasion method can
remove 25-200 µm of enamel layer after 5-10 times
[10]. This result is consistent with the study of Xi Gu
et al (2019) [11].
In conclusion, resin infiltration method improved
the colour of white spot lesions immediately after
treatment and maintained stability during the
follow-up period. Whereas, micro-abrasion method
continuously enhancedaesthetics during the follow-
up period. This was similar to the study of Xi Gu et
al (2019) and the study of Di Shan et al (2020) [11],
[12].
4.2. Evaluation of stabilityof white spot leisons
After soaking in the stained solutions, all groups
had a decrease in L* values indicating that these
solutions made the teeth tend to be darker. Colored
solutions increase a and b values which means that
the color shifts towards red and yellow. The b value
increased because of tea and coffee in the stained
solution containing yellow pigments called Tannins
with different polarities [14]. The colorants in tea are
highly polar attraction and are easier to be absorbed
on the tooth surface while coffee can infiltrate inside
due to compatibleability with the polymer phase
of composite materials. When assessing the E3
value, the CPP and the UT group changed more
than others. The E3 color change of MA and the
RI group changed less and the mean of these two
methods < 3.7, indicating that the white spot lesions
treated with micro-abrasion and resins infiltration
can resist staining after soaking in coloured solution.
Penetration of infiltrated resin filling the pores may
be a factor to enhance staining agent resistance.
This is consistent with the study of Paris et al (2013),
Yetkiner et al (2014) [2], [15],. The micro-abrasion
can resist staining, which is different from the study
of Yetkiner et al (2014) [2]. This can be explained by
the fact that in our study, the extra time of soaking
in artificial saliva enhanced remineralization after the
superficial layer of the lesion had been removed, the
polished residues beccame smooth and mineralized
so they could resist staining.
White spot lesions treatment with CPP-ACP is a
time-requiring method because remineralization is a
slow process and depends on calcium ion deposition
[16]. Although color changed after treatment,
the lesion is visible. The reason was incomplete
remineralization of the lesion sothe color change of
the CPP group was similar to untreated groups when
it was added to the stained solution [2].
5. CONCLUSION
All of treating white spot lesions methods
including: micro-abrasive, infiltration resin, casein
phosphopeptide- amorphours calcium phosphate both
provide color improvement effect. When comparing
the three methods, the color change E decreases
with the order: infiltration resin, micro-abrasive, casein
phosphopeptide- amorphours calcium phosphate.
After soaking in colored solution, white spots
treated with casein method phosphopeptide-
amorphours calcium phosphate has more color change
and similar to the untreated group, while the change
color of micro-abrasive and infiltration resin groups is
lower and equal.
156
Journal of Medicine and Pharmacy, Volume 12, No.07/2022
1. Selwitz R.H., Ismail A. I., Pitts N. B. (2007), “Dental
caries”, The Lancet, 369(9555), 51-59.
2. Yetkiner E., Wegehaupt F. (2014), “Colour
improvement and stability of white spot lesions following
infiltration, micro-abrasion, or fluoride treatments in
vitro”, European journal of orthodontics, 36(5), 595-602.
3. Sonesson M., Bergstrand F. (2017), “Management
of post-orthodontic white spot lesions: an updated
systematic review”, European journal of orthodontics,
39(2), 116-121.
4. Đàm Minh Tuân (2016), “Nhận xét khả năng xâm
nhập của icon vào tổn thương sâu răng sớm trên thực
nghiệm sử dụng kính hiển vi điện tử quét, Tạp chí Y học
Việt Nam, 12, tr. 52-54.
5. Võ Trương Như Ngọc (2017), The effect of
casein phosphopeptide-amorphous calcium fluoride
phosphate on the remineralization of artificial caries
lesions: an in vitro study, Journal of Dentistry Indonesia,
24(2), 45-49.
6. Yadav P., Densai H. (2019), A comparative
quantitative & qualitative assessment in orthodontic
treatment of white spot lesion treated with 3 different
commercially available materials-In vitro study, Journal
of clinical and experimental dentistry, 11(9), e776.
7. Buzalaf M.A., Rabelo H., Angélica R. (2010), “pH-
cycling models for in vitro evaluation of the efficacy of
fluoridated dentifrices for caries control: strengths and
limitations”, Journal of Applied Oral Science, 18, 316-334.
8. Chu S. J., Trushkowsky R. D., Paravina R.D. (2010),
“Dental color matching instruments and systems. Review
of clinical and research aspects”, Journal of dentistry, 38,
e2-e16.
9. Sikri V.K. (2010), “Color: Implications in dentistry”,
Journal of conservative dentistry: JCD, 13(4), 249.
10. Núbia I. P.P., Daniel S.N. (2015), “Enamel
microabrasion: An overview of clinical and scientific
considerations”, World Journal of Clinical Cases: WJCC,
3(1), 34.
11. Gu Xi, Lin Yang (2019), “Esthetic improvements
of postorthodontic white-spot lesions treated with resin
infiltration and microabrasion: A split-mouth, randomized
clinical trial”, The Angle Orthodontist, 89(3), 372-377.
12. Di Sang, Yuwei He. (2021), A comparison of
resin infiltration and microabrasion for postorthodontic
white spot lesion”, American Journal of Orthodontics and
Dentofacial Orthopedics, 160(4), 516-522.
13. Johnston W.M. (1989), Assessment of appearance
match by visual observation and clinical colorimetry”,
Journal of dental research, 68(5), 819-822.
14. Um C. M., Ruyter I. (1991), “Staining of resin-based
veneering materials with coffee and tea”, Quintessence
international, 22(5).
15. Paris S., Schwendicke F. (2013), “Masking of
white spot lesions by resin infiltration in vitro”, Journal of
dentistry, 41, e28-e34.
16. Bailey D.L., Adams G.G., Tsao C.E. (2009),
“Regression of post-orthodontic lesions by a remineralizing
cream”, Journal of dental research, 88(12), 1148-1153.
REFERENCE