Expression profiling reveals differences in metabolic gene expression between exercise-induced cardiac effects and maladaptive cardiac hypertrophy Claes C. Strøm1, Mark Aplin1, Thorkil Ploug2, Tue E. H. Christoffersen1, Jozef Langfort3, Michael Viese2, Henrik Galbo2, Stig Haunsø1 and Søren P. Sheikh1
1 CHARC (Copenhagen Heart Arrhythmia Research Center), Department of Medicine B, H:S Rigshospitalet, University of Copenhagen Medical School, Denmark 2 Copenhagen Muscle Research Centre, Department of Medical Physiology, Panum Institute, University of Copenhagen, Denmark 3 Laboratory of Experimental Pharmacology, Polish Academy of Science, Warsaw, Poland
Keywords adaptive; DNA microarray; gene expression; hypertrophy; maladaptive
Correspondence S. P. Sheikh, Laboratory of Molecular Cardiology, Department of Medicine B, H:S Rigshospitalet, University of Copenhagen, 20 Juliane Mariesvej, DK-2100 Copenhagen, Denmark Fax: +45 3545 6500 Tel: +45 3545 6730 E-mail: sheikh@molheart.dk
(Received 10 October 2004, revised 15 March 2005, accepted 22 March 2005)
doi:10.1111/j.1742-4658.2005.04684.x
While cardiac hypertrophy elicited by pathological stimuli eventually leads to cardiac dysfunction, exercise-induced hypertrophy does not. This sug- gests that a beneficial hypertrophic phenotype exists. In search of an under- lying molecular substrate we used microarray technology to identify cardiac gene expression in response to exercise. Rats exercised for seven weeks on a treadmill were characterized by invasive blood pressure mea- surements and echocardiography. RNA was isolated from the left ventricle and analysed on DNA microarrays containing 8740 genes. Selected genes were analysed by quantitative PCR. The exercise program resulted in car- diac hypertrophy without impaired cardiac function. Principal component analysis identified an exercise-induced change in gene expression that was distinct from the program observed in maladaptive hypertrophy. Statistical analysis identified 267 upregulated genes and 62 downregulated genes in response to exercise. Expression changes in genes encoding extracellular matrix proteins, cytoskeletal elements, signalling factors and ribosomal pro- teins mimicked changes previously described in maladaptive hypertrophy. Our most striking observation was that expression changes of genes involved in b-oxidation of fatty acids and glucose metabolism differentiate adaptive from maladaptive hypertrophy. Direct comparison to maladaptive hypertrophy was enabled by quantitative PCR of key metabolic enzymes including uncoupling protein 2 (UCP2) and fatty acid translocase (CD36). DNA microarray analysis of gene expression changes in exercise-induced cardiac hypertrophy suggests that a set of genes involved in fatty acid and glucose metabolism could be fundamental to the beneficial phenotype of exercise-induced hypertrophy, as these changes are absent or reversed in maladaptive hypertrophy.
FEBS Journal 272 (2005) 2684–2695 ª 2005 FEBS
2684
Abbreviations ACE, angiotensin converting enzyme; ALP, actinin a2 associated LIM protein; EST, expressed sequence tag; FABP4, fatty acid binding protein 4; FACL, fatty acid CoA ligase; FDR, false discovery rate; GCKR, glucokinase regulatory protein; HR, heart rate; LVEDP, left ventricular end diastolic pressure; MAP, mean arterial pressure; MBE, model based expression; MYL, fast myosin alkali light chain; PCA, principal component analysis; PDC, pyruvate dehydrogenase complex; PDP, pyruvate dehydrogenase phosphatase; Slc27a1, fatty acid transport protein 4; UCP2, uncoupling protein 2.
C. C. Strøm et al. Gene expression in exercise-induced cardiac hypertrophy
making this technology well suited for comprehensive analysis of gene expression changes in response to phy- siological challenges. DNA microarrays have been use- ful in analysis of cellular responses to stimuli, animal models of human disease and cancer classification [13,14].
Heart disease is a leading cause of death in the West- ern world and is commonly associated with cardiac hypertrophy. Sustained cardiac hypertrophy leads to cardiac dysfunction, heart failure, arrhythmia and sudden death. As a result, cardiac hypertrophy is an independent risk factor for cardiac morbidity and mortality [1].
that
characterize
transcriptional
We used DNA microarrays to define gene expression changes exercise-induced cardiac hypertrophy. We identified 305 genes with differential expression in response to cardiac exercise, the majority of which have not previously been associated with exercise. The most directly interpretable and poten- tially biologically important finding was a reversed metabolic shift in response to exercise suggesting that genes involved in fatty acid and glucose metabolism are key regulatory points that distinguish adaptive beneficial hypertrophy from more adverse maladaptive forms elicited by pathological stimuli.
Exercise-induced cardiac hypertrophy is distinct from the hypertrophy seen in different pathological settings, as it is not accompanied by cardiac dysfunc- tion or increased morbidity [2,3]. This intriguing dis- tinction has led to the concepts of maladaptive and adaptive forms of cardiac hypertrophy. While gene expression changes in maladaptive cardiac hypertrophy have been extensively investigated, much less is known about regulation in exercise-induced hypertrophy. Identification of a set of genes unique to this condition would enhance our understanding of the molecular differences between maladaptive and adap- tive cardiac hypertrophy.
Results
Physiological response to exercise
Exercise training increases the functional capacity of the cardiovascular system. The adaptations include increases in cardiac mass and dimension, maximum oxy- gen consumption and coronary blood flow [4]. Also, exercise results in a balanced growth of cardiomyocytes with normal myofibril to mitochondrial ratio [5,6]. In the setting of maladaptive hypertrophy, a shift from fatty acids to glucose as the main fuel in the myocar- dium has been described, and is in part caused by down- regulation of gene products involved in b-oxidation of fatty acids [7]. Whether this metabolic shift also occurs in adaptive hypertrophy remains to be established.
Several pieces of data indicated that exercised rats had cardiac hypertrophy as compared to the sedentary con- training resulted in an (cid:1) 25% trol animals. First, increase in left and right ventricular masses when nor- malized to lean body weight (Table 1) and a 10% increase when compared to tibial length (data not shown). Other organ weights were unchanged (lungs, kidney and stomach) after normalization (Table 1). Absolute cardiac weights were increased but not signi- ficantly, while other organ weights were significantly
Although the physiological and morphological chan- ges during cardiac adaptations to exercise are well characterized, the underlying little is known about molecular changes.
)1).
Table 1. Organ weights. Values are mean ± SEM. Weights (W) of heart (H), left ventricle (LV), right ventricle (RV), lungs (P), kidney (K) and stomach (S) divided by lean (L) body (B) weight (mgÆg0.78
Exercised Sedentary
350 ± 5* 40.2 ± 0.3 1.10 ± 0.04 0.73 ± 0.02 0.18 ± 0.01 1.18 ± 0.03* 1.20 ± 0.05* 1.70 ± 0.06* 11.4 ± 0.4* 7.6 ± 0.2* 1.9 ± 0.1*
Evidence that adaptive and maladaptive hypertrophic cardiac phenotypes result from activation of distinct sig- nalling pathways has come from studies demonstrating that exercise-induced hypertrophy is not prevented by angiotensin II receptor blockade or cyclosporine treat- ment [8,9]. Also, several authors have demonstrated that expression of marker genes including atrial natriuretic peptide, myosin heavy chain isoforms and thyroid hormone receptor isoforms differ between adaptive and maladaptive hypertrophy [10–12]. A comprehensive analysis of the gene expression changes in exercise- induced cardiac hypertrophy, however, is lacking. Such an approach may identify shared and divergent mole- cular networks between adaptive and maladaptive hypertrophy and point to new therapeutic strategies.
12.3 ± 0.3 12.4 ± 0.5 17.7 ± 0.6 429 ± 9 41.5 ± 0.7 1.07 ± 0.02 0.69 ± 0.02 0.17 ± 0.01 1.32 ± 0.03 1.36 ± 0.04 1.91 ± 0.04 9.5 ± 0.1 6.1 ± 0.1 1.5 ± 0.1 11.6 ± 0.1 12.0 ± 0.3 16.9 ± 0.3 BW Tibia HW LVW RVW PW KW SW HW ⁄ BWL LVW ⁄ BWL RVW ⁄ BWL PW ⁄ BWL KW ⁄ BWL SW ⁄ BWL
The microarray technology allows
*P < 0.05.
simultaneous analysis of the expression level of thousands of genes
FEBS Journal 272 (2005) 2684–2695 ª 2005 FEBS
2685
C. C. Strøm et al. Gene expression in exercise-induced cardiac hypertrophy
Table 2. Echocardiography. Values are mean ± SEM. AWT, Anter- ior wall thickness; PWT, posterior wall thickness; d, diastole; LVA, left ventricular area; BW, lean body weight; FAC, fractional area of shortening.
AWTd (cm) PWTd (cm) FAC (%) LVAd ⁄ BW (mm2Æg)0.78)
Exercised 0.205 ± 0.007* 0.195 ± 0.007* 4.97 ± 0.12* 77 ± 1 78 ± 1 Sedentary 0.180 ± 0.003 0.171 ± 0.004 4.57 ± 0.09
*P < 0.05.
Table 3. Left ventricular pressures. Values are mean ± SEM. dP ⁄ dt-max, Maximal rates of isovolumetric pressure development; dP ⁄ dt-min, maximal rates of isovolumetric pressure decay.
LVEDP (mm Hg) MAP (mm Hg) HR (min)1) dP ⁄ dt-max (m HgÆs)1) dP ⁄ dt-min (mHgÆs)1)
Exercised 6.0 ± 0.7 7.9 ± 0.3 Sedentary 4.1 ± 0.5 9.3 ± 0.6 ) 10.1 ± 0.4 113 ± 2 347 ± 8* ) 11.0 ± 0.6 111 ± 6 383 ± 9
*P < 0.05.
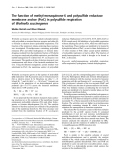
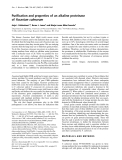
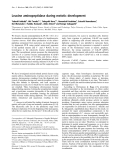
Fig. 1. Global gene expression in the hearts of exercised rats is dif- ferent from that of sedentary controls. A principal component analy- sis was performed on all genes (n ¼ 8740) to find trends in the microarray data. The two first components (PC1 and PC2) from the analysis are shown in the figure. Exercised rats clearly cluster sep- arate from the sedentary controls indicating the existence of a dis- tinct gene expression program induced by exercise.
number of variables in multivariate data with mini- mal loss of information. The PCA analysis based on all 8740 genes clearly distinguished the gene expres- sion profiles of hearts of exercised animals from those of controls (Fig. 1). This finding indicated the expression program existence of a distinct gene induced by exercise.
Identification of individual genes that are differentially expressed in response to exercise
reduced. A less intense training protocol resulted in significant body weight reductions but no increase in ventricular weights (data not shown). Secondly, echo- cardiographic examination of the cardiac phenotype revealed that exercised rats had increases in both left ventricular wall thickness and left ventricular cavity dimensions (Table 2). Anterior and posterior wall thicknesses were both increased by 14% and left ven- tricular area indexed to lean body mass increased 9%. Cardiac function at rest, as determined by fractional area of change (Table 2), left ventricular end diastolic pressure (LVEDP), and maximal rate of isovolumetric pressure development and decay (Table 3), was identi- cal in the two groups, which is consistent with pre- vious findings [15]. Mean arterial pressure showed no differences between exercised and sedentary rats (Table 3), but resting heart rate decreased 10% in response to exercise. The decrease in resting heart rate probably results from an increase stroke volume and increased parasympathetic tone.
Thus, our exercise protocol resulted in a phenotype of eccentric hypertrophy without impairment of car- diac function.
Distinct global gene expression profiles between exercised and sedentary animals
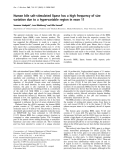
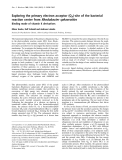
Next, individual genes regulated by exercise were iden- tified as described in Experimental procedures (Fig. 2). The vast majority of genes were unchanged. At the applied threshold [predefined to a false discovery rate (FDR) of 5% or less], 329 genes were identified as dif- ferentially regulated in response to exercise (marked with grey in the figure). Of these, 267 genes were upregulated while 62 genes were downregulated. The upregulated genes represented 179 known genes, 66 expressed sequence tags (EST) and 22 replicate genes. Among the downregulated genes were 43 known genes, 17 ESTs and two replicate probe sets. A subgroup of the genes is listed in Table 4 and the full list of genes is given in supplementary Table S1.
To demonstrate the specificity of the gene expression changes, we randomly divided samples into two groups of equal size and repeated the SAM analysis (see Experimental procedures). This procedure was repeated
We first analysed the data for differences in global gene expression patterns between exercised and con- trol animals using a principal component analysis (PCA). This type of analysis serves to reduce the
FEBS Journal 272 (2005) 2684–2695 ª 2005 FEBS
2686
C. C. Strøm et al. Gene expression in exercise-induced cardiac hypertrophy
Fig. 2. Identification of differentially expres- sed genes. A scatter plot of the observed relative difference in gene expression vs. the expected difference based on permuta- tion of samples. At the solid line, observed values are identical to expected values. The applied threshold (delta ¼ 1.20) is shown as dotted lines. Corresponding values of signifi- cance threshold (delta), FDRs, number of genes identified as differentially expressed and the expected number of false positives are listed in the lower right quadrant.
Discussion
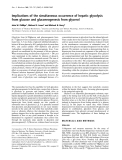
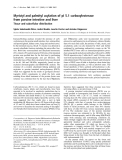
several times. No genes were identified as differentially expressed in the randomized data sets as shown in Fig. 3.
Confirmation of differential expression of selected metabolic genes by quantitative PCR
In this work, we present a comprehensive analysis of transcriptional changes in response to exercise-induced cardiac hypertrophy, thereby for the first time provi- ding an overview of molecular clues to the adaptive cardiac phenotype. We identified a distinct global gene expression pattern of myocardium adapting to the physiological challenge of exercise, and statistical ana- lysis identified 267 upregulated and 62 downregulated gene transcripts, providing a host of potential novel diagnostic and therapeutic targets for further investiga- tion.
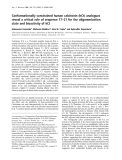
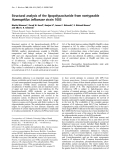
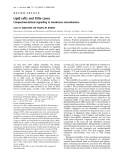
From the interesting metabolic genes, six were chosen for validation by quantitative PCR analysis. CD36, fatty acid binding protein 4 (FABP4), fatty acid trans- port protein (Slc27a1), and glucokinase regulatory pro- tein (GCKR) were upregulated and uncoupling protein 2 (UCP2) was downregulated confirming the DNA microarray data (Fig. 4). Expression of fatty acid CoA ligase (FACL) was not significantly upregulated in the quantitative PCR analysis of exercise-induced hyper- trophy.
Expression of selected genes in maladaptive hypertrophy
in absolute
concurrent
To compare expression of CD36 and UCP2 in adap- tive and maladaptive hypertrophy we analysed expres- sion of CD36 and UCP2 in the noninfarcted region of the left ventricle 3 weeks after myocardial infarction as compared to sham-operated animals. Contrary to adaptive hypertrophy, where CD36 was upregulated and UCP2 downregulated, CD36 expression was unchanged and UCP2 expression increased (26%) in maladaptive hypertrophy (Fig. 5).
The exercise resulted in a relatively small increase in left ventricular mass (6%), which was in the same range as that found by others after isotonic exercise [10,16]. When normalized to body weight or tibial length the increase in left ventricular mass was larger and significant. Taken together with the fact that the absolute weights of all other organs were significantly reduced in the exercised animals, these data do support that the exercise regime elicited cardiac hypertrophy. The reduction in body weight seen in the exercised animals most likely resulted from a combination of reduced body fat and growth retardation. In line with this, a pilot series of less intense exercise resulted in a reduction in body weight (exercise 313 g vs. sedentary cardiac reductions 403 g), weights, and no hypertrophy after normalization to body weight or tibial length.
FEBS Journal 272 (2005) 2684–2695 ª 2005 FEBS
2687
C. C. Strøm et al. Gene expression in exercise-induced cardiac hypertrophy
Table 4. Expression changes in response to exercise. Gene names are listed with GenBank accession number; SAM score, fold change (FC) and P-values calculated by a Welch t-test are listed for comparison.
Accession number Score(d) FC P-value Gene
Metabolism
Palmitoyl-protein thioesterase Fatty acid binding protein 4 Fatty acid Coenzyme A ligase, long chain 4 Cd36 Fatty acid transport protein Uncoupling protein 2, mitochondrial Glucokinase regulatory protein Pyruvate dehydrogenase phosphatase Solute carrier 16 (monocarboxylic acid transporter), member 1 Hexokinase 1 Phosphofructokinase, liver, B-type L34262 AI169612 AI236284 AA925752 U89529 AB010743 AA945442 AF062740 D63834 AI012593 X58865 5.5 3.8 5.1 4.5 3.2 ) 4.7 4.4 3.3 4.3 3.3 3.8 1.2 1.2 1.3 1.3 1.2 0.7 1.1 1.4 1.4 1.2 1.1 3.75E-04 3.34E-03 5.17E-04 1.21E-03 1.88E-02 8.25E-04 1.72E-03 8.97E-03 1.78E-03 8.41E-03 3.61E-03 Extracellular matrix
Biglycan Matrix Gla protein Integrin alpha 7 Laminin receptor 1 Cystatin B Cystatin C Cathepsin L Cathepsin S U17834 AI012030 X65036 D25224 AI008888 AI231292 AI176595 L03201 3.3 3.2 3.4 5.3 3.9 5.9 3.8 3.5 1.3 1.3 1.2 1.2 1.2 1.4 1.1 1.5 1.74E-02 1.01E-02 7.93E-03 3.67E-04 3.25E-03 1.54E-04 5.88E-03 7.97E-03
Cytoskeletal Sarcosin Fast myosin alkali light chain (MYL1) Talin Actinin alpha 2 associated LIM protein Arg ⁄ Abl-interacting protein (ArgBP2) Myosin light chain alkali, smooth-muscle isoform (MYL6) Non-muscle myosin alkali light chain, new-born, heart ventricle (MYL4) Actin-related protein complex 1b AI639444 L00088 AA800962 AF002281 AF026505 AA875523 S77858 AF083269 3.2 3.4 3.3 3.2 4.1 4.4 4.1 3.5 1.4 1.5 1.2 1.2 1.3 1.3 1.2 1.3 8.74E-03 1.03E-02 8.57E-03 1.13E-02 2.48E-03 1.29E-03 2.08E-03 5.85E-03 Growth
Eukaryotic translation elongation factor 1 alpha 1 Eukaryotic translation elongation factor 2 Polymerase (RNA) II (DNA directed)polypeptide G Ribosomal protein L10a Ribosomal protein S16 Ribosomal protein L12 Ribosomal protein S27 PRKC, apoptosis, WT1, regulator BCL2-like 11 (apoptosis facilitator) Discs, large homolog 3 (Drosophila) (Dlgh3) Disabled homolog 2 (doc2) Rgc32 protein Growth differentiation factor 10 AI008852 AI178750 Z71925 X93352 X17665 X53504 X59375 U05989 AF065433 U50147 U95178 AF036548 D49494 4.4 4.1 3.7 6.3 3.9 3.7 4.5 ) 5.0 ) 4.4 ) 3.9 4.9 3.4 ) 3.9 1.2 1.1 1.2 1.3 1.2 1.2 1.3 0.8 0.9 0.8 1.4 1.4 0.8 3.83E-03 2.00E-03 4.01E-03 2.31E-04 5.05E-03 6.43E-03 1.28E-03 5.69E-04 1.25E-03 3.56E-03 7.47E-04 6.47E-03 4.60E-03 Inflammation
Superoxide dismutase 3 Lysozyme Complement component 1q b Complement component 1 s Z24721 AA892775 X71127 D88250 4.2 4.7 3.6 5.2 1.2 2.3 1.4 1.4 2.04E-03 3.13E-03 5.36E-03 9.23E-04 Signalling
FEBS Journal 272 (2005) 2684–2695 ª 2005 FEBS
2688
Annexin 1 Cbp ⁄ p300-interacting transactivator 2¢,3¢- Cyclic nucleotide 3¢-phosphodiesterase (CNP) Protein tyrosine phosphatase 4a1 AKAP4 AI171962 AA900476 L16532 L27843 AF008114 3.9 4.0 5.0 5.2 3.4 1.4 1.5 1.2 1.4 1.1 3.67E-03 2.69E-03 9.14E-04 4.02E-04 7.40E-03
C. C. Strøm et al. Gene expression in exercise-induced cardiac hypertrophy
Table 4. (Continued).
Gene Accession number Score(d) FC P-value
Cathechol-O-methyltransferase Guanine nucleotide binding protein, alpha inhibiting polypeptide 3 N-myristoyltransferase 1 ADRBK1 (GRK2) MAP-kinase phosphatase (cpg21) Calcium ⁄ calmodulin-dependent protein kinase 1 Cholecystokinin B receptor 5-hydroxytryptamine (serotonin) receptor 2B Prolactin receptor GABA-A receptor alpha-6 subunit Munc13–3 M93257 AI228247 AA859942 M87854 AF013144 D86556 M99418 X66842 M19304 L08495 AA943677 4.2 3.3 4.0 ) 4.3 ) 7.8 ) 4.3 ) 4.2 ) 4.3 ) 4.7 ) 4.5 ) 4.5 1.3 1.1 1.2 0.9 0.9 0.9 0.8 0.8 0.7 0.9 0.8 5.89E-03 8.47E-03 3.58E-03 2.83E-03 1.87E-04 3.47E-03 1.98E-03 3.41E-03 9.43E-04 1.49E-03 1.41E-03
Fig. 3. A scatter plot of the number of differentially expressed genes compared to the number of false-positive genes at different levels of delta. The black line represents the actual data while the three grey lines represent data from three random divisions of samples into two groups. The dotted black line represents unity, where the number of called genes is identical to the number of false positives.
Fig. 4. Expression of selected metabolic genes by quantitative PCR confirming the microarray data. Expression was normalized to GAPDH. Bars represent SEM and *P < 0.05.
eral of these genes in adaptive hypertrophy. Expression levels of glycolytic enzymes indicated both enhanced glycolysis and glucose oxidation to contrast the impair- ments of glucose oxidation in maladaptive hypertrophy. We also identified several differences in expression of
Overall, gene expression patterns in adaptive cardiac hypertrophy were quite similar to previously published data from maladaptive cardiac hypertrophy. A general upregulation of signalling, cytoskeletal and extracellular matrix genes was evident and the isoform shifts in sarcomeric proteins resembled those of maladaptive hypertrophy. The most prominent difference from the maladaptive response was differential expression of a set of metabolic genes not previously associated with exer- cise-induced cardiac hypertrophy. While downregula- tion of genes involved in lipid oxidation is typical of maladaptive hypertrophy, we found upregulation of sev-
FEBS Journal 272 (2005) 2684–2695 ª 2005 FEBS
2689
C. C. Strøm et al. Gene expression in exercise-induced cardiac hypertrophy
ously hypertensive rats [20], and myocardial recovery from ischaemia is impaired in CD36 knockout mice [21]. Thus the differential expression of CD36 between maladaptive and adaptive hypertrophy might be of key importance for the difference in clinical outcome in the two conditions.
Fig. 5. Expression of UCP2 and CD36 by quantitative PCR in mal- adaptive hypertrophy 3 weeks after myocardial infarction (mi). UCP2 was significantly upregulated while CD36 expression was unchanged contrasting the findings in adaptive hypertrophy. Expres- sion was normalized to GAPDH. Bars represent SEM and *P < 0.05.
signalling proteins between adaptive and maladaptive hypertrophy including important modulators of adren- ergic signalling.
Glucose utilization through glycolysis is enhanced in hypertrophic hearts [22,23]. However, there is no cor- responding increase in rates of glucose oxidation [22,23]. The consequent low coupling of glucose oxida- tion to glycolysis is functionally relevant, as it contri- butes to the contractile dysfunction in hypertrophic hearts [23]. The multienzyme pyruvate dehydrogenase complex (PDC) catalyses the oxidative decarboxylation of pyruvate and contributes strongly to flux control of myocardial glucose oxidation. The activity of PDC is continuously regulated by balance of inhibiting pyru- vate dehydrogenase kinase and activating pyruvate dehydrogenase phosphatase (PDP) reactions [24]. We found upregulation of the PDP gene, thus, suggesting an increased glucose oxidation in exercise-induced hypertrophy. GCKR was upregulated; this has been shown to increase both glucokinase protein and enzy- matic activity levels, leading to improved glucose toler- ance and lowered plasma glucose in diabetic mice [25]. In accordance with these data, we found upregulation of glucokinase (hexokinase 1) in hearts of exercised rats. Further evidence of enhanced glycolysis came from the upregulation of 6-phosphofructo-2-kinase ⁄ fructose-2,6-bisphosphatase that stimulates 6-phospho- fructo-1-kinase [26], a key enzyme of glycolysis, which was also upregulated in our experiments. Collectively, these findings support the notion that cardiac capacity for glucose utilization is in fact increased by adapta- tion to exercise and that a transcriptional explanation for this aspect of functional improvement exists.
Perhaps the most striking and potentially physiologi- cally meaningful observation was the shift in metabolic gene expression. This finding is especially interesting as it differentiates adaptive from maladaptive hypertro- phy and could be the molecular mechanism underlying earlier findings of a balanced growth of cardiomyo- cytes with a normal ratio of mitochondria to cell num- to mitochondrial ber [10,17] and normal myofibril ratio [5,6] in adaptive hypertrophy.
In our study, several genes involved in b-oxidation of lipids (CD36, FACL, fatty acid binding protein) were upregulated. Genes involved in b-oxidation are downregulated in maladaptive cardiac hypertrophy [18,19]. One gene, CD36 or Fat, encoding a fatty acid translocase, was upregulated in response to exercise regulated after maladaptive hypertrophy. but not CD36 has recently been shown to be responsible for the defect in fatty acid metabolism seen in spontane-
We found significant downregulation of UCP2 in response to exercise, while UCP2 was upregulated in maladaptive hypertrophy. Uncoupling proteins dissipate the proton electrochemical gradient formed during mito- chondrial respiration and generate heat production instead of ATP [27]. Thus, ATP production through oxidative phosphorylation might be more effective in adaptive than in maladaptive hypertrophy due to differ- ences in UCP2 expression. In line with this, UCP2 was recently found to be upregulated in several different transgenic models of cardiomyopathy induced by chro- nic b-adrenergic receptor signalling [28]. The upregula- tion of UCP2 was partly reversed by b-adrenergic receptor blockade. In response to volume overload, UCP2 expression was increased and this increase was partly reversed by an angiotensin converting enzyme (ACE)-inhibitor [29]. UCP2 has previously been found
FEBS Journal 272 (2005) 2684–2695 ª 2005 FEBS
2690
C. C. Strøm et al. Gene expression in exercise-induced cardiac hypertrophy
exercise contributed to the inflammatory response and exercise of more moderate extent with slower and continuous time course may induce hypertrophy without inflammation.
to be downregulated in response to exercise [30]. Thus, upregulation of UCP2 seems a general feature of mal- adaptive cardiac remodelling, and the well documented beneficial effects of ACE-inhibitors and b-adrenergic receptor-blockade are accompanied by decreased UCP2 expression. These findings indicate that the downregula- tion of UCP2 in adaptive hypertrophy constitutes a molecular feature of ‘adaptiveness’ and that upregula- tion of UCP2 may be a key factor underlying defective energetics in diseased hearts.
Several of the differentially regulated signalling pro- teins have also been reported to change in maladaptive hypertrophy (Cbp ⁄ p300-interacting transactivator, pro- tein tyrosine phosphatase 4a1, annexin 1 and cyclic nucleotide 3¢-phosphodiesterase) [18,32,33]. Adrenergic signalling is important in cardiac hypertrophy and we found differential expression of several genes involved in adrenergic signal transduction (catechol-O-methyl transferase, GRK2, AKAP4 and Gai3). GRK2 desen- sitizes G-protein coupled receptors and is upregulated [37] in maladaptive hypertrophy. We found downregu- lation of GRK2 in adaptive hypertrophy pointing to a potentially important difference in adrenergic signal- ling between maladaptive and adaptive hypertrophy.
In accordance with previous reports we did not find activation of the typical neonatal gene expression pat- tern found in pathological hypertrophy, which includes uprelation of atrial natriuretic peptide, B-type natriure- tic peptide, a-skeletal and smooth muscle actin, and b-myosin heavy chain [16]. However, exercise-induced hypertrophy was accompanied by a marked upregula- tion of genes involved in extracellular matrix remode- ling (biglycan, matrix gla protein, cathepsins, cystatins, integrin a7 and laminin receptor). These genes are con- sistently upregulated in pathological models of cardiac hypertrophy indicating that these genes are necessary to the cardiac growth response [18,31,32]. In contrast to pathological models of cardiac hypertrophy we found no increase in collagen mRNA expression.
In conclusion, we have used DNA microarrays to map gene expression in adaptive hypertrophy. While expression of extracellular matrix proteins and sarco- meric proteins was similar to the changes known to occur in maladaptive hypertrophy, we found striking differences in expression of genes involved in metabo- lism between adaptive and maladaptive hypertrophy.
Experimental procedures
in
be
upregulated
pathological
Animal handling and training procedure
We found upregulation of a number of cytoskeletal genes. Several of these genes were previously described to hypertrophy (MYL 1, 4 and 6, sarcosin, talin, actin-related protein complex 1b and ArgBP2) [31,33]. Upregulation of acti- nin a2 associated Lim11/rat Isl-1/Mec3 (LIM) protein (ALP) in cardiac hypertrophy has not been described previously but ALP– ⁄ – mice develop cardiomyopathy [34]. In the only microarray study on exercise-induced cardiac hypertrophy reported to date, MYL 4 upregu- lation was also found and confirmed by 2D gel electro- phoresis [35]. The study only employed three DNA microarrays in each group and did not use a statistical method to identify differentially expressed genes.
We
found prominent upregulation of proteins involved in protein synthesis (eukaryotic translation elongation factor 1 alpha 1, eukaryotic translation elongation factor 2, RNA polymerase II polypeptide G and several ribosomal proteins). These findings are consistent with the increased demand for protein syn- thesis in response to cardiac hypertrophy.
Twenty-four male Wistar rats (Taconic M & B, Ejby, Denmark) weighing 285 ± 10 g (mean ± SD; n ¼ 24) were randomly assigned to either a seven-week treadmill running program (n ¼ 12) or served as sedentary controls (n ¼ 12). The animals had free access to food (standard rodent pel- lets) and water. Rats in the running group were exercised on a custom-built 12-lane treadmill with an 8(cid:1) inclination for 2 hÆday)1, 5 daysÆweek)1, for 7½ weeks between 12 : 00 and 17 : 30. Each training session started with a 20-min warm-up at 11 mÆmin)1 the first week gradually increasing to 18 mÆmin)1 the last 3 weeks. Running speed was set to 15 mÆmin)1 the first week, gradually increasing to level at 32.5 mÆmin)1 the final 2½ weeks, while the duration was reduced from 100 min to 80 min for the final 2½ weeks. After 1 week of training one rat had a small injury to one of its feet and was therefore withdrawn from further exer- cise and excluded from the study. The experiments were approved by the Animal Experimentation Inspectorate of the Danish Ministry of Justice and the investigation con- forms to the Guide for the Care and Use of Laboratory Animals published by the US National Institutes of Health (NIH publication no. 85-23, revised 1996). The day after completion of the training protocol, all animals were sub-
In accordance with previous studies on maladap- tive hypertrophy [18,36] we found upregulation of inflammatory genes (superoxide dismutase 3, comple- ment component 1qb and 1c, lysozyme and others) indicating that inflammation is a general feature of cardiac hypertrophy. We cannot exclude the possibil- the strong physical stress induced by the ity that
FEBS Journal 272 (2005) 2684–2695 ª 2005 FEBS
2691
weight of the left ventricle was increased in infarcted ani- mals compared to controls, indicating left ventricular hypertrophy of the noninfarcted ventricle.
jected to echocardiography and hemodynamic examination under isoflurane anesthesia before being killed. Hearts were excised, rinsed in ice-cold saline, weighed, dissected into left and right ventricles, frozen in liquid nitrogen and stored at )80 (cid:1)C until mRNA extraction.
C. C. Strøm et al. Gene expression in exercise-induced cardiac hypertrophy
Gene expression profiling
As exercise resulted in a significantly reduced body weight (BW) when compared to sedentary controls, normal- ization of organ weights to BW would result in apparent hypertrophy of all organs in the training animals. For valid comparison of experimental groups, organ weights were instead normalized to lean body mass, estimated as BW0.78 [38], rendering only weights of total heart and left and right ventricles different between groups, while lung, kidney and stomach were not.
Echocardiography
Echocardiography was performed during anesthesia with 1–1.5% isoflurane using a Vivid Five Echocardiograph (GE Medical Systems Ultrasound, Little Chalfont, UK). Recordings were stored digitally for off-line analysis. Left ventricular cavity and wall dimensions were measured in 2D short axis recordings at the level of the papillary muscles.
The GeneChip RGU34A from Affymetrix containing 8740 probe sets (and 59 control probe sets which were excluded from further analysis) was used for all hybridizations. The probe sets represent approximately 6000 known rat genes, the rest being ESTs (see http://www.affymetrix.com for a more detailed description). Standard protocols for chip hybridizations available at http://www.affymetrix.com were used. Briefly, cDNA was synthesized from total RNA extracted from the tissue samples by Trireagent (Molecular Research Center, Inc., OH, USA). cDNA was then used for in vitro transcription to produce biotin-labelled cRNA. The cRNA was fragmented before hybridization. RNA from individual animals was hybridized to each chip and six randomly chosen samples were analysed from each group. Chip hybridizations were performed at a core facil- ity with ample experience in microarray handling to ensure quality. Raw data are available at http://www.ncbi.nlm. nih.gov/geo as series number GSE739 (access by username: revstro90, password: revstro90).
Hemodynamic examination
Array data analysis
calculated for
using
SAM available
at
A microtip transducer catheter (Millar Instruments, Hous- ton, TX, USA) was introduced from the right carotid artery and placed in the left ventricle for measurements of LVEDP and maximal rates of isovolumetric pressure devel- opment (dP ⁄ dtmax) and decline (dP ⁄ dtmin). After retraction from the left ventricle, mean arterial pressure (MAP) was measured. Simultaneous elecrocardiography was performed from subcutaneously placed needle electrodes and heart rate (HR) was calculated.
Myocardial infarction
Array data were normalized using the nonlinear invariant rank fitting method of Li and Wong available at http:// www.dchip.org [40]. Model based expression (MBE) values were each gene using dChip (perfect match only model). Differentially expressed genes were identified http://www-stat. stanford.edu ⁄ (cid:2)tibs ⁄ SAM ⁄ [41]. Briefly, SAM is a statistical approach to identify differentially expressed genes by con- trolling the FDR. The FDR is the percentage of genes iden- tified by chance. SAM identifies the differentially regulated genes by assimilating a set of gene specific t-tests. Each gene is assigned a score by dividing the average difference in gene expression between groups by the pooled SD. Genes with scores greater than threshold delta (Fig. 2, grey) are deemed potentially significant. By permutation of the
Myocardial infarction was induced by ligating the left cor- onary artery. Sham-operated animals served as controls [39]. After 3 weeks, animals were killed and total RNA was isolated from the noninfarcted part of the left ventricle as described in [36]. Despite large thinned fibrotic scars, the
Table 5. Primer sets used in quantitative PCR. Sequences are shown in the 5¢)3¢ orientation.
Gene Forward Reverse Target position Product size
FEBS Journal 272 (2005) 2684–2695 ª 2005 FEBS
2692
GTCGGTGTGAACGGATTTG GGAAAGTGAAGAGCATCATAACC GCAAAGAAGGGAAACCTGTG CCTGGATTAGGACCAAAGGA TGCAGAGGTTCTCTGGACAGT CCACTCAGCAGGGAACATCA GAAAGGGACCTCTCCCAATG CTTGCCGTGGGTAGAGTCAT ATGACACATTCCACCACCAG TCCAGTTATGGGTTCCACATC ATTTTGCTGGACTGGTCAGA GTGGGGATCACCTTTTCCTT GGCATATTTCACCGATGTACTGC GGAGGTCGTCTGTCATGAGG 859–1008 289–412 1071–1207 981–1126 1589–1739 950–1098 872–987 150 124 137 146 151 149 116 GAPDH FABP4 CD36 FACL4 GCKR Slc27a1 UCP2
C. C. Strøm et al. Gene expression in exercise-induced cardiac hypertrophy
work was supported by the John and Birthe Meyer Foundation, the Danish Heart Foundation (01-1-2-59- 22907, 99-1-2-31-22684), the Villadsen Family Founda- tion, the Foundation of 17.12.1981, the University of Copenhagen, Rigshospitalet, the Novo-Nordisk Foun- dation and the Danish National Research Foundation.
samples and recalculation of the scores, the FDR is estima- ted at different values of delta. Log2 MBE values were ana- lysed using a two-class unpaired approach with an FDR of less than 5%. For comparison, we calculated P-values for each gene by a Welch t-test, which allows for inequality of variances between groups. P-values ranged from 2.0 · 10)7 to 0.02.
References
Quantitative PCR
1 Agabiti-Rosei E & Muiesan ML (1997) Prognostic
significance of left ventricular hypertrophy regression. Adv Exp Med Biol 432, 199–205.
2 Ehsani AA, Hagberg JM & Hickson RC (1978) Rapid changes in left ventricular dimensions and mass in response to physical conditioning and deconditioning. Am J Cardiol 42, 52–56.
3 Shapiro LM (1984) Physiological left ventricular hyper-
and
trophy. Br Heart J 52, 130–135.
4 Kozakova M, Galetta F, Gregorini L, Bigalli G,
Franzoni F, Giusti C & Palombo C (2000) Coronary vasodilator capacity and epicardial vessel remodeling in physiological and hypertensive hypertrophy. Hyperten- sion 36, 343–349.
5 Weber KT, Clark WA, Janicki JS & Shroff SG (1987)
Physiologic versus pathologic hypertrophy and the pres- sure-overloaded myocardium. J Cardiovasc Pharmacol 10, S37–S50.
6 Tomanek RJ (1979) Quantitative ultrastructural aspects of cardiac hypertrophy. Tex Rep Biol Med 39, 111–122.
7 Barger PM & Kelly DP (2000) PPAR signaling in the
control of cardiac energy metabolism. Trends Cardiovasc Med 10, 238–245.
8 Hainsey T, Csiszar A, Sun S & Edwards JG (2002)
Cyclosporin A does not block exercise-induced cardiac hypertrophy. Med Sci Sports Exerc 34, 1249–1254. 9 Geenen DL, Malhotra A & Buttrick PM (1996) Angio- tensin receptor 1 blockade does not prevent physiologi- cal cardiac hypertrophy in the adult rat. J Appl Physiol 81, 816–821.
RNA was extracted de novo from all the cardiac tissue sam- ples (exercised, n ¼ 11; sedentary, n ¼ 12). Reverse tran- scription was performed using the Omniscript RT Kit (Qiagen, Valencia, CA, USA) on 2 lg total RNA samples and random hexamer primers according to manufacturer’s instructions. Primers were designed using PRIMER3 (MIT and available online at http://www-genome.wi.mit.edu/cgi/ sequence bin/primer/primer3.cgi/primer3_www.cgi) information retrieved from the NCBI database. Intron spanning pairs were used to avoid amplification of genomic sequences, and primer specificity and emergence of only the predicted size were ascertained by one product of agarose gel electrophoresis and real-time melting curve ana- lysis of all PCR products. Each sample reaction contained cDNA synthesized from 10 ng heart RNA. Standard curve reactions contained cDNA pooled from all samples and diluted 1 : 2, 1 : 4, 1 : 10, 1 : 50 and 1 : 100 (corresponding to 50, 25, 10, 2 and 1 ng of total heart RNA, respectively). DNA amplification was carried out using the RotorGene (Corbett Research, Sydney, Australia) and the SYBR green PCR Master Mix (Quantitect, Berkely, CA, USA). The reactions were set up in 0.1 mL microtubes in a total vol- ume of 20 lL with 1 lL of template. Standard curves in duplicate were included in every run, and quantification of individual samples performed by normalization to GAP- DH. Constant GADPH expression between exercised and sedentary animals was confirmed by northern blotting (data not shown). At least three independent runs were per- formed for every target transcript. The primer sets used in quantitative PCR are shown in Table 5.
10 Iemitsu M, Miyauchi T, Maeda S, Sakai S, Kobayashi T,
Statistical analysis
Fujii N, Miyazaki H, Matsuda M & Yamaguchi I (2001) Physiological and pathological cardiac hypertro- phy induce different molecular phenotypes in the rat. Am J Physiol Regul Integr Comp Physiol 281, R2029– R2036.
Array data were analysed as described above. All other comparisons were made by an unpaired Student’s t-test. P-values ¼ 0.05 were considered significant.
Acknowledgements
11 Calderone A, Murphy RJ, Lavoie J, Colombo F & Beliveau L (2001) TGF-beta(1) and prepro-ANP mRNAs are differentially regulated in exercise-induced cardiac hypertrophy. J Appl Physiol 91, 771–776.
12 Wisloff U, Loennechen JP, Falck G, Beisvag V, Currie S, Smith G & Ellingsen O (2001) Increased contractility and calcium sensitivity in cardiac myocytes isolated from endurance trained rats. Cardiovasc Res 50, 495– 508.
We thank the staff at the Microarray Center, Rigshos- pitalet, Denmark, for performing the microarray hy- bridizations and scannings. We thank Peter Schjerling for Northern blots of GAPDH and Pernille Gundelach and Katrine Kastberg for technical assistance. The
FEBS Journal 272 (2005) 2684–2695 ª 2005 FEBS
2693
13 Golub TR, Slonim DK, Tamayo P, Huard C,
Harris RA, Brownsey RW & Allard MF (2002) Pyru- vate dehydrogenase and the regulation of glucose oxi- dation in hypertrophied rat hearts. Cardiovasc Res 53, 841–851.
Gaasenbeek M, Mesirov JP, Coller H, Loh ML, Downing JR, Caligiuri MA, Bloomfield CD & Lander ES (1999) Molecular classification of cancer: class discovery and class prediction by gene expression monitoring. Science 286, 531–537.
14 Roberts CJ, Nelson B, Marton MJ, Stoughton R,
25 Slosberg ED, Desai UJ, Fanelli B, St Denny I, Connelly S, Kaleko M, Boettcher BR & Caplan SL (2001) Treat- ment of type 2 diabetes by adenoviral-mediated overex- pression of the glucokinase regulatory protein. Diabetes 50, 1813–1820.
Meyer MR, Bennett HA, He YD, Dai H, Walker WL, Hughes TR, Tyers M, Boone C & Friend SH (2000) Signaling and circuitry of multiple MAPK pathways revealed by a matrix of global gene expression profiles. Science 287, 873–880.
26 Beauloye C, Marsin AS, Bertrand L, Vanoverschelde JL, Rider MH & Hue L (2002) The stimulation of heart glycolysis by increased workload does not require AMP-activated protein kinase but a wortmannin-sensi- tive mechanism. FEBS Lett 531, 324–328.
15 Buttrick PM & Scheuer J (1987) Physiologic, biochem- ical, and coronary adaptation to exercise conditioning. Cardiol Clin 5, 259–270.
16 Jin H, Yang R, Li W, Lu H, Ryan AM, Ogasawara
27 Nicholls DG & Locke RM (1984) Thermogenic mechanisms in brown fat. Physiol Rev 64, 1–64. 28 Gaussin V, Tomlinson JE, Depre C, Engelhardt S,
AK, Van Peborgh J & Paoni NF (2000) Effects of exer- cise training on cardiac function, gene expression, and apoptosis in rats. Am J Physiol Heart Circ Physiol 279, H2994–H3002.
Antos CL, Takagi G, Hein L, Topper JN, Liggett SB, Olson EN, Lohse MJ, Vatner SF & Vatner DE (2003) Common genomic response in different mouse models of beta-adrenergic-induced cardiomyopathy. Circulation 108, 2926–2933.
17 Hardie DG & Hawley SA (2001) AMP-activated protein kinase: the energy charge hypothesis revisited. Bioessays 23, 1112–1119.
29 Murakami K, Mizushige K, Noma T, Tsuji T, Kimura S & Kohno M (2002) Perindopril effect on uncoupling protein and energy metabolism in failing rat hearts. Hypertension 40, 251–255.
18 Stanton LW, Garrard LJ, Damm D, Garrick BL, Lam A, Kapoun AM, Zheng Q, Protter AA, Schreiner GF & White RT (2000) Altered patterns of gene expression in response to myocardial infarction. Circ Res 86, 939–945.
19 Tan FL, Moravec CS, Li J, Apperson-Hansen C,
30 Boss O, Samec S, Desplanches D, Mayet MH, Seydoux J, Muzzin P & Giacobino JP (1998) Effect of endurance training on mRNA expression of uncoupling proteins 1, 2, and 3 in the rat. FASEB J 12, 335–339.
McCarthy PM, Young JB & Bond M (2002) The gene expression fingerprint of human heart failure. Proc Natl Acad Sci USA 99, 11387–11392.
20 Aitman TJ, Glazier AM, Wallace CA, Cooper LD,
Norsworthy PJ, Wahid FN, Al-Majali KM, Trembling PM, Mann CJ, Shoulders CC, Graf D, St Lezin E, Kurtz TW, Kren V, Pravenec M, Ibrahimi A, Abumrad NA, Stanton LW & Scott J (1999) Identifica- tion of Cd36 (Fat) as an insulin-resistance gene causing defective fatty acid and glucose metabolism in hypertensive rats. Nat Genet 21, 76–83.
31 Jin H, Yang R, Awad TA, Wang F, Li W, Williams SP, Ogasawara A, Shimada B, Williams PM, de Feo G & Paoni NF (2001) Effects of early angiotensin-converting enzyme inhibition on cardiac gene expression after acute myocardial infarction. Circulation 103, 736–742. 32 Weinberg EO, Mirotsou M, Gannon J, Dzau VJ, Lee RT & Pratt RE (2003) Sex dependence and temporal dependence of the left ventricular genomic response to pressure overload. Physiol Genomics 12, 113–127.
21 Irie H, Krukenkamp IB, Brinkmann JF, Gaudette GR, Saltman AE, Jou W, Glatz JF, Abumrad NA & Ibra- himi A (2003) Myocardial recovery from ischemia is impaired in CD36-null mice and restored by myocyte CD36 expression or medium-chain fatty acids. Proc Natl Acad Sci USA 100, 6819–6824.
33 Hwang JJ, Allen PD, Tseng GC, Lam CW, Fananapazir L, Dzau VJ & Liew CC (2002) Microarray gene expres- sion profiles in dilated and hypertrophic cardiomyopathic end-stage heart failure. Physiol Genomics 10, 31–44. 34 Pashmforoush M, Pomies P, Peterson KL, Kubalak S, Ross J Jr, Hefti A, Aebi U, Beckerle MC & Chien KR (2001) Adult mice deficient in actinin-associated LIM-domain protein reveal a developmental pathway for right ventricular cardiomyopathy. Nat Med 7, 591–597.
22 Allard MF, Schonekess BO, Henning SL, English DR & Lopaschuk GD (1994) Contribution of oxidative metabolism and glycolysis to ATP production in hyper- trophied hearts. Am J Physiol 267, H742–H750.
23 Wambolt RB, Lopaschuk GD, Brownsey RW & Allard MF (2000) Dichloroacetate improves postischemic function of hypertrophied rat hearts. J Am Coll Cardiol 36, 1378–1385.
35 Diffee GM, Seversen EA, Stein TD & Johnson JA (2003) Microarray expression analysis of effects of exercise training: increase in atrial MLC-1 in rat ventricles. Am J Physiol Heart Circ Physiol 284, H830–H837.
36 Strom CC, Kruhoffer M, Knudsen S, Stensgaard-Hansen F,
24 Lydell CP, Chan A, Wambolt RB, Sambandam N, Parsons H, Bondy GP, Rodrigues B, Popov KM,
Jonassen TEN, Orntoft TF, Haunso S & Sheikh SP
FEBS Journal 272 (2005) 2684–2695 ª 2005 FEBS
2694
C. C. Strøm et al. Gene expression in exercise-induced cardiac hypertrophy
(2004) Identification of a core set of genes that signifies pathways underlying cardiac hypertrophy. Comp Funct Genom 5, 459–470.
40 Li C & Hung Wong W (2001) Model-based analysis of oligonucleotide arrays: model validation, design issues and standard error application. Genome Biol 2, RESEARCH0032 Epub.
41 Tusher VG, Tibshirani R & Chu G (2001) Significance
37 Choi DJ, Koch WJ, Hunter JJ & Rockman HA (1997) Mechanism of beta-adrenergic receptor desensitization in cardiac hypertrophy is increased beta-adrenergic receptor kinase. J Biol Chem 272, 17223–17229.
analysis of microarrays applied to the ionizing radiation response. Proc Natl Acad Sci USA 98, 5116–5121.
C. C. Strøm et al. Gene expression in exercise-induced cardiac hypertrophy
Supplementary material
38 Batterham AM, George KP & Mullineaux DR (1997) Allometric scaling of left ventricular mass by body dimensions in males and females. Med Sci Sports Exerc 29, 181–186.
39 Theilade J, Strom C, Christiansen T, Haunso S &
The following material is available from http://www. blackwellpublishing.com/products/journals/suppmat/ EJB/EJB4684/EJB4684sm.htm Table S1. Expression changes in response to exercise. Table S2. Raw gene expression data.
Sheikh SP (2003) Differential G protein receptor kinase 2 expression in compensated hypertrophy and heart failure after myocardial infarction in the rat. Basic Res Cardiol 98, 97–103.
FEBS Journal 272 (2005) 2684–2695 ª 2005 FEBS
2695