Insulin-induced proliferation of bladder cancer cells is mediated through activation of the epidermal growth factor system Dorthe Ornskov, Ebba Nexo and Boe S. Sorensen
Department of Clinical Biochemistry, Aarhus Sygehus, University Hospital in Aarhus, Denmark
Keywords bladder cancer; EGF-system; insulin; proliferation
Correspondence B. S. Sorensen, Department of Clinical Biochemistry, NBG, AS, Aarhus University Hospital, Norrebrogade 44, 8000 Aarhus C, Denmark Fax: +45 89493060 Tel: +45 89493048 E-mail: boess@as.aaa.dk
(Received 14 March 2006, revised 6 September 2006, accepted 16 October 2006)
doi:10.1111/j.1742-4658.2006.05539.x
Abbreviations AR, amphiregulin; EGF, epidermal growth factor; EPI, epiregulin; HB-EGF, heparin-binding epidermal growth factor-like growth factor; IGF-R, insulin-like growth factor receptor; LH, luteinizing hormone; rHB-EGF, recombinant heparin-binding epidermal growth factor-like growth factor; TGFa, transforming growth factor a.
FEBS Journal 273 (2006) 5479–5489 ª 2006 The Authors Journal compilation ª 2006 FEBS
5479
The mechanism behind the growth-promoting effect of insulin is a subject of debate. Employing RT4 bladder cancer cells, we examined the cross-talk between insulin and the epidermal growth factor system. We found that insulin induced a time- and dose-dependent (25–1000 nmolÆL)1 insulin) increase in mRNA expression of three ligands from the epidermal growth factor system. Times for peak increase and fold increase after incubation with 250 nmolÆL)1 insulin were as follows: heparin-binding epidermal growth factor-like growth factor, 0.5 h, 1.4-fold, P < 0.05; epiregulin, 3 h, 14-fold, P < 0.0001; and amphiregulin, 3 h, 12-fold, P < 0.001. Induction of heparin-binding epidermal growth factor-like growth factor and amphi- regulin was verified at the protein level. We demonstrate that incubation of RT4 bladder cancer cells for 24 h with 250 nmolÆL)1 insulin increases pro- liferation by 43% (P < 0.0001) as compared to untreated cells. At the same time, phosphorylation and thereby activation of the epidermal growth factor receptor (HER1) was observed. Both phosphorylation and insulin- induced proliferation were almost completely inhibited by the HER1 inhib- itor Iressa (P < 0.0001). This shows that insulin leads to activation of HER1, and that HER1 plays an essential role in mediating the growth-pro- moting effect of insulin. Iressa inhibited not only the activation of HER1 caused by insulin but also the insulin-induced increase in the three ligands (heparin-binding epidermal growth factor-like growth factor, epiregulin and amphiregulin). As heparin-binding epidermal growth factor-like growth factor was induced before epiregulin and amphiregulin upon insulin stimulation, we speculated that the insulin-induced heparin-binding epider- mal growth factor-like growth factor initiated the activation of HER1, and that this in turn led to increased expression of epiregulin and amphiregulin and thereby to continued activation of HER1. Earlier reports have shown that insulin-like growth factor receptor can activate HER1 via its ligand heparin-binding epidermal growth factor-like growth factor. In accord with this, we found that treatment of RT4 cells with recombinant heparin- binding epidermal growth factor-like growth factor mimicked the effect of insulin, with induction of mRNA for the three ligands. However, the insu- lin-induced increase in mRNA expression of amphiregulin and epiregulin could not be prevented by the heparin-binding epidermal growth factor-like growth factor inhibitor CRM197, demonstrating that heparin-binding
D. Ornskov et al.
Proliferation of bladder cancer cells
epidermal growth factor-like growth factor is not essential for the insulin- induced increase in the expression of these ligands. In conclusion, we show that insulin-induced growth in RT4 cells requires activated HER1. Further- more, activation of HER1 is required for the insulin-induced increase in expression of the HER1 ligands heparin-binding epidermal growth factor- like growth factor, amphiregulin and epiregulin.
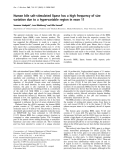
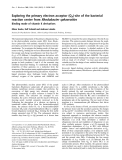
or stimulated with 250 or 1000 nm insulin for different time periods. Using real-time PCR, we found mRNA induction for three ligands of the EGF system ) HB- EGF, AR, and EPI (Fig. 1). For the ligand TGFa, no mRNA induction was observed (data not shown). HB- EGF was the most rapidly induced ligand, peaking after approximately 30 min and normalizing to base- line level within 1.5 h. With 250 nm insulin, the mRNA increase for HB-EGF was approximately 1.5- fold (P < 0.05), whereas the average amplifications of AR and EPI mRNA were 14-fold (P < 0.0001) and 12-fold (P < 0.001), respectively. Compared to HB- EGF, AR and EPI showed a slower response with maximum induction after 3 h of insulin treatment, and they returned to the baseline level after 6 h of treat- ment.
Recently, it was shown by array technology that insu- lin induces the mRNA expression of epiregulin (EPI) in adipocytes [1]. This is an interesting observation, because it points to cross-talk between insulin and the epidermal growth factor (EGF) system. The EGF sys- tem is an essential growth factor family involved in many different processes, such as proliferation, migra- tion, and differentiation [2]. Today, the EGF system constitutes a complex family including four receptors [HER1 (also known as EGF-R), HER2, HER3 and HER4] and a number of ligands. Six ligands are able to bind to HER1: amphiregulin (AR), transforming growth factor a (TGFa), EGF, b-cellulin, heparin- binding EGF-like growth factor (HB-EGF) and EPI. The ligands are produced as membrane-bound precur- sor proteins (proligands), which are released from the membrane upon proteolytic cleavage, and thereafter are able to bind to a specific receptor [3]. Binding of a ligand causes dimerization of the receptor, leading to autophosphorylation and activation of tyrosine kinase, and subsequently, a signaling cascade is initiated [4].
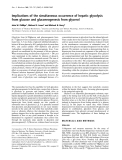
For all three ligands, the effect of insulin could also be seen at the lowest concentration tested (25 nm this low insulin concentration, insulin; Fig. 2). At the mRNA response was most pronounced for AR and EPI, with 4.2-fold (P < 0.0001) and 2.7-fold (P < 0.01) induction, respectively, whereas HB-EGF was induced 1.6-fold (P < 0.05). Regarding the EGF receptors (HER1, HER2, HER3 and HER4), no statis- tically significant differences in expression between untreated and insulin-treated cells were observed (data not shown). for
Activity of HER1 is required for insulin-induced mRNA expression of the EGF ligands
At present, it is not known how insulin stimulation leads to the induction of the EPI mRNA expression mentioned above [1], and neither has the biological role for this cross-talk been explored. However, earlier studies have shown that insulin can function as a mito- [5], and this, instance, vascular cells gen in, combined with the observation that insulin induces expression of EPI, made us question whether insulin- induced proliferation could be mediated through the EGF system. This hypothesis is activation of supported by a study on fibroblasts, which showed that treatment with insulin leads to phosphorylation and thereby activation of HER1 [6]. In this article, we show that insulin stimulates proliferation of RT4 blad- der cancer cells by a mechanism involving upregulation of three ligands from the EGF system (HB-EGF, EPI and AR) and activation of HER1.
Results
Insulin treatment of RT4 cells increases the mRNA expression of members of the EGF system
FEBS Journal 273 (2006) 5479–5489 ª 2006 The Authors Journal compilation ª 2006 FEBS
5480
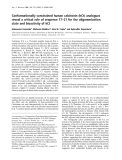
To study the effect of insulin on mRNA expression of the EGF system, RT4 cells were either left untreated insulin-induced ligands ) HB-EGF, AR and The EPI ) are all able to bind to HER1. Therefore, we decided to further investigate the role of HER1 in this insulin-induced mRNA expression. For this pur- pose, RT4 cells were either untreated or stimulated with 500 nm insulin solely or in combination with 1 or 5 lm Iressa (Fig. 3). In cells not treated with insu- lin, Iressa at concentrations of 1 and 5 lm induced a nonsignificant decrease in the mRNA expression of HB-EGF and EPI but no change in AR mRNA. A more pronounced effect of Iressa was observed in the insulin-treated cells. With 1 lm Iressa, dec- reases in the expression of AR (P < 0.001) and EPI (P < 0.05) were observed. With 5 lm Iressa, the decrease was further augmented for both AR and
D. Ornskov et al.
Proliferation of bladder cancer cells
Fig. 1. Insulin-induced mRNA expression of the EGF system: time course. RT4 cells were grown for different time periods with no insulin (s), 250 nM insulin (j), or 1000 nM insulin (,). Insulin-induced mRNA expression is shown for HB-EGF, AR, and EPI. The y-axis shows arbitrary values meas- ured by real-time PCR. All measurements are displayed as the average of four samples ± SEM, and the graph represents one of three independent experiments in which comparable results were obtained. Significant differences are observed between control cells and cells treated with 250 nM insulin ) for HB-EGF at 30 min, P < 0.05; for AR and EPI at 3 h, P < 0.0001 and P < 0.0007, respectively.
Fig. 2. Low insulin concentrations induce the EGF ligands. RT4 cells were treated with low insulin concentrations as indicated. For HB-EGF mRNA analysis, the cells were incubated for 30 min, and for AR and EPI mRNA analysis, the incubation period was 3 h. All measurements are the average of four samples ± SEM, and the graph is from one of two independent experiments that showed similar results. The y-axis shows the arbitrary values measured by real-time PCR. For each column, the differences between insulin and untreated samples is indicated as *P < 0.05, **P < 0.001 and ***P < 0.0001.
Insulin treatment increases the protein level of the EGF ligands
FEBS Journal 273 (2006) 5479–5489 ª 2006 The Authors Journal compilation ª 2006 FEBS
5481
in insulin-induced expression of role ELISA assays were used to determine whether the effect of insulin on the mRNA level also gave rise to (P < 0.0001), and a significant decrease EPI in HB-EGF was also observed (P < 0.05). These results demonstrate that activation of HER1 plays a signi- ficant the ligands.
D. Ornskov et al.
Proliferation of bladder cancer cells
Fig. 3. Activity of HER1 is required for the insulin-induced effect on the EGF ligands. RT4 cells were untreated or treated with 500 nM insulin in combination with 1 or 5 lM Iressa, as indicated in the panel below the graph. RNA was harvested after 30 min (HB-EGF analysis) and 3 h (AR + EPI analysis) of treatment. The average of four replicates ± SEM is shown, and the data represent one of three independent experi- ments that showed comparable results. The y-axis shows arbitrary values measured by real-time PCR. Iressa at 1 lM significantly prevented the insulin effect for AR and EPI (P < 0.001 and P < 0.05, respectively), whereas for HB-EGF, 5 lM Iressa was needed to achieve significant inhibition (P < 0.05). Significant differences are indicated as *P < 0.05, **P < 0.001 and ***P < 0.0001.
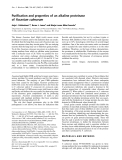
Fig. 4. The effect of insulin was also observed at the protein level. RT4 cells were treated with 250 nM insulin and ⁄ or 5 lM Iressa as indica- ted. The cells were harvested for protein analysis after 4 h (solid bar) and 24 h (hatched bar) of treatment. Changes in protein expression for HB-EGF and AR were determined using ELISA assays. Following 4 h of insulin treatment, significant increases were observed for both HB-EGF (P < 0.05) and AR (P < 0.05). This insulin-induced increased was inhibited by addition of Iressa for both ligands (HB-EGF, P < 0.05; AR, P < 0.05). Following 24 h of incubation, the effect of insulin was no longer present for either ligand. The graph represents one experi- ment with quadruple determinations ± SEM. Three independent experiments were performed, and showed comparable results. The data are given relative to the total amount of protein (ng of HB-EGF or AR per mg of protein).
FEBS Journal 273 (2006) 5479–5489 ª 2006 The Authors Journal compilation ª 2006 FEBS
5482
an increased amount of protein. RT4 cells were treated with 250 nm insulin alone or in combination with 1 or 5 lm Iressa. The cells were incubated for either 4 or 24 h. At 4 h, we found an approximately 30% induc- tion in the protein level for both HB-EGF (P < 0.05) and AR (P < 0.05), and in addition Iressa abolished this effect almost completely (P < 0.05 for HB-EGF; P < 0.05 for AR) (Fig. 4). Iressa by itself had no effect on the protein levels of HB-EGF and AR insulin in control cells. Furthermore, after 24 h of
D. Ornskov et al.
Proliferation of bladder cancer cells
combination of the two (Fig. 6A). The results showed that insulin (500 nm) stimulated proliferation. Further- the insulin-treated cells was more, proliferation of
A
treatment, the amounts of the ligands were reduced to their control levels. These results are in agreement with the data on mRNA induction, and demonstrate that the insulin-induced increase in the EGF ligands is also a transient phenomenon at the protein level. EPI was not examined, as no ELISA assay was available for this peptide.
Insulin induces proliferation of RT4 bladder cancer cells
We studied the ability of insulin to stimulate prolifer- ation of RT4 bladder cancer cells. The cells were trea- ted with insulin at concentrations from 50 nm up to 1000 nm for 24 h, and proliferation was determined by measuring [3H]thymidine incorporation. Figure 5 shows that insulin induced proliferation at all concen- trations tested. The optimal insulin concentration was 250 nm; this led to a 43% (P < 0.0001) increase in proliferation as compared to untreated cells after 24 h.
Iressa and Tyrphostin inhibit insulin-induced proliferation
B
Insulin-induced proliferation of RT4 cells. RT4 cells were Fig. 5. grown for 24 h in the presence of different concentrations of insulin as indicated. Proliferation was evaluated by measuring [3H]thymidine incorporation. Each column shows the average of eight measurements ± SEM, and represents one of two indepen- dent experiments performed in duplicate. Significant differences between insulin-treated cells and untreated cells are indicated in the figure as **P < 0.001 and ***P < 0.0001.
Fig. 6. Inhibition of HER1 prevents insulin-induced growth of RT4 cells. (A) The proliferation of RT4 cells was measured following 24 h of treatment with either insulin, Iressa or a combination of the two compounds, as indicated in the panel below the graph. [3H]Thymidine incorporation was measured in the cells. Each col- umn shows the average of eight measurements ± SEM, and repre- sents one of two independent experiments performed in duplicate in which comparable results were obtained. Significant inhibition by Iressa was observed for both untreated (1 lM, P < 0.01; 5 lM, P < 0.0001) and insulin-stimulated cells (1 lM, P < 0.0001; 5 lM, P < 0.0001). (B) The proliferation of RT4 cells was evaluated using a colorimetric method. RT4 cells were treated for 24 h with insulin, Tyrphostin or a combination of the two, as indicated in the panel below the graph. Each column is based on five double measure- ments ± SEM, and represents one of three independent experi- ments, in which comparable results were obtained. Significant inhibition of proliferation by Tyrphostin was observed for insulin- treated cells (10 lM, ***P < 0.0001), but no effect of Tyrphostin at this concentration was observed for the control cells (P ¼ 0.80).
FEBS Journal 273 (2006) 5479–5489 ª 2006 The Authors Journal compilation ª 2006 FEBS
5483
We investigated whether the HER1 inhibitor Iressa could prevent insulin-induced proliferation of RT4 cells. The cells were treated for 24 h with insulin or Iressa or a
D. Ornskov et al.
Proliferation of bladder cancer cells
A
significantly inhibited by both 1 lm (P < 0.01) and 5 lm (P < 0.0001) Iressa. Proliferation of the insulin- treated cells was inhibited to almost the same degree as that of control cells treated with the same Iressa concentration. However, as can be seen from Fig. 6A, a minor proportion of the proliferation of insulin- treated cells could not be inhibited with Iressa at either 1 lm or 5 lm, and might therefore not be HER1-dependent.
control effect cells the on
B
To verify the results obtained with Iressa, we also tested the effect of a different HER1 inhibitor (AG1478, also known as Tyrphostin) (Fig. 6B). The cells were treated as described in Fig. 6A, and the results of these experiments substantiate the stimula- tory effect of insulin (P < 0.0001) and the inhibitory effect of another HER1-specific inhibitor (AG1478) on insulin-stimulated RT4 cells (P < 0.0001). Tyr- phostin at this concentration (10 lm) had no inhibi- (P ¼ 0.80). tory Accordingly, our results demonstrate that the major part of the insulin-induced proliferation is HER1- dependent.
Insulin activates the HER1 receptor
Fig. 7. Iressa prevents the insulin-induced activation of HER1. (A) RT4 cells were treated with 250 nM insulin and ⁄ or 5 lM Iressa, as indicated. The cells were harvested for protein analysis after 4 h (solid bar) and 24 h (hatched bar) of treatment. Changes in protein expression for HER1 were determined using an ELISA assay. For HER1, no effect of insulin and Iressa was observed at either 4 h or 24 h. The graph represents one experiment with quadruple deter- minations ± SEM. Three independent experiments were per- formed, and showed comparable results. The data are given relative to total protein (nmol of HER1 per gram of protein). (B) RT4 cells were untreated or treated for 4 h with or without 250 nM insu- lin in combination with 5 lM Iressa, as indicated. Following the incubation period, the proteins were isolated and subjected to ana- lysis by western blotting. RT4 cells treated with 5 nM rHB-EGF for 1 h were included as a positive control for HER1 activity. Specific antibodies against phosphorylated HER1 (Tyr1173) and total HER1 (c-EGFR) were used. Anti-actin was used to check for equal load- ing. Two independent experiments were performed in duplicate. The western blot shows that insulin induces phosphorylation of HER1, which can be prevented by addition of Iressa. In the lower panel, actin was used as a loading control.
insulin stimulation leads that
An ELISA assay was used to determine the effect of insulin on the amount of HER1 receptor. RT4 cells were treated with insulin (250 nm) for either 4 or 24 h. Insulin treatment did not significantly affect the pro- tein level of HER1 at either 4 h or 24 h (Fig. 7A). Nevertheless, the result shown in Fig. 6A,B indicates that HER1 activity is crucial for the insulin signal. Therefore, western blot analysis was conducted to determine the degree of phosphorylation, and thereby the activity of the receptor, during insulin stimulation. The result of the western blot is shown in Fig. 7B, and it demonstrates to increased phosphorylation of HER1 (lane 2 versus lane 4, upper panel). This effect was almost completely blocked by the addition of Iressa (lane 4 versus lane 5). Likewise, in control cells, Iressa was also able to inhibit the activity of the receptor (lane 2 versus lane 3), which indicates that HER1 is active during normal growth of bladder cells. The amount of total HER1 receptor during the experiment was also determined by western blot (Fig. 7B, middle panel). This verified the ELISA results from Fig. 7A concerning the amount of HER1 protein present in untreated as compared to insulin-treated cells. In cells treated with HB-EGF,
FEBS Journal 273 (2006) 5479–5489 ª 2006 The Authors Journal compilation ª 2006 FEBS
5484
[7,8], and there seems to be a similar downregulation of HER1 by Iressa (lane 2 versus lane 3 and lane 4 versus lane 5). the amount of HER1 protein was reduced (lane 1 versus lane 2). This the rapid internalization and degradation of receptor upon activation is a known phenomenon
D. Ornskov et al.
Proliferation of bladder cancer cells
four
to mimic the insulin-induced response. RT4 cells were treated with 1 nm rHB-EGF, and a significant increase in the mRNA level was seen after 30 min for HB-EGF (P < 0.01) and after 3 h for AR (P < 0.0001) and EPI (P < 0.0001) (Fig. 8). For HER1, no change in mRNA was observed, although, as expected, phos- phorylation of the receptor was increased markedly (Fig. 7B). This pattern of mRNA induction corres- ponds to the results of the experiments with insulin.
Fig. 8. rHB-EGF mimics the effect of insulin on mRNA expression of the EGF ligands. RT4 cells were treated with 1 nM rHB-EGF for 30 min (HB-EGF analysis), 60 min (HER1 analysis) and 3 h (AR and EPI analysis), and subsequently harvested for RNA analysis. Each column represents triplicate determinations ± SEM, and the graph represents one of independent experiments with similar results. The y-axis shows arbitrary values measured by real-time PCR. Untreated cells (open bars) for HB-EGF, AR, EPI and HER1 were given the value 1, and rHB-EGF-induced mRNA expression (filled bars) is shown as fold induction relative to the untreated cells. For all three EGF ligands, rHB-EGF stimulation resulted in sig- nificant mRNA induction compared to the untreated cells (P < 0.05 for HB-EGF, and P < 0.0001 for AR and EPI), whereas for HER1, no difference between treated and untreated cells was found.
that
To further investigate the role of HB-EGF in insulin signaling, RT4 cells were treated with CRM197 (a known inhibitor of the HB-EGF protein) [9] in combi- nation with insulin. As shown in Fig. 9, CRM197 did not inhibit the insulin-mediated increase in the mRNA level of AR (P > 0.05), EPI (P > 0.05), or HB-EGF (P < 0.05). For control cells, there was no effect of CRM197 treatment. However, CRM197 was able to prevent the rHB-EGF-induced effects on the EGF lig- ands (data not shown), indicating the functionality of CRM197 in these cell culture experiments. Our results therefore suggest the HB-EGF protein is not essential for propagating insulin-induced activation of the EGF system.
Discussion
HB-EGF is not essential for insulin signaling in RT4 cells
insulin increases
Fig. 9. The HB-EGF inhibitor CRM197 did not significantly prevent the effect of insulin. mRNA analysis was performed on RT4 cells treated with insulin in combination with the HB-EGF inhibitor CRM197, as indicated. For HB-EGF samples, the incubation period was 60 min, and for AR and EPI analysis, the samples were incubated for 3 h. Each column shows the average of triplicate determinations ± SEM, and the graph represent one of four independent experiments with comparable results. The y-axis shows arbitrary units measured by real-time PCR. No statistically significant effect (P > 0.05) of CRM197 was observed. HB-EGF showed a trend towards inhibition by CRM197 treatment, but this was not statistically significant.
FEBS Journal 273 (2006) 5479–5489 ª 2006 The Authors Journal compilation ª 2006 FEBS
5485
In the present article, we demonstrate that insulin treatment of RT4 bladder cancer cells leads to a tran- sient and ordered induction of mRNA expression for a group of ligands of the EGF system (HB-EGF, EPI and AR). Furthermore, the proliferation of the cells, which is accompanied by activation of HER1. Inhibition of HER1 decreases As HB-EGF mRNA was induced before AR and EPI mRNA in our experiments (Fig. 1), we speculated that HB-EGF could be the second messenger in insulin- induced activation of HER1, and that this activation led in turn to increased expression of the other ligands, thereby propagating the insulin signal. Therefore, we tested the ability of recombinant HB-EGF (rHB-EGF)
D. Ornskov et al.
Proliferation of bladder cancer cells
both insulin-induced ligand expression and insulin- induced proliferation.
three
Insulin-induced expression of the EGF ligand EPI has been described previously. A microarray study on adipocytes showed that EPI mRNA was highly induced following 3 h of insulin treatment [1]. Further- more, a microarray study on fibroblasts revealed that insulin stimulation for 4 h leads to significant induc- tion of EPI mRNA [10]. These results, together with ours, indicate that insulin is able to induce the EGF system in several cell types. Our more detailed analysis further shows that insulin-induced expression is not limited to EPI, but also involves HB-EGF and AR. Interestingly, the temporal pattern of mRNA induction differed significantly between the species. HB-EGF mRNA expression showed rapid induction, peaking after 30 min and declining to baseline within 2 h. AR and EPI had more pronounced mRNA expression, peaking after 3 h and returning to baseline levels after approximately 6 h of insulin stimulation. The short pulse of mRNA expression observed for HB-EGF may explain why the study on fibroblasts did not find HB-EGF to be induced after 4 h of insulin treatment [10].
An ordered and transient induction of EGF ligands was also observed in a study on activation of the EGF system in follicular cells by the luteinizing hormone (LH). LH transiently induces the EGF ligands AR, EPI and b-cellulin in the same time-frame as in our experiment. The activation of the EGF system is most likely responsible for mediating the LH signal through- out the follicle, leading to cumulus expansion and oocyte maturation [11]. Thus, it appears that the EGF system can function as a second messenger in LH sti- mulation or in insulin signaling, as demonstrated in this article. Interestingly, this second messenger system is induced as a pulse, even though the initial stimulus (LH, or in our case insulin) is present throughout the experiment. Surprisingly, we observed that
FEBS Journal 273 (2006) 5479–5489 ª 2006 The Authors Journal compilation ª 2006 FEBS
5486
insulin stimulated phosphorylation of HER1, and that inhibition of this phosphorylation by the specific HER1 antagonists Iressa and Tyrphostin led to inhibition of expression of the EGF ligands. The results demonstrate that activ- ation of HER1 is involved in upregulation of the EGF ligands. However, this also means that induction of ligand mRNA expression cannot be the initial event that induces insulin activation of HER1. Our data demon- strate that treatment with HB-EGF results in increased expression of the ligands that is comparable to that induced by insulin. This is in accord with the view that activation of HER1 induces an autocrine loop capable of propagating the initial activation of HER1. Several mechanisms have been described that lead to initial activation of HER1. HER1 may be transactivat- ed by G-protein-coupled receptors that mediate the liberation of membrane-bound EGF ligands, such as from the membrane-bound proHB-EGF HB-EGF, [12]. The liberated ligand will subsequently bind and activate the receptor. A release of soluble EGF ligands by receptor activation has been identified for other receptor systems as well, such as the LH receptor [11], the adrenergic receptor [13], and the insulin-like growth factor receptor (IGF-R) [12]. More recently, it has also been shown that proAR and proTGFa can be involved in G-protein coupled receptor (GPCR)-induced activa- tion of HER1 [14,15]. We were able to test whether membrane-bound HB-EGF was the second messenger mediating the insulin-induced signal in RT4 cells. We concluded that this was not the case, as treatment of the cells with the HB-EGF inhibitor CRM197 did not influence the insulin-induced effect on expression of the EGF ligands. This suggests that insulin activation of the EGF system differs mechanistically from IGF-R induced activation of the EGF system. IGF-R-induced activation of the EGF system has previously been shown to be mediated through release of HB-EGF from its membrane-bound precursor form [12,16]. Obviously, our results do not exclude the possibility that other ligands of the EGF system could be activ- ated by the insulin receptor and thereby be able to initi- ate the activation of HER1. A candidate is AR, which has been reported to function as a second messenger in GPCR activation of HER1 [14]. Yet another possibility is that insulin induces activation of HER1 that is inde- pendent of ligand binding. Such a mechanism has been described for activation of HER1 by cytotoxic drugs [17]. Although the mechanism behind insulin-induced activation of HER1 is not fully clarified, our data dem- onstrate that the EGF system plays a central role in insulin-induced growth of RT4 cells. In diabetes, insu- lin has been shown to induce proliferation of vascular smooth muscle cells, suggesting that insulin might be involved in the progression of atherosclerosis [18]. Another study, performed on rabbit blastocysts, also showed that insulin functions as a growth-inducing fac- tor without affecting glucose transport [19]. Thus, insu- lin has the ability to function as a mitogen in a number of different cell types, and therefore could be directly involved in the complications associated with the diabetic condition. Our findings that the EGF system is required for insulin signaling, and that this can be inhibited by Iressa, opens up the possibility that inhibi- tion of the EGF system might have a favorable effect on the complications associated with the diabetic condi- tion. A recent paper supports this idea, as it was found
D. Ornskov et al.
Proliferation of bladder cancer cells
Denmark) supplemented with 10% fetal bovine serum and 1% penicillin ⁄ streptomycin (Invitrogen, Life Technologies). They were incubated at 37 (cid:2)C in a humidified 5% CO2 atmosphere. For experimental purposes, subconfluent cells were used. At the beginning of an experiment, the medium was replaced with fresh DMEM supplemented with 10% fetal bovine serum, 1% penicillin ⁄ streptomycin and the desired additives. When Iressa was used, dimethylsulfoxide was added to the remaining flasks in the experiment. The maximum dimethylsulfoxide concentration in the medium was 0.05%.
that the kidney enlargement observed in experimental diabetes could be prevented by inhibition of HER1 [20]. Furthermore, in a study on diabetic rats, HER2 was shown to be involved in the development of vascu- lar dysfunction; however, inhibition of HER1 reversed these conditions [21].
RNA purification
In summary, the present study demonstrates that there is an interplay between insulin and the EGF system. Insulin induces ordered expression of three the EGF system through a mechanism ligands of involving activation of HER1. Furthermore, insulin- induced proliferation of RT4 cells requires activation of HER1, and importantly, the HER1 inhibitors Iressa and Tyrphostin can prevent this effect of insulin. Fur- ther investigations of the cross-talk between insulin and the EGF system will be important in relation to diseases such as diabetes.
Experimental procedures
At the end of an experiment, RT4 cells were harvested and collected by centrifugation at 500 g for 5 min (Labofuge 400R, Hereus, with round bucket rotor). Immediately there- after, lysis buffer was added to the cells, following the pro- tocol supplied by the Total RNA Isolation Kit from Qiagen (Ballerup, Denmark). The RNA concentration was determined using the RiboGreen RNA Quantification Kit (Invitrogen, Life Technologies).
Materials
rHB-EGF was obtained from R&D Systems. The HB-EGF inhibitor CRM197 [(Glu52) diphtheria toxin], human insu- lin and Tyrphostin were supplied by Sigma–Aldrich (Brøndby, Denmark). Iressa was supplied by Biaffin GmbH & Co. KG (Kassel, Germany) and dissolved in dimethyl- sulfoxide. For western blot analysis and ELISA assays, a number of different antibodies were used. Actin was obtained from Sigma-Aldrich, and the antibodies c-EGFR and pEGFR (Tyr1173) were obtained from Santa Cruz Laboratories (Santa Cruz, CA). For actin detection, the secondary antibody was anti-mouse, and for the remaining antibodies, the secondary antibody was anti-rabbit (Dako- Cytomation, Glostrup, Denmark).
Total RNA was used for the production of cDNA as des- cribed in Sorensen et al. [22]. Subsequently, the mRNA was quantified by real-time PCR using the Lightcycler equip- ment (Roche, Hvidovre, Denmark). In Table 1, the specific primer sequence, concentration of primer, size of PCR product and annealing temperature are listed for each measured gene. PCR amplification of EPI and HER4 was performed using the LightCycler FastStart DNA Mas- terPLUS SYBR Green I kit from Roche. The following PCR program was applied: 10 min of initial melting at 95 (cid:2)C, followed by 45 cycles with 10 s of denaturation at 95 (cid:2)C, 10 s of annealing, and elongation for 5 s at 72 (cid:2)C.
RT-PCR and real-time PCR
RT4 bladder cancer cells were obtained from the American Type Tissue Culture Collection. They were cultured in Taastrup, DMEM (Invitrogen,
Technologies,
Life
PCR amplification of AR, HB-EGF, TGFa, HER1, HER2 and HER3 was performed according to the Plat- inum SYBR Green qPCR SuperMix UDG Kit (Invitro- genTM, Life Technologies). The PCR program was as follows: 2 min at 50 (cid:2)C, followed by 2 min at 95 (cid:2)C, and
Table 1. PCR conditions for the genes measured.
Gene
Primer concentration (pmol)
Size (bp)
Sense primer (5¢- to 3¢)
Antisense primer (5¢- to 3¢)
Annealing temperature ((cid:2)C)
CCCCTTGCCTTTCTTCTTTC CTGTACCATCTGCAGAAATA ACCTGTTCAACTCTGACTGA
GGTACTCGTCGGCATC
282 61 238 60 266 58 528 70 261 54 272 68 365 65 265 65
5 HB-EGF GTGGTGCTGAAGCTCTTTC 10 EPI AAAGTGTAGCTCTGACATG AR 10 GCTCAGGCCATTATGC GCCCGCCCGTAAAATGGTCCCCTC GTCCACCTGGCCAAACTCCTCCTCTGGG 5 TGFa 5 HER1 TAGTCGCCCAAAGTTCC 10 HER2 AGATGTTCGGCCCCAGCCCCCTT GTGGAGCCCCCCGCTCTGGTG 5 HER3 GGTGCTGGGCTTGCTTTT 5 HER4 TGTGAGAAGATGGAAGATGGC
CGTGGCTGGAGTTGGTGTTA GTTGTGGTAAAGTGGAATGGC
FEBS Journal 273 (2006) 5479–5489 ª 2006 The Authors Journal compilation ª 2006 FEBS
5487
Cell culture
D. Ornskov et al.
Proliferation of bladder cancer cells
subsequently 45 cycles with 5 s of denaturation at 94 (cid:2)C, and 10 s of annealing and 10 s of elongation at 72 (cid:2)C.
For all the PCR reactions, quantification was based on a calibration curve composed of total RNA from HCV29 bladder cancer cells. A serial dilution of 6 was used with the following RNA concentrations: 1.0, 0.25, 0.125, 0.0625, 0.03125 and 0.0078 lgÆlL)1. The results of each unknown sample are given as arbitrary units, which represent the amount of mRNA in 0.1 lg of total RNA calculated on the basis of the standard curve. A positive and negative control were included in each run. Analysis of the data was performed with the lightcycler software version 3.5.
were starved for 24 h in medium containing 1% fetal bovine serum. Treatment of the cells was initiated by adding fresh medium containing insulin and ⁄ or Iressa at different concentrations. In addition, 1 lCi of [3H]thymi- dine was added to each well. Following a 24 h growth per- iod, the medium was removed and the cells were washed with NaCl ⁄ Pi. The cells were fixed with 100% methanol for 10 min, air-dried for 5 min, and washed again three times with ice-cold 10% trichloroacetic acid for 5 min. Finally, 100 lL of 1% SDS (in 0.3 m NaOH) was added to each well, and the plate was incubated at room temperature overnight. On the following day, 40 lL of solution from each well was added to a new plate, mixed with 200 lL of scintillation liquid, and incubated for a minimum of 1 h in the dark. Using a scintillation counter, the amount of incorporated [3H]thymidine was determined for each well (counts per minute).
Proliferation Assay
Isolation of protein was performed as described in Schooler & Wiley [23]. All buffers included in the isolation procedure contain orthovanadate, which maintains phosphorylated proteins in the activated state. The protein concentration was determined using the BCA protein assay (Pierce, IL). The protein extracts were used for western blot analysis and ELISA assays.
Protein isolation
To confirm the results of the [3H]thymidine-based assay, insulin-induced proliferation of RT4 cells was also evalu- ated using a colorimetric method ) CellTiter 96 Aqueous Non-radioactive Cell (Promega, Mannheim, Germany), according to supplier instructions. The cells evaluated using this assay were treated in the same way as described for the [3H]thymidine-based assay, except that a different HER1 inhibitor (AG1478, Tyrphos- tin) was used instead of Iressa.
ELISA assay
Acknowledgements
Noncompetitive sandwich ELISA reactions were carried out for HER1, HB-EGF and AR as previously described in Christensen et al. [24], Jorgensen et al. [25], and Torring et al. [26], respectively. The only difference was in the buff- ers used for protein isolation, which were as described above.
We thank Birgit Mortensen, Lone Vad, Alice Willem- oes and Inger Marie Jensen for skilled technical assist- ance. The Danish Medical Research Council and the Danish Cancer Society supported the work. Western blot
References
1 Sartipy P & Loskutoff DJ (2003) Expression profiling identifies genes that continue to respond to insulin in adipocytes made insulin-resistant by treatment with tumor necrosis factor-alpha. J Biol Chem 278, 52298– 52306.
2 Brown KD (1995) The epidermal growth factor ⁄ trans-
forming growth factor-alpha family and their receptors. Eur J Gastroenterol Hepatol 7, 914–922.
3 Harris RC, Chung E & Coffey RJ (2003) EGF receptor
ligands. Exp Cell Res 284, 2–13.
Thirty-five micrograms of protein sample was mixed with SDS sample buffer and loaded onto an SDS ⁄ PAGE gel. For the positive control, only 20 lg was used for the elec- trophoresis. Following electrophoresis, the proteins were blotted onto a poly(vinylidene difluoride) membrane (Boeh- ringer Mannheim, Mannheim, Germany). The membrane was blocked for 1 h using a blocking buffer composed of 5% milk, 5% Tween, 150 nm NaCl and 50 nm Tris ⁄ HCl (pH 7.5). Thereafter, the membrane was probed with speci- fic antibodies overnight (see Materials), and this was fol- lowed by incubation with the secondary peroxidase-coupled antibody for 1 h. The proteins were visualized using the ECL detection system (ECL Kit; Amersham Pharmacia Biotech, Little Chalfont, UK). Equal loading was checked by incubation with anti-actin.
4 Jorissen RN, Walker F, Pouliot N, Garrett TP, Ward CW & Burgess AW (2003) Epidermal growth factor receptor: mechanisms of activation and signalling. Exp Cell Res 284, 31–53.
5 Jiang ZY, He Z, King BL, Kuroki T, Opland DM,
Suzuma K, Suzuma I, Ueki K, Kulkarni RN, Kahn CR et al. (2003) Characterization of multiple signaling path- ways of insulin in the regulation of vascular endothelial
Five thousand RT4 cells were seeded in a 96-well plate and incubated in normal DMEM for 4 days. Thereafter, cells
FEBS Journal 273 (2006) 5479–5489 ª 2006 The Authors Journal compilation ª 2006 FEBS
5488
Proliferation assays
D. Ornskov et al.
Proliferation of bladder cancer cells
growth factor expression in vascular cells and angiogen- esis. J Biol Chem 278, 31964–31971.
vation by G-protein-coupled receptors requires metallo- proteinase cleavage of proHB-EGF. Nature 402, 884– 888.
6 Chong MP, Barritt GJ & Crouch MF (2004) Insulin potentiates EGFR activation and signaling in fibro- blasts. Biochem Biophys Res Commun 322, 535–541. 7 Burke P, Schooler K & Wiley HS (2001) Regulation of
17 Benhar M, Engelberg D & Levitzki A (2002) Cisplatin- induced activation of the EGF receptor. Oncogene 21, 8723–8731.
epidermal growth factor receptor signaling by endocyto- sis and intracellular trafficking. Mol Biol Cell 12, 1897– 1910.
8 Wiley HS, Herbst JJ, Walsh BJ, Lauffenburger DA,
18 Tuck ML, Bounoua F, Eslami P, Nyby MD, Eggena P & Corry DB (2004) Insulin stimulates endogenous angiotensin II production via a mitogen-activated pro- tein kinase pathway in vascular smooth muscle cells. J Hypertens 22, 1779–1785.
Rosenfeld MG & Gill GN (1991) The role of tyrosine kinase activity in endocytosis, compartmentation, and down-regulation of the epidermal growth factor recep- tor. J Biol Chem 266, 11083–11094.
19 Navarrete SA, Tonack S, Kirstein M, Pantaleon M, Kaye P & Fischer B (2004) Insulin acts via mitogen- activated protein kinase phosphorylation in rabbit blas- tocysts. Reproduction 128, 517–526.
20 Wassef L, Kelly DJ & Gilbert RE (2004) Epidermal
9 Chang JY, Ramseier U, Hawthorne T, O’Reilly T & van Oostrum J (1998) Unique chemical reactivity of His-21 of CRM-197, a mutated diphtheria toxin. FEBS Lett 427, 362–366.
growth factor receptor inhibition attenuates early kidney enlargement in experimental diabetes. Kidney Int 66, 1805–1814.
21 Benter IF, Yousif MH, Griffiths SM, Benboubetra M & Akhtar S (2005) Epidermal growth factor receptor tyro- sine kinase-mediated signalling contributes to diabetes- induced vascular dysfunction in the mesenteric bed. Br J Pharmacol 145, 829–836.
22 Sorensen BS, Torring N, Bor MV & Nexo E (2000)
10 Mulligan C, Rochford J, Denyer G, Stephens R, Yeo G, Freeman T, Siddle K & O’Rahilly S (2002) Micro- array analysis of insulin and insulin-like growth factor-1 (IGF-1) receptor signaling reveals the selective up-regu- lation of the mitogen heparin-binding EGF-like growth factor by IGF-1. J Biol Chem 277, 42480–42487. 11 Park JY, Su YQ, Ariga M, Law E, Jin SL & Conti M (2004) EGF-like growth factors as mediators of LH action in the ovulatory follicle. Science 303, 682–684. 12 Roudabush FL, Pierce KL, Maudsley S, Khan KD &
Quantitation of the mRNA expression of the epidermal growth factor system: selective induction of heparin- binding epidermal growth factor-like growth factor and amphiregulin expression by growth factor stimulation of prostate stromal cells. J Lab Clin Med 136, 209–217. 23 Schooler K & Wiley HS (2000) Radiometric assay of
Luttrell LM (2000) Transactivation of the EGF receptor mediates IGF-1-stimulated shc phosphorylation and ERK1 ⁄ 2 activation in COS-7 cells. J Biol Chem 275, 22583–22589.
epidermal growth factor receptor tyrosine kinase activa- tion. Anal Biochem 277, 135–142.
24 Christensen ME, Engbaek F, Therkildsen MH, Bretlau P & Nexo E (1995) A sensitive enzyme-linked immuno- sorbent assay used for quantitation of epidermal growth factor receptor protein in head and neck carcinomas: evaluation, interpretations and limitations. Br J Cancer 72, 1487–1493.
13 Slomiany BL & Slomiany A (2004) Secretion of gastric mucus phospholipids in response to beta-adrenergic G protein-coupled receptor activation is mediated by SRC kinase-dependent epidermal growth factor receptor transactivation. J Physiol Pharmacol 55, 627–638. 14 Gschwind A, Hart S, Fischer OM & Ullrich A (2003) TACE cleavage of proamphiregulin regulates GPCR- induced proliferation and motility of cancer cells. EMBO J 22, 2411–2421.
25 Jorgensen PE, Eskildsen L & Nexo E (1999) Adsorption of EGF receptor ligands to test tubes ) a factor with implications for studies on the potency of these pep- tides. Scand J Clin Lab Invest 59, 191–197.
26 Torring N, Jorgensen PE, Sorensen BS & Nexo E
15 Pai R, Soreghan B, Szabo IL, Pavelka M, Baatar D & Tarnawski AS (2002) Prostaglandin E2 transactivates EGF receptor: a novel mechanism for promoting colon cancer growth and gastrointestinal hypertrophy. Nat Med 8, 289–293.
16 Prenzel N, Zwick E, Daub H, Leserer M, Abraham R, Wallasch C & Ullrich A (1999) EGF receptor transacti-
(2000) Increased expression of heparin binding EGF (HB-EGF), amphiregulin, TGF alpha and epiregulin in androgen-independent prostate cancer cell lines. Anticancer Res 20, 91–95.
FEBS Journal 273 (2006) 5479–5489 ª 2006 The Authors Journal compilation ª 2006 FEBS
5489