The lactate dehydrogenases encoded by the ldh and ldhB genes in Lactococcus lactis exhibit distinct regulation and catalytic properties ) comparative modeling to probe the molecular basis Paula Gaspar1, Ana R. Neves1, Claire A. Shearman2, Michael J. Gasson2, Anto´ nio M. Baptista1, David L. Turner1, Cla´ udio M. Soares1 and Helena Santos1
1 Instituto de Tecnologia Quı´mica e Biolo´ gica, Universidade Nova de Lisboa, Oeiras, Portugal 2 Institute of Food Research, Norwich Research Park, UK
Keywords enzyme kinetics; ldhB; lactate dehydrogenase; Lactococcus lactis; protein modeling
Correspondence H. Santos, Instituto de Tecnologia Quı´mica e Biolo´ gica, Universidade Nova de Lisboa, Rua da Quinta Grande 6, Apt 127, 2780-156 Oeiras, Portugal Fax: +351 21 4428766 Tel: +351 21 4469828 E-mail: santos@itqb.unl.pt
Database The nucleotide sequence of the ldhB gene from L. lactis MG1363 has been submitted to the GenBank database under the accession number AY236961
(Received 2 August 2007, revised 20 Sep- tember 2007, accepted 21 September 2007)
doi:10.1111/j.1742-4658.2007.06115.x
Lactococcus lactis FI9078, a construct carrying a disruption of the ldh gene, converted approximately 90% of glucose into lactic acid, like the parental strain MG1363. This unexpected lactate dehydrogenase activity was puri- fied, and ldhB was identified as the gene encoding this protein. The activa- tion of ldhB was explained by the insertion of an IS905-like element that created a hybrid promoter in the intergenic region upstream of ldhB. The biochemical and kinetic properties of this alternative lactate dehydrogenase (LDHB) were compared to those of the ldh-encoded enzyme (LDH), puri- fied from the parental strain. In contrast to LDH, the affinity of LDHB for NADH and the activation constant for fructose 1,6-bisphosphate were strongly dependent on pH. The activation constant increased 700-fold, whereas the Km for NADH increased more than 10-fold, in the pH range 5.5–7.2. The two enzymes also exhibited different pH profiles for maximal activity. Moreover, inorganic phosphate acted as a strong activator of LDHB. The impact of replacing LDH by LDHB on the physiology of L. lactis was assessed by monitoring the evolution of the pools of glycolytic intermediates and cofactors during the metabolism of glucose by in vivo NMR. Structural analysis by comparative modeling of the two proteins showed that LDH has a slightly larger negative charge than LDHB and a greater concentration of positive charges at the interface between mono- mers. The calculated pH titration curves of the catalytic histidine residues explain why LDH maintains its activity at low pH as compared to LDHB, the histidines in LDH showing larger pH titration ranges.
l-lactate dehydrogenase
Abbreviations CPK model, Corey, Pauling, Koltun model; Fru(1,6)P2, fructose 1,6-bisphosphate; Kact, activator concentration at which conversion takes place at 50% of the maximum rate; LDH, L-lactate dehydrogenase encoded by the ldh gene; LDHB, L-lactate dehydrogenase encoded by the ldhB gene; LDH-Bs, lactate dehydrogenases of Bacillus stearothermophilus; LDH-Lp, lactate dehydrogenase of Lactobacillus pentosus; KPi, potassium phosphate buffer; MC, Monte Carlo; NTP, nucleoside triphosphate; 3-PGA, 3-phosphoglycerate; PFK, 6-phosphofructokinase; PK, pyruvate kinase.
FEBS Journal 274 (2007) 5924–5936 ª 2007 The Authors Journal compilation ª 2007 FEBS
5924
(LDH; dependent EC 1.1.1.27) is a key enzyme in homolactic fermenta- tion by L. lactis, catalyzing the reduction of pyruvate to lactate with the concomitant oxidation of NADH [1]. 1,6-bisphosphate Lactate production by starter organisms such as Lacto- coccus lactis is crucial to the dairy industry. In addi- tion to providing a characteristic flavor, lactic acid confers important preservative properties to fermented [Fru(1,6)P2]- products. Fructose
P. Gaspar et al.
Lactacte dehydrogenases of Lactococcus lactis
in crude
lactate-producing increased activity
Lactate dehydrogenase activity is widely distributed in all the domains of life and has been the object of numerous studies [2]. In L. lactis, lactate dehydrogenase is encoded by the ldh gene present in the las (lactic acid synthesis) operon that also comprises the genes coding for 6-phosphofructokinase (PFK; EC 2.7.1.11) (pfk) and pyruvate kinase (PK; EC 2.7.1.40) (pyk) [3]. However, the whole genome sequences available for L. lactis strains uncovered the presence of three genes (ldhB, ldhX and hicD) with at least 30% amino acid sequence identity to the ldh gene product [4–6].
metabolism by this strain was lactate (see below). The lactate dehydrogenase measured specific activity of at pH 7.2 0.27 ± extracts was cell 0.003 lmolÆmin)1Æ(mg protein))1, a very low value when compared with 30.6 ± 0.2 lmolÆmin)1Æ(mg pro- tein))1 determined at the same pH in the parent strain L. lactis MG1363 by Neves et al. [10]. When the assay buffer was lowered to 6.0, the pH of to the 1.7 ± 0.3 lmolÆmin)1Æmg protein)1. The activities of PFK and PK, the enzymes encoded along with LDH by the las operon, were 0.48 ± 0.02 and 1.31 ± 0.11 lmolÆmin)1Æmg protein)1, respectively. These values should be compared with 1.01 and 1.97 lmolÆmin)1Æmg protein)1 measured in the parent strain grown under similar conditions [15].
Identification of the gene encoding lactate dehydrogenase activity in L. lactis FI9078
Disruption of the ldh-encoded LDH is an action common to several metabolic engineering strategies aimed at rerouting the carbon flux towards the forma- tion of products other than lactate [7–9]. In general, the resulting mutant strains metabolize glucose via a mixed acid fermentation, producing ethanol, acetate, formate, acetoin, and 2,3-butanediol. Additionally, production of lactic acid by LDH-deficient strains has been a recurrent observation despite the undoubted the ldh gene [10–12]. In particular, inactivation of Bongers et al. [13] reported the complete recovery of lactate production in an LDH-deficient strain upon repeated subculturing under anaerobic conditions.
The lactate-producing activities were purified from crude extracts of L. lactis FI9078 and also of L. lactis MG1363 as described in Experimental procedures. The determined N-terminal amino acid sequences, MKITSRK (FI9078) and MADKQR (MG1363), were compared with the genome sequence of L. lactis MG1363 (http://www.ncbi.nlm.nih.gov/ GenBank accession number AM406671). This information, com- bined with the sequence analysis of the ldhB gene in strain FI9078, led to the conclusion that lactate produc- tion in strain FI9078 was mediated by the enzyme encoded by the ldhB gene. As expected, the enzyme pro- duced by strain MG1363 was encoded by the ldh gene. LDHB (ldhB gene product) and LDH (ldh gene prod- uct) share 43% identity in the amino acid sequence. The deduced isoelectric points were 5.2 and 4.9, respectively.
Kinetic properties of LDHB and LDH
Here we describe work with a derivative of L. lactis MG1363 defective in the ldh gene present in the las operon, strain FI9078, which converted glucose into lac- tate with a yield of over 87%. Intriguingly, lactate dehy- drogenase activity, assayed at pH 7.2 as described by Garrigues et al. [14], was barely detectable in cell extracts of this strain. These findings suggested the pres- ence of a lactate dehydrogenase with biochemical prop- erties different from those of the canonical LDH enzyme present in the parental strain MG1363. The lactate dehy- drogenase activity was purified from strain FI9078, and ldhB was identified as the gene encoding this protein (LDHB). The kinetic parameters at different pH values as well as the activation constants for Fru(1,6)P2 and inorganic phosphate (Pi) were measured and compared with those of the ldh-encoded enzyme (LDH). In addi- tion, the mechanism for the activation of the alternative gene was elucidated and structural models were gener- ated for LDH and LDHB to provide a basis for discuss- ing the distinctive catalytic properties and regulation of the alternative lactate-producing enzyme.
Results
Measurements of enzyme activities in cell extracts of L. lactis FI9078
FEBS Journal 274 (2007) 5924–5936 ª 2007 The Authors Journal compilation ª 2007 FEBS
5925
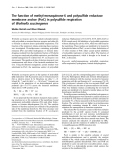
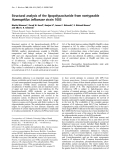
Despite the confirmed inactivation of the ldh gene in L. lactis FI9078, the major end-product of glucose The kinetic parameters of LDHB and LDH were determined at different pH values in Mes ⁄ KOH buffer with partially purified enzyme preparations. LDHB and LDH were purified 400-fold and 30-fold, from cell extracts of strains FI9078 and MG1363, respectively. The activity profiles of LDHB and LDH as a function of NADH concentration, at several pH values, are depicted in Fig. 1A,B, respectively. NADH saturation curves of LDHB became more sigmoidal with increas- ing pH, from 5.5 to 7.2, resulting in a marked decrease of the affinity for this cofactor. In contrast, LDH showed a hyperbolic kinetic response to increasing concentrations of NADH independently of pH. The Km of LDHB for NADH increased substantially
P. Gaspar et al.
Lactacte dehydrogenases of Lactococcus lactis
Fig. 1. Effect of pH on the affinity of LDHB and LDH for NADH. Saturation curves for NADH of LDHB (A) and LDH (B). Each assay mixture contained 10 mM pyruvate, 3 mM Fru(1,6)P2 and 0.03–1.7 mM NADH in 100 mM Mes ⁄ KOH at pH 5.5 (r), 6.0 (h), 6.5 (m), 7.0 (d), and 7.2 (e). All the reactions were carried out at 30 (cid:2)C. Each value is an average of at least two measurements with an error below 10%. (C) Km of LDHB (s) and LDH (n) for NADH as a function of pH. SDs are indicated by error bars.
Table 1. Effect of pH on the kinetic parameters (A) and relative activity (B) of LDHB and LDH purified from L. lactis FI9078 and MG1363, respectively. Assays were performed in 100 mM Mes ⁄ KOH at the mentioned pH and 30 (cid:2)C. All components in the reaction mixture were preincubated at 30 (cid:2)C for 5 min before addition of enzyme. Kinetic parameters were determined as described in Experimental procedures. Values of relative activity are presented as percentage relative to assays carried out under ‘control’ conditions, i.e. 10 mM pyruvate, 1 mM NADH and 3 mM Fru(1,6)P2 in 100 mM Mes ⁄ KOH. It was verified that no activity was detected when pyruvate was omitted. –, not deter- mined.
(A) Kinetic parameters
LDHB
LDH
pH 6.0
pH 7.0
pH 6.0
pH 7.0
Substrate ⁄ effector
77 ± 2d 1.3 ± 0.1 0.2 ± 0.03
364 ± 8d 2.9 ± 0.3 140 ± 16
54 ± 3 1.5 ± 0.2 0.3 ± 0.06
58 ± 6 1.7 ± 0.2 0.5 ± 0.05
Km NADHa (lM) Km pyruvateb (mM) Kact Fru(1,6)P c 2 (lM)
(B) Relative activity (%)
LDHB
LDH
Condition
pH 6.0
pH 7.0
pH 6.0
pH 7.0
3 mM Fru(1,6)P2
100 ± 6.2 110 ± 2.6 –
100 ± 2.6 88 ± 0.7 –
100 ± 0.2 100 ± 0.7 90 ± 0.6
100 ± 1.6 99 ± 1.1 71 ± 5.4
4 ± 1.3
–
22 ± 0.4 71 ± 0.1 78 ± 1.1 75 ± 1.8
4 ± 0.1 3 ± 1.1
0.1 ± 0.05 0.2 ± 0.1 0.3 ± 0.04 –
3 ± 0.1 1.3 ± 0.02 0.7 ± 0.1 –
No KPi 50 mM KPi 100 mM KPi No Fru(1,6)P2 No KPi 5 mM KPi 50 mM KPi 100 mM KPi
a NADH in the range 0.03–1.7 mM, 10 mM pyruvate, and 3 mM Fru(1,6)P2. b Pyruvate from 0 to 20 mM, 1 mM NADH, and 3 mM Fru(1,6)P2. c Fru(1,6)P2 from 0 to 10 mM, 1 mM NADH, and 10 mM pyruvate. d Calculated from a Hill function.
FEBS Journal 274 (2007) 5924–5936 ª 2007 The Authors Journal compilation ª 2007 FEBS
5926
(c. 12-fold) between pH 5.5 and pH 7.2; in contrast, the Km of LDH for NADH did not change with pH (Fig. 1C). The kinetic constants for pyruvate and Fru(1,6)P2 at different pH values were also determined (Table 1). The activity of both enzymes was a hyper- bolic function of the pyruvate concentration in the pH range examined (not shown). The Km of LDH for pyruvate did not change significantly with pH, whereas the Km value of LDHB for this substrate increased approximately two-fold between pH 6.0 and 7.0 (Table 1). Fru(1,6)P2 was an activator of LDHB and also of LDH, giving hyperbolic saturation curves. The Kact (activator concentration at which conversion takes place at 50% of the maximum rate) of Fru(1,6)P2 for LDHB was strongly dependent on pH, increasing about 700-fold when the pH changed from 6.0 to 7.0.
P. Gaspar et al.
Lactacte dehydrogenases of Lactococcus lactis
Fig. 3. Effect of pH on the activity of LDHB (d) and LDH (s). Reac- tions were carried out in 100 mM Mes ⁄ KOH with 10 mM pyruvate, 1 mM NADH and 3 mM Fru(1,6)P2 at 30 (cid:2)C. Each value is the aver- age of at least two measurements, and the SD is less than 7%.
In contrast, the Kact of Fru(1,6)P2 for LDH did not change significantly with pH (Table 1). At pH 7.0, the activation by Fru(1,6)P2 was about 30-fold, and simi- lar for both enzymes; at pH 6.0, however, Fru(1,6)P2 was absolutely required for LDH activity, whereas only a moderate activation effect (approximately 4.5-fold) was observed on LDHB (Table 1).
The effect of Pi on the activity of the two enzymes was also investigated (Table 1). LDH activity was inhibited by Pi, but the inhibitory effect was only apparent at concentrations above 50 mm: at 100 mm Pi, the LDH activity was 90 ± 0.6% (at pH 6.0) and 71 ± 5% (at pH 7.0) of the activity in the absence of phosphate. Surprisingly, at pH 6.0 and in the absence of Fru(1,6)P2, Pi was an activator of LDHB with a Kact of 2.0 ± 0.5 mm. Pi was nearly as effective as Fru(1,6)P2 for activation of LDHB, insofar as the maximal activity in the presence of Pi was 70–80% of the maximal activity conferred by Fru(1,6)P2. On the contrary, at pH 7.0, Pi was not an activator of LDHB, and when combined with Fru(1,6)P2 led to a decrease of 12% in the activity as compared to assays under ‘control’ conditions. The pH dependence of the effect of Pi as an activator of LDHB was examined in more detail. These results were compared with assays carried out in the absence of Pi (Fig. 2). At pH 7.0, the activ- ity of LDHB was very low regardless of the presence of Pi; however, at lower pH values, the stimulatory effect of Pi increased progressively, reaching a maxi- mum at a pH of about 5.5. The pH dependence of this activation fitted well with a pKa of 6.3 ± 0.1.
The pH profiles for the activities of LDHB and LDH were compared (Fig. 3). The activity of LDHB was maximal between pH 5.5 and 6.0, and decreased sharply at pH values above 6.5. Below pH 5.5, LDHB activity decreased steeply in Mes ⁄ KOH (Fig. 3), but the change in activity was rather small in phosphate buffer (results not shown). The pH profile for activity of LDH was clearly different, insofar as there was a broad plateau between pH 5.2 and 7.2. No activity was detected at pH 4.8. The presence of Fru(1,6)P2 appears to alter the profile of LDHB activity, primar- ily by extending the activity of the enzyme to higher pH values [compare plots for LDHB with and without Fru(1,6)P2 in Figs 2 and 3].
intracellularly during
The effect of lactate on the activity of LDHB was investigated under conditions mimicking those of the cytoplasm of glucose-metabolizing cells (pH 7.0, 0.3 mm NADH, and 1.2 mm pyruvate), as lactate accumulates glycolysis. At 100 mm lactate, the activity of LDHB was 86% of the value determined in the absence of lactate, and at 300 mm lactate, the activity of LDHB was only 24% of the same control value.
Fig. 2. Effect of Pi on the activity of LDHB at different pH values. Reactions containing 10 mM pyruvate and 1 mM NADH were car- ried out in the absence of any activator (s) or in the presence of 50 mM KPi (d), in 100 mM Mes ⁄ KOH at specific pH values and 30 (cid:2)C. The added KPi had the same pH as the assay buffer. SDs, indicated by error bars, are based on at least two measurements.
Characterization of glucose metabolism in nongrowing cells of L. lactis FI9078
FEBS Journal 274 (2007) 5924–5936 ª 2007 The Authors Journal compilation ª 2007 FEBS
5927
The results reported above showed that the lactate dehydrogenase activities present in the parental strain and in the mutant FI9078 were due to homofunctional enzymes displaying clear differences in kinetic and reg- ulatory parameters. Therefore, we deemed it interesting to compare glycolysis in the two strains and examine
P. Gaspar et al.
Lactacte dehydrogenases of Lactococcus lactis
A
160
(80 mm)
)
120
a and
M m
(Fig. 4A). Acetate
80
and (0.87 ± 0.07 mm)
40
( n o i t a r t n e c n o C
0 -10
10
50
70
90
30
60
8
B
)
)
M m
1.4 ± 0.6 mm, while sharply to
6
M m
40
4
20
2
( n o i t a r t n e c n o C
( s e d i t o e l c u n e n i d i r y P
0
0 -10
10
50
70
90
30
C
60
7.2
50
)
M m
anaerobic conditions. Cells of strain FI9078 displayed a growth rate (l) of 0.85 h)1. Nongrowing cells consumed [1-13C]glucose rate of at 0.25 ± 0.02 lmolÆmin)1Æ(mg protein))1, lactate (final concentration 138.7 ± 1.4 mm) was the major (1.2 ± 0.2 mm), end-product ethanol 2,3-butanediol (0.89 ± 0.04 mm) were detected as minor products. After glucose addition, Fru(1,6)P2 increased rapidly to an intracellular concentration of 43.4 ± 0.5 mm and decreased progressively to about 38 mm while glucose was present. In starved cells, the concentration of NAD+ was 5.1 ± 0.3 mm. While glucose was avail- able, the NAD+ level decreased slightly and the ex- pected concomitant increase of NADH was observed. At the onset of glucose depletion, the NAD+ level the dropped Fru(1,6)P2 pool decreased steeply to levels below the detection limit, which is about 2 mm. Concomitantly, the NADH pool rapidly increased to a maximum of 4.0 ± 0.3 mm, decreasing subsequently to undetectable levels (below 0.3 mm), while the NAD+ pool recovered quickly to 4.2 ± 0.5 mm (Fig. 4B). After glucose depletion, 3-phosphoglycerate (3-PGA) and phos- phoenolpyruvate increased to maximal concentrations of 11.7 ± 0.9 mm and 6.7 ± 0.7 mm, respectively. In addition, while glucose was available, pyruvate accu- mulation was detected (maximum level of 1.2 mm), the pyruvate being consumed after glucose exhaustion (not shown). The carbon recovery (from glucose) was 91%.
40
6.8
30
20
(Fig. 4C). After glucose addition,
6.4
( n o i t a r t n e c n o C
H p r a l u l l e c a r t n I
10
6.0
10
70
90
0 -10
50 30 Time (min)
The evolution of the intracellular pH as well as nucleoside triphosphate (NTP) and intracellular Pi lev- els were monitored by 31P-NMR in identical, parallel experiments the concentration of NTPs increased to a maximum of 9.3 ± 0.2 mm. Shortly after glucose exhaustion, a sud- den increase of intracellular Pi to about 30 mm was observed, followed by a gradual increase up to 45 mm. Upon glucose addition, the intracellular pH increased abruptly from 6.1 to 7.2, and subsequently decreased.
, phosphoenolpyruvate;
, NADH;
Fig. 4. Glycolytic dynamics of L. lactis FI9078 under anaerobic condi- tions assessed by in vivo 13C-NMR and 31P-NMR. (A) Consumption of [1-13C]glucose (80 mM) and evolution of lactate. (B) Pools of Fru(1,6)P2, NAD+, NADH, 3-PGA and phosphoenolpyruvate monitored by 13C-NMR. (C) Intracellular pH, NTP level and Pi pool determined by 31P-NMR during the metabolism of glucose (80 mM). The gray area indicates the period of glucose availability. r, glucose; , lactate; , NAD+; , 3-PGA; , intracellular pH. Fitted lines are simple interpolations.
, Fru(1,6)P2; , NTP; , Pi;
Activation of the ldhB gene by an IS905-like element in L. lactis FI9078
FEBS Journal 274 (2007) 5924–5936 ª 2007 The Authors Journal compilation ª 2007 FEBS
5928
the impact of these lactacte dehydrogenase features on the physiology of the organism. The metabolism of glucose was monitored by in vivo 13C-NMR under For comparison, the rlrD–ldhB intergenic regions were amplified by PCR, using chromosomal DNA of strains MG1363 and FI9078 as templates. Sequence analysis showed that this region in strain MG1363 is 314 bp, and highly similar to that of L. lactis NZ9000 (Gen- Bank accession number AY230155). In contrast, the intergenic region upstream of the ldhB gene of strain FI9078 is 1636 bp, and homology searches revealed
P. Gaspar et al.
Lactacte dehydrogenases of Lactococcus lactis
residues (His171)
ldhB, we identified a putative ) 10 from neighboring two histidine monomers (A and C; B and D), whose protonation will certainly affect affinity for the negatively charged Fru(1,6)P2. The proton equilibrium calculations show that, despite the fact that the two histidines are inten- sely coupled, their protonation profile is not signifi- cantly different between LDH and LDHB.
the presence of a 1314 bp IS905-like element (Gen- Bank accession number L20851) flanked by an 8 bp duplication inserted 215 bp upstream of the ldhB start codon. Assuming the same ldhB transcriptional start site as reported by Bongers et al. [13], 190 bp upstream of region (TAAAAT) derived from the native ldhB promoter, and a corresponding ) 35 region (TTGACA) in strain FI9078 that is derived from the IS905-like element. Thus, insertion of this IS element provides a consensus ) 35 region at the optimal spacing (17 bp) relative to the already existing ) 10 region, thereby leading to activation of the otherwise silent ldhB gene.
Analysis of structural models of LDHB and LDH
Regarding the catalytic differences between LDH and LDHB, namely the strong dependence of kinetic parameters on pH for the latter, for both pyruvate and NADH, the equilibrium protonation calculations may shed some light. The dependence of catalysis on pH in many cases, qualitatively understood by can be, looking at the titration behavior of active site residues. This procedure has been applied to isoforms of human lactate dehydrogenases [16]. In the case of the two lac- tate dehydrogenases studied here, His178 is the cata- lytic residue, and its average titration behavior (there are four active sites, which have small differences between them, due to the comparative modeling proce- dure) is plotted in Fig. 7. For both lactate dehydrogen- these catalytic histidines change their average ases, proton population over the whole presented interval (15 pH units). This is an indication of strong interac- tions with other residues, as we will discuss below. It is clear that the titration curve of the catalytic histidine in LDH is more extended than the corresponding one in LDHB.
Discussion
The main folds of LDH and LDHB are very similar (only LDH is shown in Fig. 5), but their surface char- acteristics show noticeable differences. LDH is slightly more negatively charged than LDHB, mainly on its solvent-exposed surface: the calculations at pH 6.0 yield overall charges of ) 31.0 for LDH and ) 21.2 for LDHB. Furthermore, the two proteins show clear dis- similarities in their surface potential distribution at the interfaces between monomers, as can be seen in Fig. 6. The zones of the active site, and the Fru(1,6)P2- and NADH-binding sites, are essentially conserved. The Fru(1,6)P2-binding sites in LDH and LDHB were compared in order to find reasons for the different pH-dependent affinities of the two proteins for this effector. Among other residues, Fru(1,6)P2 binds to
Fig. 5. Fold of LDH obtained by comparative modeling (LDHB is very similar), with the different monomers shown in different colours (A, gray; B, red; C, yellow; D, blue). The bound molecules of Fru(1,6)P2 are shown in cyan as Corey, Pauling, Koltun (CPK) models.
‘lactate revertants’
FEBS Journal 274 (2007) 5924–5936 ª 2007 The Authors Journal compilation ª 2007 FEBS
5929
L. lactis FI9078, carrying a disruption of the ldh gene, converted glucose primarily into lactic acid, similarly to the parental strain. Amino acid sequence informa- tion for the protein exhibiting this unexpected lactate dehydrogenase activity showed that it was encoded by the ldhB gene, and the activation of this gene was explained by the site-specific, oriented integration of an IS905-like element in the intergenic region upstream of the ldhB gene, thereby creating a functional pro- moter. The potential of IS905 in IS-mediated mecha- nisms of gene expression has been shown earlier, where constitutive nisin production occurred as a spontaneous event [17]. Lactate dehydrogenase-nega- tive strains are phenotypically unstable, and there is strong selection of apparent in response to metabolic need by activation of the alter- native ldhB gene. Isolation of independent strains has shown that more than one IS element is capable of this activation (IS981 [13] and IS905, this study). This is not the only mechanism by which ldhB is activated, as not all lactate producers have an increase in the inter- genic region (our unpublished results); alternatively,
P. Gaspar et al.
Lactacte dehydrogenases of Lactococcus lactis
LDHB
LDH
pH 6
pH 7
interfaces
-20 kT/e
20 kT/e
A-B
A-C
A-D
Fig. 6. Comparison between the interfacial surfaces of the LDH and LDHB monomers at pH 6 and pH 7 (left and center). The sur- face is colored according to the average electrostatic potential as shown in the potential bar below: blue corresponds to positive potentials, and red corresponds to negative potentials in the range ) 20 to + 20 kTÆe)1. The bound Fru(1,6)P2 is shown in CPK format. The surfaces on the right of the figure are color coded to show which residues are in contact with each of the three other molecules in the tetramer (defined as a distance of 3 A˚ or less between atomic coordinates), with the sur- face of Fru(1,6)P2 colored cyan. Figures were prepared using MOLSCRIPT [50], GRASP [51], RASTER3D [52], and VIEWERLITE 5.0 (Accelrys, San Diego, CA, USA).
1.0
0.9
LDHB LDH
0.8
0.7
0.6
0.5
0.4
0.3
n o i t c a r f d e t a n o t o r P
0.2
0.1
0.0
0
1
2
4
6
10 11 12 13 14 15
3
5
9
8 7 pH
Fig. 7. Simulated pH titration curves of the catalytic histidine resi- dues (His178) of LDH (thin line) and LDHB (thick line). Each curve corresponds to the average of the four histidines present in the four active sites.
through a highly conserved isoleucine residue (Ile236 in LDHB), which is replaced by valine in LDH. Despite the high level of resemblance at the sequence level, the kinetic and allosteric properties of LDH and LDHB showed notable differences: the pH sensitivity of LDHB parameters contrasted with the general insensitivity of those in LDH. Interestingly, Pi was an effective activator of LDHB, also in a pH-dependent manner. Enhancement of activity by Pi was unex- pected, as this anion is generally reported as an inhibi- tor of bacterial lactate dehydrogenases [1,18,19]. The inhibitory effect has been explained as competition with the phosphate moieties of Fru(1,6)P2 for a com- mon binding site [20–22]. Hence, it is conceivable that phosphate could to some extent mimic the role of Fru(1,6)P2 in the allosteric binding sites, thereby stabi- lizing the tetrameric active form when the preferred activator is absent. This seems to be the case in LDHB.
DNA mutations in this region may be responsible for activation [13]. Thus, the activation of an alternative homofunctional gene appears to be a common strategy to compensate for the deficiency in the las-encoded lac- tate dehydrogenase, a key activity of homofermenting lactic acid bacteria.
FEBS Journal 274 (2007) 5924–5936 ª 2007 The Authors Journal compilation ª 2007 FEBS
5930
The sequences of LDH and LDHB share a relatively in particular, the 10 high degree of identity, 43%; highly conserved residues at the Fru(1,6)P2-binding site of lactate dehydrogenases are identical, except for two residues (Ala253 and Val254 in LDH are replaced by Val253 and Ile254 in LDHB). The histidine and argi- nine residues directly involved in catalysis are identical in the two enzymes, and NADH binding is ensured We sought to understand the strong pH dependence of the kinetic parameters of LDHB as compared to the insensitive behavior displayed by LDH in terms of the structural differences between the two enzymes. The binding of Fru(1,6)P2 to allosteric lactate dehy- drogenases is connected with the conversion between the inactive T form and the active R form of the tetra- mer [23]; the affinity of LDHB for Fru(1,6)P2 changes by almost three orders of magnitude between pH 6.0 and pH 7.0. LDHB is also activated by Pi at pH 6.0, but not at pH 7.0, and shows significant activity at pH 6.0 in the absence of Fru(1,6)P2 or Pi, possibly through pyruvate binding [24]. However, we found no significant difference between the protonation states of
P. Gaspar et al.
Lactacte dehydrogenases of Lactococcus lactis
the optimal
the strain. Whereas
it levels reached much higher
representing a large excess
the His171 ligands of Fru(1,6)P2 in LDH and LDHB. A similar sensitivity was found in the LDH from Lactobacillus casei, with a change of four orders of magnitude in Kact for Fru(1,6)P2 between pH 5.0 and pH 7.0, and most of that sensitivity remained when His205 (equivalent to His188 in the present sequences) was replaced by Thr [24]. In fact, His188 titrates in the region pH 6.0–7.0 in both LDH and LDHB, as can be just seen from the change in the surface potential below the Fru(1,6)P2-binding site (Fig. 6). Instead, we postulate that the protonation of various groups in or near to the interface between monomers weakens the affinity for Fru(1,6)P2 such that its efficiency in the conversion of the T state to the active R state is reduced. In LDHB, the difference in free energy of the inactive form and the active form with Fru(1,6)P2 bound changes by approximately 15 kJÆmol)1 between pH 6.0 and 7.0, which is well within the range of elec- trostatic interactions. Examination of the model of the R state of LDH shows a much higher density of posi- tive charge in the region of contact between the mono- mers than in LDHB, particularly in the region of contact with monomer C. It is reasonable to suppose that the changes in potential between pH 6.0 and 7.0 in LDHB are sufficient to destabilize the active form. The change in affinity of LDHB for NADH, measured in the presence of saturating levels of Fru(1,6)P2, is five-fold between pH 6.0 and pH 7.0, which may well be a consequence of small changes in the conformation of the R state.
actively metabolizing glucose. The
from 0.3 mm to around 2 mm at LDH maintains its activity over a larger pH range than LDHB, and calculations show that the catalytic His178 has a broader titration curve in LDH than in LDHB (Fig. 7). As His178 participates in a pro- ton transfer, the broader the titration, the wider the interval where proton exchange is functional, as in LDH [25]. The titration behavior of His178 is deter- mined by a number of ionizing groups in the active site, which contains Asp126, Asp151 and Glu182 in close proximity. Correlation analysis [25] shows that the acidic groups, especially Glu182, have their titra- tions strongly coupled with His178, but the only one titrating in this pH range is Glu182. The titration curves of Glu182 (data not shown) are strongly shifted to high pH and broadened. Thus, when the histidine becomes protonated, the acidic groups tend to lose a proton (negative correlations), and vice versa, which effectively extends the span of both titration curves. The narrower titration curve calcu- lated for LDHB could explain the more rapid fall in its activity at low pH (Fig. 3).
FEBS Journal 274 (2007) 5924–5936 ª 2007 The Authors Journal compilation ª 2007 FEBS
5931
replacing LDH by a homofunctional protein with different kinetic properties. Comparison of maximal LDH and LDHB activities in cell extracts of strains FI9078 and MG1363 (at pH 6.0, for revealed an 18-fold lower activity in the LDHB) mutant strain. Evidence for the occurrence of a meta- bolic constraint, probably at the level of lactate dehy- drogenase, was found when comparing the glycolytic fluxes (20% lower in the mutant strain) and the per- centage of glucose channeled to products other than lactate (13% in strain FI9078 as compared with 8% in strain MG1363). Also, a decrease in the growth rate of strain FI9078 was observed: l ¼ 0.85 h)1 as compared with l ¼ 1.15 h)1 of strain MG1363 [10]. The most striking difference in the profiles of intracel- lular metabolites was the accumulation of NADH in level of the LDH-deficient NADH remained below the detection limit (about 0.3 mm NADH) during glucose metabolism in strain MG1363, in strain FI9078 during the second half of glucose utilization lactate (Fig. 4). In cell extracts of strain MG1363, dehydrogenase activity was 30 lmolÆmin)1Æ(mg pro- tein))1, (55-fold) with respect to the lactate flux measured in resting cells [10]. The low lactate dehydrogenase activity in strain FI9078 [1.7 lmolÆmin)1Æ(mg protein))1] represents only (assuming maximal activity at a four-fold excess pH 6.0) with respect to the observed lactate flux [0.44 lmol lactateÆmin)1Æ(mg protein))1]. However, the actual enzyme capacity in glucose-metabolizing cells is expected to be much lower, as the intracellular pH (7.2–7.0; see Fig. 4) is far from optimal for the opera- tion of LDHB. Additionally, the affinity of LDHB for NADH decreased considerably in this pH range, and therefore high NADH levels would be needed to ensure the required magnitude of the lactate flux. A simple calculation based on the kinetic data predicts that the level of NADH should be at least 0.5 mm at the start of glucose utilization (pH 7.2), and 0.3 mm at the end of glucose utilization (pH 7.0), to support the observed lactate flux in FI9078 cells while they level of are Fru(1,6)P2 was always high enough to ensure full activation (Fig. 4). Surprisingly, NADH was not detected (below the detection limit) during the first half of glucose utilization, indicating that the kinetic parameters determined for LDHB in vitro do not apply in vivo. On the other hand, NADH increased progressively during the second half of glucose the metabolism, onset of glucose depletion (Fig. 4). It appears that about halfway through glucose utilization, the activity The present work provides an opportunity to evalu- ate the impact on the physiology of L. lactis of
P. Gaspar et al.
Lactacte dehydrogenases of Lactococcus lactis
step,
This work illustrates a mechanism of evolutionary adaptation in L. lactis to cope with an impaired ability to regenerate NAD+. Induction of gene ldhB resulted in a strain with a moderately reduced growth rate, pos- sibly caused by the metabolic constraint detected at the level of this essential activity. The different kinetic properties and allosteric regulation of the alternative lactate dehydrogenases are attributed to a difference in electrostatic potential at the monomer–monomer inter- faces that impedes the change to the active conforma- tion of the tetramer at higher pH.
Experimental procedures
DEAE–Sepharose Fast Flow, Blue Sepharose CL-6B and Superdex 75 were obtained from Amersham Biosciences [1-13C]Glucose (99% 13C enrich- (Piscataway, NJ, USA). ment) was supplied by Campro Scientific (Veenendaal, the Netherlands). Formic acid (sodium salt) was purchased from Merck (Lisboa, Portugal). All other chemicals were of reagent grade.
Chemicals
Bacterial strains and growth conditions
of LDHB became insufficient to use the NADH pro- duced in the glyceraldehyde-3-phosphate dehydro- genase (EC 1.2.1.12) leading to build-up of NADH, which was not expected, as the levels of co- factor should be sufficient to sustain the lactate flux. Therefore, there must be an additional factor acting as an inhibitor of LDHB, and the best candidate is intracellular lactate. At an external pH of 5.5 (or lower), the 13C-resonances of intracellular and extra- cellular lactate are separated, due to the pH differ- ence in energized cells. We know that upon glucose addition, the intracellular lactate increases progres- sively, reaching maximal levels of about 180 mm and 400 mm at external pH values of 5.5 and 4.8, respec- tively (A. L. Carvalho, A. R. Neves, H. Santos, unpub- lished results). Although at pH 6.5 (working pH in this study) the profile of the intracellular lactate pool is not accessible by NMR (due to overlapping of the intracellular and extracellular lactate resonances), it is likely that it reaches levels high enough to inhibit LDHB. This view is supported by the observation that lactate concentrations above 100 mm caused con- siderable reduction in the activity of isolated LDHB under conditions mimicking those of energized cells (see Results). This would also explain the fact that NADH becomes detectable only after a period of glu- cose utilization, when intracellular lactate accumulates to inhibitory levels.
L. lactis FI9078 is a transconjugant obtained from a conju- gal mating between strains MG1614 (rifampicin- and strep- tomycin-resistant derivative of wild-type MG1363 [30]) and FI7851 (derivative of strain MG1363 in which the ldh gene was inactivated by a single crossover maintained by eryth- romycin selection [9]). From the conjugation, transconju- gants were selected showing rifampicin, streptomycin and erythromycin resistance. PCR and Southern blotting proved that the inactivated ldh gene from strain FI7851, marked by erythromycin resistance, had crossed into the MG1614 background, replacing the existing gene and giving strain FI9078.
regulation of for post-transcriptional
enzymes, 0.48 i.e. of
Strains FI9078 and MG1363 were grown in a 2 L or 5 L fermenter in chemically defined medium [31] containing 1% (w ⁄ v) glucose, at 30 (cid:2)C and pH 6.5. The pH was kept con- stant by automatic addition of NaOH. The medium was supplemented with erythromycin (5 lgÆmL)1), rifampicin (100 lgÆmL)1) and streptomycin (200 lgÆmL)1) for growth of strain FI9078. Growth was evaluated by measuring the turbidity of the culture at 600 nm and calibrating against cell dry weight measurements.
As reported previously, alteration of the las pro- moter and deletion or overexpression of the pyk gene (encoding PK) affected the expression of genes of the las operon differentially [26–28]. Moreover, evi- dence this operon has been presented [29]. Therefore, we mea- sured the activities of PFK and PK in strain FI9078, and found that they were reduced to 48% the MG1363 levels. Although the and 66% of and these activity 1.3 lmolÆmin)1Æmg protein)1, is enough to support the actual glycolytic flux in strain FI9078, it is possi- ble that the reduction in the PFK level is connected with the decrease in Fru(1,6)P2 while glucose was available.
Late exponential grown cells were harvested by centrifuga- tion (7000 g, 10 min, 4 (cid:2)C) and washed twice with 5 mm potassium phosphate buffer (KPi) (pH 6.5). For purification
Purification of lactate dehydrogenases from L. lactis strains FI9078 and MG1363
FEBS Journal 274 (2007) 5924–5936 ª 2007 The Authors Journal compilation ª 2007 FEBS
5932
After glucose exhaustion, the rapid disappearance of NADH contrasts with the profile observed for strain MG1363 (compare Fig. 4 and [10]). The reason for this behavior is probably linked to the accumulation of pyruvate (around 1 mm) detected in strain FI9078. Pyruvate accumulation further supports the existence of a metabolic constraint at the level of lactate dehy- drogenase. Once glucose was exhausted, NADH oxida- tion could proceed rapidly using pyruvate as an electron sink.
P. Gaspar et al.
Lactacte dehydrogenases of Lactococcus lactis
ated in assay mixtures containing 1 mm NADH, 10 mm pyruvate and 3 mm Fru(1,6)P2 in 50 mm KPi or 100 mm Mes ⁄ KOH. One hundred and fifty nanograms of total proteinÆmL)1 was used to assay LDHB and 300 ng of total proteinÆmL)1 to assay LDH.
of LDHB from strain FI9078 or LDH from strain MG1363, 125 and 70 g of cells (wet mass), respectively, were used as starting material. The biomass was suspended in cold 10 mm (pH 6.5), containing 200 lm phenylmethanesulfonyl KPi fluoride, 10 lm leupeptin, 10 lm antipain, 20 lgÆmL)1 deoxyribonuclease I, and 5 mm MgCl2. Cells were disrupted in a French press (SLM Aminco Instruments, Golden Valley, MN, USA) at 36 MPa, and debris were removed by ultracen- trifugation (130 000 g, 1 h, 4 (cid:2)C). All subsequent purification steps were carried out at 4 (cid:2)C.
PK and PFK activities were assayed in cell extracts as described by Garrigues et al. [14] and Fordyce et al. [32], respectively. Activities were assayed at 30 (cid:2)C in a DU-70 (Beckman, Fullerton, CA, USA) spectrophotometer equipped with a thermostated cell compartment. One unit of enzyme activity was defined as the amount of enzyme cata- lyzing the conversion of 1 lmol substrateÆ min)1. The protein concentration was determined by the method of Bradford [33] using BSA as a standard.
The kinetic parameters Km, Vmax and Kact were estimated with microcal origin (Microcal Software, Inc., North- ampton, MA, USA).
Cells were grown as described above in a 2 L fermenter, harvested in the mid-exponential growth phase (D600 ¼ 2.1), washed twice with 5 mm KPi or Mes ⁄ KOH (pH 6.5), and suspended to a protein concentration of approximately 18 mgÆmL)1 in 50 mm KPi or Mes ⁄ KOH (pH 6.5) for 13C-NMR or 31P-NMR experiments, respec- tively. Determination of NAD+ and NADH pools in vivo was performed as described elsewhere [10]. The experi- ments were performed on a Bruker DRX500 spectrometer (Bruker Biospin GmbH, Karlsruhe, Germany) at pH 6.5 and 30 (cid:2)C, and under an argon atmosphere, as described previously [10,12,34]. The quantification of end-products, intracellular metabolites and intracellular pH in living cells was also performed as described elsewhere [34].
Proteins were precipitated with ammonium sulfate (50%), collected by centrifugation (30 000 g, 30 min, 4 (cid:2)C), redissolved in 10 mm KPi (pH 6.5), and dialyzed against 10 mm KPi (pH 7.0). Samples were applied to a DEAE– Sepharose Fast Flow column equilibrated in the same buf- fer. Protein was eluted with an NaCl gradient (0.1–1 m), and fractions containing lactate dehydrogenase activity, detected at around 0.5 m NaCl, were dialyzed against 50 mm sodium acetate buffer (pH 5.5) containing 50 mm KH2PO4, applied to a Blue Sepharose CL-6B column equil- ibrated with the same buffer, and eluted as described by Williams & Andrews [22]. Active fractions were dialyzed against 5 mm KPi buffer (pH 7.0), concentrated, applied to a gel filtration column (Superdex 75), and eluted with 5 mm (pH 7.0). LDHB and LDH were purified 400-fold KPi and 30-fold, respectively. The specific activities of LDHB and LDH fractions were 681 lmolÆmin)1Æmg protein)1 and 658 lmolÆmin)1Æmg protein)1, respectively. The protein preparations were kept at ) 20 (cid:2)C and were highly stable: no loss of activity was detected after 2 years of storage. Determination of their N-terminal amino acid sequence was performed on an Applied Biosystems 477A sequencer (Applied Biosystems, Foster City, CA, USA) after blotting of the protein bands onto a poly(vinylidene difluoride) membrane (Bio-Rad, Amadora, Portugal) in accordance with the manufacturer’s instructions.
In vivo NMR experiments
Molecular techniques and sequence analysis
[14]. For
The cell extracts for measurement of enzyme activities were prepared as described by Neves et al. [10]. Lactate dehydro- genase activity was determined by measuring the rate of NADH oxidation at 340 nm (380 nm for NADH concen- trations above 0.3 mm; e ¼ 1.244 LÆmmol)1Æcm)1), essen- tially as described by Garrigues et al. the detection of LDH activity during the purification proce- the reaction mixture contained 100 mm Tris ⁄ HCl dure, (pH 7.2), 5 mm MgCl2, 3 mm Fru(1,6)P2, 0.3 mm NADH and 20 mm pyruvate (sodium salt). LDHB activity was assayed under similar conditions but using 100 mm Mes ⁄ KOH (pH 6.0) as buffer.
The kinetic characterization of both LDH and LDHB was carried out in 100 mm Mes ⁄ KOH (detailed information about concentrations and reaction conditions is presented in figure legends and tables). The pH profiles were evalu-
Chromosomal DNA was isolated from L. lactis strains according to the procedure of Lewington et al. [35]. The rlrD–ldhB intergenic regions from L. lactis MG1363 and FI9078 were amplified by PCR with primers LdhB1 (5¢-GTAATTATCATAGAGAGTTTTTAGGAG-3¢) and LdhB2 (5¢-CAAATCCTGTTCCAATCACGA-3¢), designed on the basis of available sequences of rlrD and ldhB genes from strain MG1363 [6]. PCR products of three indepen- dent reactions for each strain were combined and purified with a QIAquick PCR purification kit (QIAGEN, Crawley, UK) for further sequence analysis. Sequencing reactions were performed using ABI PRISM BigDye terminator v.1.1 in an automated ABIPRISM 310 machine (STAB VIDA, ldhB Oeiras, Portugal). To determine the sequence of in strain FI9078, the targeted region was amplified by PCR with primers LdhBfw1 (5¢-GGGGGACTAGAATTG GCTTT-3¢) and LdhBrev1 (5¢-CACTAAACCTCTGTTTT AGTGACTT-3¢), designed from 156 bp upstream of the
FEBS Journal 274 (2007) 5924–5936 ª 2007 The Authors Journal compilation ª 2007 FEBS
5933
Enzyme activity measurements
P. Gaspar et al.
Lactacte dehydrogenases of Lactococcus lactis
regions. The two Fru(1,6)P2 molecules were added after- wards, on the basis of the conformations found in the LDH-Bs.
start codon and 193 bp downstream, respectively, of the stop codon of the ldhB gene in MG1363 [6]. The PCR product was amplified using Pfu polymerase (Fermentas, York, UK) and purified as above. Sequencing reactions were performed by AGOWA GmbH (Berlin, Germany). Sequence data were assembled with clone manager 6 (Scientific & Educational Software, Cary, NC, USA) and analyzed with the blast program available at the National Center for Biotechnology Information.
Simulation of the pH titration behavior of ionizing groups of LDH and LDHB
techniques
comparative modeling
The tetramer structures of lactate dehydrogenases con- taining NADH and Fru(1,6)P2 were used in the calcula- tions. The methodologies used to simulate the binding equilibrium of protons in proteins have been described in detail elsewhere [43,44]. These are based on continuum electrostatic methods and Monte Carlo (MC) sampling of binding states. The continuum electrostatic calculations were done with the package mead (version 1.1.8) [45,46]. The sets of atomic radii and partial charges were taken from GROMOS96 [47,48]. The dielectric constants were 80 for the solvent and 20 for the protein, these values being the most efficient in predicting pKa values, as shown else- where [43,49]. The solvent probe radius was 1.4 A˚ , the ion exclusion layer 2.0 A˚ , the ionic strength 0.1 m, and the temperature 27 (cid:2)C. The program petit [43,44] was used for the MC sampling of proton binding states. Site pairs were selected for double moves when at least one pairwise term was greater than 2 pK units. Averages were computed using 105 MC steps, and correlations using 106 MC steps.
Derivation of structure models for LDH and LDHB by comparative modeling
Acknowledgements
Given the considerable similarity between the amino acid sequences of LDH and LDHB and lactate dehydrogenases with known structures, the derivation of their structures on the basis of available experimental data was feasible [36,37]. We using searched the Protein Data Bank, looking for good-quality structures of bacterial lactate dehydrogenases displaying significant sequence identity with the two lactate dehydro- genases considered here and that represent active forms. We selected the lactate dehydrogenases of Bacillus stearo- thermophilus (LDH-Bs) (Protein Data Bank code 1LDN) [38], containing NADH, oxamate and Fru(1,6)P2, solved at 2.5 A˚ resolution, and of Lactobacillus pentosus (LDH- Lp) (Protein Data Bank code 1EZ4), containing NADH [39]. LDH-Lp is a nonallosteric lactate dehydrogenase, meaning that it does not bind Fru(1,6)P2. However, this structure represents an active form and is similar to other active forms of allosteric lactate dehydrogenases [39]. The structure of LDH-Lp was selected because of the high sequence similarity with LDH and LDHB from L. lactis. The residues making up the Fru(1,6)P2-binding site were modeled on the basis of the LDH-Bs alone. LDH displays 50.8% sequence identity with LDH-Bs and 56.8% identity with LDH-Lp. LDHB displays 50.6% identity with LDH- Bs and 46.7% identity with LDH-Lp.
This work was supported by Fundac¸ a˜ o para a Cieˆ ncia e a Tecnologia (project POCTI ⁄ BIO ⁄ 48333 ⁄ 02) and FEDER. We thank Isabel Pacheco, Ana Mingote and Pedro Coelho for their contribution to protein purifi- cation, and Dr Ana Ramos for advice in the initial stages of the work. P. Gaspar acknowledges FCT for the award of a research fellowship (SFRH ⁄ BD ⁄ 6481 ⁄ 2001). C. Shearman and M. Gasson acknowledge funding by a CSG grant from the BBSRC Research Council.
References
1 Garvie EI (1980) Bacterial lactate dehydrogenases.
Microbiol Rev 44, 106–139.
2 Madern D (2002) Molecular evolution within the
L-malate and L-lactate dehydrogenase super-family. J Mol Evol 54, 825–840.
3 Llanos RM, Harris CJ, Hillier AJ & Davidson BE
(1993) Identification of a novel operon in Lactococcus lactis encoding three enzymes for lactic acid synthesis: phosphofructokinase, pyruvate kinase, and lactate dehy- drogenase. J Bacteriol 175, 2541–2551.
The program modeler (version 6.0) [40,41] was used in the comparative modeling procedures. The tetramer (the active form) was modeled plus four NADH molecules. No symmetry was imposed on the monomers within the tetra- mer. The initial alignments were iterated until the gener- satisfactory. These were ated structural models were judged on the basis of restraint violations using modeler, and on several stereochemical and conformational criteria using procheck [42]. For the final model of LDH, the percentage of residues in the most favored regions of the Ramachandran plot was 91.1%; 7.5% were located in additional allowed regions and 1.4% in generously allowed regions. There were no residues in disallowed regions. For the final model of LDHB, the percentage of residues in the most favored regions was 91.8%; 7.8% were located in additional allowed regions and 0.4% in generously allowed regions. There were also no residues in disallowed
FEBS Journal 274 (2007) 5924–5936 ª 2007 The Authors Journal compilation ª 2007 FEBS
5934
P. Gaspar et al.
Lactacte dehydrogenases of Lactococcus lactis
of different NADH oxidase levels on glucose metabolism by Lactococcus lactis: kinetics of intracellular metabolite pools determined by in vivo nuclear magnetic resonance. Appl Environ Microbiol 68, 6332–6342.
16 Read JA, Winter VJ, Eszes CM, Sessions RB & Brady
RL (2001) Structural basis for altered activity of M- and H-isozyme forms of human lactate dehydrogenase. Proteins 43, 175–185.
4 Bolotin A, Wincker P, Mauger S, Jaillon O, Malarme K, Weissenbach J, Ehrlich SD & Sorokin A (2001) The com- plete genome sequence of lactic acid bacterium Lactococ- cus lactis ssp. lactis IL1403. Genome Res 11, 731–753. 5 Makarova K, Slesarev A, Wolf Y, Sorokin A, Mirkin B, Koonin E, Pavlov A, Pavlova N, Karamychev V, Polouchine N et al. (2006) Comparative genomics of the lactic acid bacteria. Proc Natl Acad Sci USA 103, 15611–15616.
17 Dodd HM, Horn N & Gasson MJ (1994) Characteriza- tion of IS905, a new multicopy insertion sequence iden- tified in lactococci. J Bacteriol 176, 3393–3396.
18 Crow VL & Pritchard GC (1977) Fructose 1,6-diphos- phate-activated L-lactate dehydrogenase from Strepto- coccus lactis: kinetic properties and factors affecting activation. J Bacteriol 131, 82–91.
6 Wegmann U, O’Connell-Motherway M, Zomer A, Buist G, Shearman C, Canchaya C, Ventura M, Goesmann A, Gasson MJ, Kuipers OP et al. (2007) The complete genome sequence of the prototype lactic acid bacterium Lactococcus lactis subsp. cremoris MG1363. J Bacteriol 189, 3256–3270.
19 Garvie EI (1978) Streptococcus raffinolactis Orla-Jensen and Hansen, a group N streptococcus found in raw in raw milk. Int J Syst Bacteriol 28, 190–193.
7 de Vos WM & Hugenholtz J (2004) Engineering meta- bolic highways in Lactococci and other lactic acid bac- teria. Trends Biotechnol 22, 72–79.
20 Jonas HA, Anders RF & Jago GR (1972) Factors
affecting the activity of the lactate dehydrognease of Streptococcus cremoris. J Bacteriol 111, 397–403. 21 Taguchi H, Machida M, Matsuzawa H & Ohta T
8 Gaspar P, Neves AR, Ramos A, Gasson MJ, Shearman CA & Santos H (2004) Engineering Lactococcus lactis for production of mannitol: high yields from food-grade strains deficient in lactate dehydrogenase and the man- nitol transport system. Appl Environ Microbiol 70, 1466–1474.
9 Gasson MJ, Benson K, Swindel S & Griffin H (1996)
(1985) Allosteric and kinetic properties of L-lactate dehydrogenase from Thermus caldophilus GK24, an extremely thermophilic bacterium. Agric Biol Chem 49, 359–365.
22 Williams RA & Andrews P (1986) Purification of the
Metabolic engineering of the Lactococcus lactis diacetyl pathway. Lait 76, 33–40.
fructose 1,6-bisphosphate-dependent lactate dehydroge- nase from Streptococcus uberis and an investigation of its existence in different forms. Biochem J 236, 721–727.
10 Neves AR, Ventura R, Mansour N, Shearman C, Gas- son MJ, Maycock C, Ramos A & Santos H (2002) Is the glycolytic flux in Lactococcus lactis primarily con- trolled by the redox charge? Kinetics of NAD+ and NADH pools determined in vivo by 13C NMR. J Biol Chem 277, 28088–28098.
11 Hols P, Ramos A, Hugenholtz J, Delcour J, de Vos
23 Iwata S, Kamata K, Yoshida S, Minowa T & Ohta T (1994) T and R states in the crystals of bacterial L-lac- tate dehydrogenase reveal the mechanism for allosteric control. Nat Struct Biol 1, 176–185.
WM, Santos H & Kleerebezem M (1999) Acetate utili- zation in Lactococcus lactis deficient in lactate dehydro- genase: a rescue pathway for maintaining redox balance. J Bacteriol 181, 5521–5526.
24 Arai K, Hishida A, Ishiyama M, Kamata T, Uchikoba H, Fushinobu S, Matsuzawa H & Taguchi H (2002) An absolute requirement of fructose 1,6-bisphosphate for the Lactobacillus casei L-lactate dehydrogenase activity induced by a single amino acid substitution. Protein Eng 15, 35–41.
25 Baptista AM, Martel PJ & Soares CM (1999) Simula- tion of electron–proton coupling with a Monte Carlo method: application to cytochrome c3 using continuum electrostatics. Biophys J 76, 2978–2998.
26 Andersen HW, Solem C, Hammer K & Jensen PR
12 Neves AR, Ramos A, Shearman C, Gasson MJ, Alme- ida JS & Santos H (2000) Metabolic characterization of Lactococcus lactis deficient in lactate dehydrogenase using in vivo 13C-NMR. Eur J Biochem 267, 3859–3868. 13 Bongers RS, Hoefnagel MH, Starrenburg MJ, Siemer- ink MA, Arends JG, Hugenholtz J & Kleerebezem M (2003) IS981-mediated adaptive evolution recovers lac- tate production by ldhB transcription activation in a lac- tate dehydrogenase-deficient strain of Lactococcus lactis. J Bacteriol 185, 4499–4507.
(2001) Twofold reduction of phosphofructokinase activ- ity in Lactococcus lactis results in strong decreases in growth rate and in glycolytic flux. J Bacteriol 183, 3458–3467.
27 Koebmann B, Solem C & Jensen PR (2005) Control analysis as a tool to understand the formation of the las operon in Lactococcus lactis. FEBS J 272, 2292– 2303.
14 Garrigues C, Loubiere P, Lindley ND & Cocaign-Bous- quet M (1997) Control of the shift from homolactic acid to mixed-acid fermentation in Lactococcus lactis: pre- dominant role of the NADH ⁄ NAD+ ratio. J Bacteriol 179, 5282–5287.
15 Neves AR, Ramos A, Costa H, van Swam II, Hugenholtz J, Kleerebezem M, de Vos WM & Santos H (2002) Effect
28 Ramos A, Neves AR, Ventura R, Maycock C, Lopez P & Santos H (2004) Effect of pyruvate kinase overpro-
FEBS Journal 274 (2007) 5924–5936 ª 2007 The Authors Journal compilation ª 2007 FEBS
5935
P. Gaspar et al.
Lactacte dehydrogenases of Lactococcus lactis
duction on glucose metabolism of Lactococcus lactis. Microbiology 150, 1103–1111.
41 Sali A & Blundell TL (1993) Comparative protein mod- elling by satisfaction of spatial restraints. J Mol Biol 234, 779–815.
42 Laskowski A, MacArthur M, Moss D & Thorton J (1993) PROCHECK: a program to check the stereo- chemical quality of protein structures. J Appl Cryst 26, 283–291.
29 Luesink EJ, van Herpen RE, Grossiord BP, Kuipers OP & de Vos WM (1998) Transcriptional activation of the glycolytic las operon and catabolite repression of the gal operon in Lactococcus lactis are mediated by the catabolite control protein CcpA. Mol Microbiol 30, 789–798.
30 Gasson MJ (1983) Plasmid complements of Streptococ- cus lactis NCDO 712 and other lactic streptococci after protoplast-induced curing. J Bacteriol 154, 1–9.
43 Baptista AM & Soares CM (2001) Some theoretical and computational aspects of the inclusion of proton isom- erism in the protonation equilibrium of proteins. J Phys Chem 105, 293–309.
31 Poolman B & Konings WN (1988) Relation of growth of Streptococcus lactis and Streptococcus cremoris to amino acid transport. J Bacteriol 170, 700–707.
44 Teixeira VH, Soares CM & Baptista AM (2002) Studies of the reduction and protonation behaviour of tetra- haem cytochromes using atomic detail. J Biol Inorg Chem 7, 200–216.
45 Bashford D (1997) An object-oriented programming
32 Fordyce AM, Moore CH & Pritchard GG (1982) Phos- phofructokinase from Streptococcus lactis. Methods Enzymol 90, 77–82.
suite for electrostatic effects in biological molecules. In Scientific Computing in Object-Oriented Parallel Environ- ments, Vol. 1343, ISCOPE97 (Ishikawa Y, Oldehoeft RR, Reynders JVW & Tholburn M, eds), pp. 233–240. Springer, Berlin.
33 Bradford MM (1976) A rapid and sensitive method for the quantitation of microgram quantities of protein uti- lizing the principle of protein-dye binding. Anal Biochem 72, 248–254.
46 Bashford D & Gerwert K (1992) Electrostatic calcula-
tions of the pKa values of ionizable groups in bacterio- rhodopsin. J Mol Biol 224, 473–486.
47 Scott WRP, Hu¨ nenberger PH, Tironi IG, Mark AE,
34 Neves AR, Ramos A, Nunes MC, Kleerebezem M, Hugenholtz J, de Vos WM, Almeida J & Santos H (1999) In vivo nuclear magnetic resonance studies of glycolytic kinetics in Lactococcus lactis. Biotechnol Bioeng 64, 200–212.
Billeter SR, Fennen J, Torda AE, Huber T, Kru¨ ger P & van Gunsteren WF (1999) The GROMOS biomolecular simulation program package. J Phys Chem 103, 3596– 3607.
35 Lewington J, Greenaway SD & Spillane BJ (1987) Rapid small scale preparation of bacterial genomic DNA, suitable for cloning and hybridization analysis. Lett Appl Microbiol 5, 51–53.
48 van Gunsteren WF, Billeter SR, Eising AA, Hunenber- ger PH, Kruger P, Mark AE, Scott WRP & Tironi IG (1996) Biomolecular Simulation: the GROMOS96 Manual and User Guide. BIOMOS b.v., Zurich, Switzerland.
36 Marti-Renom M, Stuart A, Fiser A, Sanchez R, Melo F & Sali A (2000) Comparative protein structure modeling of genes and genomes. Annu Rev Biophys Biomol Struct 29, 291–325.
49 Teixeira VH, Cunha CA, Machuqueiro M, Oliveira
37 Sa´ nchez R & Sali A (1997) Advances in comparative protein-structure modelling. Curr Opin Struct Biol 7, 206–214.
ASF, Victor BL, Soares CM & Baptista AM (2005) On the use of different dielectric constants for intrinsic and pairwise term in Poisson–Boltzmann studies of protein ionisation equilibrium. J Phys Chem B 109, 14691– 14706.
38 Wigley DB, Gamblin SJ, Turkenburg JP, Dodson EJ, Piontek K, Muirhead H & Holbrook JJ (1992) Struc- ture of a ternary complex of an allosteric lactate dehy- drogenase from Bacillus stearothermophilus at 2.5 A resolution. J Mol Biol 223, 317–335.
39 Uchikoba H, Fushinobu S, Wakagi T, Konno M, Tagu-
50 Kraulis PJ (1991) MOLSCRIPT: a program to produce both detailed and schematic plots of protein structures. J Appl Crystallogr 24, 946–950.
51 Nicholls A (1992) GRASP: Graphical Representation
and Analysis of Surface Properties. Columbia University, New York.
chi H & Matsuzawa H (2002) Crystal structure of non- allosteric L-lactate dehydrogenase from Lactobacillus pentosus at 2.3 A resolution: specific interactions at sub- unit interfaces. Proteins 46, 206–214.
40 Fiser A, Do RKG & Sali A (2000) Modeling of loops
52 Merritt EA & Bacon DJ (1997) Raster3D Photorealistic Molecular Graphics. Methods Enzymol 277, 505–524.
in protein structures. Prot Sci 9, 1753–1773.
FEBS Journal 274 (2007) 5924–5936 ª 2007 The Authors Journal compilation ª 2007 FEBS
5936