Nerve influence on myosin light chain phosphorylation in slow and fast skeletal muscles Cyril Bozzo1,2, Barbara Spolaore3, Luana Toniolo1, Laurence Stevens2, Bruno Bastide2, Caroline Cieniewski-Bernard2, Angelo Fontana3, Yvonne Mounier2 and Carlo Reggiani1
1 Department of Anatomy and Physiology, University of Padova, Italy 2 Laboratory of Neuromuscular Plasticity, UPRES EA 1032, IFR118, USTL, Villeneuve d’Ascq, France 3 CRIBI Biotechnology Centre, University of Padova, Italy
Keywords CLFS; cyclosporin; denervation; myosin, phosphorylation
Correspondence C. Reggiani, Department of Anatomy and Physiology, University of Padova, Via Marzolo 3, 35131 Padova, Italy Fax: +39 049827 5301 Tel: +39 049827 5513 E-mail: carlo.reggiani@unipd.it
(Received 23 May 2005, revised 2 August 2005, accepted 12 September 2005)
doi:10.1111/j.1742-4658.2005.04965.x
Neural stimulation controls the contractile properties of skeletal muscle fibres through transcriptional regulation of a number of proteins, including myosin isoforms. To study whether neural stimulation is also involved in the control of post-translational modifications of myosin, we analysed the phosphorylation of alkali myosin light chains (MLC1) and regulatory myo- sin light chains (MLC2) in rat slow (soleus) and fast (extensor digitorum longus EDL) muscles using 2D-gel electrophoresis and mass spectrometry. In control rats, soleus and EDL muscles differed in the proportion of the fast and slow isoforms of MLC1 and MLC2 that they contained, and also in the distribution of the variants with distinct isoelectric points identified on 2D gels. Denervation induced a slow-to-fast transition in myosin iso- forms and increased MLC2 phosphorylation in soleus, whereas the oppos- ite changes in myosin isoform expression and MLC2 phosphorylation were observed in EDL. Chronic low-frequency stimulation of EDL, with a pat- tern mimicking that of soleus, induced a fast-to-slow transition in myosin isoforms, accompanied by a decreased MLC2 phosphorylation. Chronic administration (10 mgÆkg)1Æd)1 intraperitoneally) of cyclosporin A, a known inhibitor of calcineurin, did not change significantly the distribution of fast and slow MLC2 isoforms or the phosphorylation of MLC2. All changes in MLC2 phosphorylation were paralleled by changes in MLC kinase expression without any variation of the phosphatase subunit, PP1. No variation in MLC1 phosphorylation was detectable after denervation or cyclosporin A administration. These results suggest that the low-fre- quency neural discharge, typical of soleus, determines low levels of MLC2 phosphorylation together with expression of slow myosin, and that MLC2 phosphorylation is regulated by controlling MLC kinase expression through calcineurin-independent pathways.
[3,4] and chronic low-frequency stimulation (CLFS) [5–8] experiments. In particular, after some weeks, den- ervation [3,9–11] and CLFS [5–8] cause changes in the myosin heavy chain (MHC) distribution in slow and fast muscles, which validates the view that the pattern
Myosin isoforms are major determinants of the con- tractile properties of skeletal muscle fibres [1], and the neural discharge pattern has an important role in the regulation of myosin isoform expression. This has been demonstrated by cross-innervation [2], denervation
Abbreviations BAP, brightness-area product; CAM, calmodulin; CaN, calcineurin; CLFS, chronic low-frequency stimulation; COCsA, controls for CsA receiving cremophor A solution only; CODE, controlateral unoperated limb; CONT, control; CsA, cyclosporin A; ECL, enhanced chemiluminescence; EDL, extensor digitorum longus; NFAT, nuclear factor of activated T cells; MS, mass spectrometry; IEF, isoelectric focusing; MHC, myosin heavy chain; MLC, myosin light chain.
FEBS Journal 272 (2005) 5771–5785 ª 2005 FEBS
5771
C. Bozzo et al.
Myosin phosphorylation and denervation
of neural discharge is the main determinant of nerve influence on myosin expression.
it has
contrasting variations of the degree of myosin phos- phorylation during short and long time intervals. In fact, during short-term regulation, repetitive or tetanic stimulation (duration: seconds or fractions of seconds) leads to a transient increased phosphorylation, whereas in long-term regulation, CLFS (duration: days or weeks) causes a reduced phosphorylation.
Whereas the transcriptional control of myosin iso- form expression in muscle plasticity is generally accep- still not been established whether ted [1], myofilament functions can be the target of long-term regulation based on post-translational protein modifi- cations. The recent observation that, during aging, cross-bridge kinetics in slow fibres change as a result of myosin nonenzymatic glycosylation [12,13], demon- strates that post-translational modifications can be relevant to regulate contractile properties over long time periods.
electrostimulation [26,27], are
Phosphorylation of the light chain subunits is the most studied post-translational modification of myosin. Phosphorylation of the regulatory myosin light chain (MLC) is catalysed by a calmodulin-dependent kinase (MLC kinase), which is activated by the increase in cytosolic calcium [14]. Thus, a repetitive or tetanic sti- mulation causes a transient increase of phosphorylation of regulatory MLC. Phosphorylation is then removed by a phosphatase composed of PP1 associated with MYPT2, a targeting subunit specific to skeletal muscle MLC [15–17]. Myosin phosphorylation enhances force development at submaximal calcium concentrations (i.e. induces a shift of the force–pCa curve towards lower calcium concentrations) [18,19] and, through this mech- anism, offers a plausible explanation for the phenom- enon of post-tetanic potentiation [20].
We designed this study to further investigate the relevance of neural stimulation on long-term changes in myosin phosphorylation using, as a model, the den- ervation of fast and slow muscles. Only a few studies have analysed MLC phosphorylation in skeletal muscle after denervation and, to our best knowledge, those studies were only focused on fast muscles, such as EDL [25,26] or gastrocnemius [27], perhaps because of the high level of phosphorylation in fast muscles [18,19]. In fast muscles, the basal level of phosphoryla- tion [25], and the transient increase in phosphorylation after reduced after 7 days [25,26] or 2 weeks [27], respectively, of denerva- tion. The decrease in phosphorylation in denervated fast muscles, where genes coding for fast myosins are down-regulated [9], supports the hypothesis of a strong link between fast isoform expression and high phos- phorylation level. Although slow muscle fibres are believed to be more dependent on nerve influence than fast fibres [28,29] no study has investigated the changes in phosphorylation after denervation in slow muscles. Following the above reasoning, an increase in myosin phosphorylation in the slow soleus muscle after dener- vation might be anticipated.
There is evidence in favour of the existence of a long- term regulation of MLC2 phosphorylation, besides the short-term regulation that is dependent on calcium released during contraction. Long-term regulation means that the phosphorylation levels at rest and dur- ing contraction change over periods of days or weeks, and this might be considered as a special case of skel- etal muscle differentiation and plasticity. In substantial agreement with early observations that the phosphory- lation level is higher in fast than in slow muscles [20], recent studies have shown that phosphorylation decrea- ses with CLFS, which induces a fast-to-slow transfor- mation [21–23]. An increase in myosin phosphorylation during adaptive responses, such as hindlimb unloading, which implies a slow-to-fast transformation, has been demonstrated in a recent study [24]. A decrease in the MLC phosphorylation after 7 days of denervation in the fast extensor digitorum longus (EDL) has also been described [25]. Taken together, these findings suggest that slow-to-fast transformations are associated with increased phosphorylation and that fast-to-slow trans- formations are associated with reduced phosphoryla- tion. The finding that MLC2 phosphorylation decreases with CLFS suggests that contractile activity may cause
Therefore, the first aim of this study was to assess whether denervation modifies the level of MLC2 phos- phorylation in soleus and in EDL, used as representative slow and fast muscles, respectively (i.e. two muscles where specific patterns of neural stimulation determine and maintain opposite structural and functional charac- teristics). The second aim of this study was to under- stand the molecular mechanisms that determine the changes in phosphorylation level. To achieve this, we tested the hypothesis that changes in phosphorylation were caused by variations in the amount of MLC kinase and phosphatase. The available evidence points to a role of the calcineurin–nuclear activated factor of T-cells (NFAT) pathway in mediating the effect of the low-fre- quency pattern of neural discharge on the transcription of genes typical of a slow muscle phenotype, such as slow myosin subunits [30–32]. In the frame of this model we explored whether the inhibition of calcineurin with cyclosporin A (CsA) could mimic the effects of denerva- tion on myosin phosphorylation as it does with myosin isoform expression [33]. To further confirm that low- frequency neural discharge, typical of slow muscles, can
FEBS Journal 272 (2005) 5771–5785 ª 2005 FEBS
5772
C. Bozzo et al.
Myosin phosphorylation and denervation
reduce myosin phosphorylation in fast muscle, we exam- ined the effects of CLFS on the fast EDL. Finally, taking into account the recent evidence of MLC1 phos- phorylation in cardiac muscle [34], we extended our investigation, based on 2D-gel electrophoresis and mass spectrometry, to MLC1 isoforms.
and five control rats of similar age and body mass (see the Experimental procedures). As seen in Table 1, two weeks after sciatectomy, denervated soleus and EDL (DE) showed atrophy (i.e. decrease of mass) when compared with the corresponding muscles of the control animals (CONT) or with the muscles of the controlateral unoperated limb (CODE).
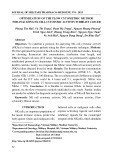
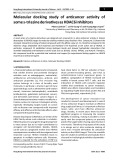
The distribution of MHC and MLC isoforms in the soleus and EDL of control and treated rats were analysed by SDS ⁄ PAGE. Four bands, correspond- ing to MHCI (slow isoforms) and to MHCIIa, MHCIId ⁄ x and MHCIIb (fast isoform), were separ- ated on 8% gels (Fig. 1). The results of densitometry are reported in Table 1. As can be seen for both soleus and EDL muscles, no difference in MHC iso- form distribution was present between control, leg of untreated rats (CONT) and the contro-lateral denervated rats (CODE). Soleus showed a predomin- ant MHCI band and a minor MHCIIa band, whereas in EDL, the bands corresponding to MHCIId ⁄ x and MHCIIb were predominant, in accordance with previ- ous observations [35].
The results obtained after denervation and CLFS confirmed the hypothesis of a close connection between fast myosin expression and high phosphoryla- tion level of MLC2, both in soleus and in EDL. The expression of MLC kinase was found to vary in direct association with the degree of phosphorylation, provi- ding a possible explanation of the regulatory mechan- ism. Treatment with CsA was sufficient to modify myosin isoform expression, but did not change MLC2 phosphorylation or MLC kinase expression, suggesting that the regulatory mechanism was not calcineurin- dependent. In addition, although 2D gels gave evi- dence in favour of MLC1 phosphorylation in skeletal muscles, no variation in its degree of phosphorylation was found in slow and fast muscles after denervation or CsA administration.
Results
Effects of denervation on rat soleus and EDL
The effects of denervation were studied by comparing five rats with surgical interruption of the sciatic nerve
In soleus, 14 days after denervation, a significant change in MHC isoform distribution was detectable (Fig. 1 and Table 1). The slow MHC isoform was less abundant in DE than in CONT and CODE, and this was accompanied by expression of the fast MHCIId ⁄ x isoform. In EDL, denervation was followed by an increase in MHCIIa expression, with corresponding
Table 1. Body mass (BM), muscle mass (MM), muscle mass ⁄ body mass ratio (MM ⁄ BM), and distribution of slow and fast myosin heavy chain (MHC) and myosin light chain (MLC) isoforms determined by SDS ⁄ PAGE and densitometry in the soleus and EDL muscles of control untreated rats (CONT, n ¼ 5, n ¼ 10 for muscles and myosin subunits), the controlateral leg of denervated rats (CODE, n ¼ 5), and in dener- vated rats (DE, n ¼ 5). Each MHC isoform is expressed as a percentage of the total amount of MHC isoforms. Each alkali (MLC1 and ⁄ or MLC3) or regulatory (MLC2) isoform is expressed as a percentage of the total amount of alkali or regulatory MLC, respectively. Data are expressed as mean value ± SD.
Soleus
EDL
CODE
DE
CODE
DE
CONT
CONT
307 ± 4
307 ± 4 123 ± 15 0.40 ± 0.04
303 ± 13 151 ± 21 0.50 ± 0.05
82 ± 5* 0.27 ± 0.01*
303 ± 13 144 ± 23 0.47 ± 0.07
146 ± 11 0.48 ± 0.02
82 ± 10* 0.27 ± 0.02*
Body mass (BM, g) Muscle mass (MM, mg) MM ⁄ BM MHC
75.55 ± 3.29* 19.90 ± 3.00
3.17 ± 2.79 7.78 ± 1.01*
84.67 ± 3.01 15.33 ± 3.01 – –
84.54 ± 3.83 15.46 ± 3.83 – –
4.56 ± 0.80* –
4.84 ± 4.70 1.20 ± 2.39 38.25 ± 5.42 55.71 ± 5.30
2.22 ± 3.01 2.00 ± 0.39 38.94 ± 4.34 56.84 ± 5.78
35.66 ± 3.01 53.38 ± 3.11
MHCI MHCIIa MHCIId ⁄ x MHCIIb
Alkali light chains
89.25 ± 2.86 10.75 ± 2.86
91.20 ± 7.97 8.80 ± 7.97
74.48 ± 2.53* 25.52 ± 2.53*
8.79 ± 6.97 91.21 ± 6.97
5.57 ± 6.47 94.4 ± 6.47
5.40 ± 6.33 94.6 ± 6.33
MLC1slow MLC1fast + MLC3 Regulatory light chains
87.65 ± 2.96 12.35 ± 2.96
88.57 ± 6.64 11.43 ± 6.64
72.39 ± 2.76* 27.61 ± 2.76*
11.30 ± 4.97 88.70 ± 4.97
8.30 ± 6.50 91.70 ± 6.50
8.3 ± 8.02 91.7 ± 8.02
MLC2slow MLC2fast
*Significantly different (P < 0.05) from CONT.
FEBS Journal 272 (2005) 5771–5785 ª 2005 FEBS
5773
C. Bozzo et al.
Myosin phosphorylation and denervation
Fig. 1. Myosin heavy chain (MHC) and myosin light chain (MLC) expression in soleus (left side of the figure) and EDL (right side of the figure) muscles in control, untreated rats (CONT), in the contro- lateral leg (CODE) and in the denervated leg (DE) of rats with surgi- cal section of sciatic nerve, in rats receiving cremophor A solution only (COCsA) and in rats receiving cyclosporin A diluted in cremo- phor A solution (CsA). Separation of MHC isoforms was obtained with SDS ⁄ PAGE in 8% gels, whereas separation of actin and MLC isoforms was obtained with SDS ⁄ PAGE in 12% gels. Gels were silver stained.
these latter
decreases in MHCIId ⁄ x and MHCIIb, being below statistical significance.
fast
isoforms were predominant
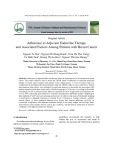
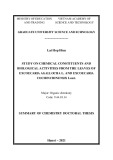
Fig. 2. Myosin light chain (MLC) region in silver-stained 2D gels from soleus (left column) and EDL (right column) muscles of con- trol rats (CONT), controlateral leg (CODE) and denervated leg (DE) of denervated rats, in rats receiving daily cremophor injections (COCsA) and in rats receiving daily injections of cyclosporin A (CsA). The pH gradient extends from basic on the left to acidic on the right. The isoelectric point and Mr values are labelled on the uppermost panels. Two variants (1s and 1s1) of MLC1slow, two variants (1f and 1f1) of MLC1fast, three variants (2s, 2s1, 2s2) of MLC2 slow, and two variants (2f and 2f1) of MLC2 fast were sep- arated on 2D gels. Note the different pattern of MLC1 and MLC2 spots in control soleus and EDL muscles. The changes in pattern of MLC2 variants in DE muscles are detectable both in soleus (from a three-spot pattern to a five-spot pattern) and in EDL (decrease in the acidic variants). 2s2 and 2f1 spots in denervated soleus are encircled. An arrow indicates the position of 2s2 in den- ervated EDL.
As seen in Fig. 1, five bands corresponding to MLC isoforms were identified on 12% gels and densito- metrically quantified: three alkali MLC isoforms (MLC1slow, MLC1fast and MLC3) and two regulatory MLC isoforms (MLC2slow and MLC2fast). As expec- in EDL, ted [35], whereas slow isoforms were predominant in soleus. As described above for MHC isoforms, no difference in MLC distribution was present between CONT and CODE. In soleus, denervation caused a change in the distribution of both alkali and regulatory MLC iso- forms, with a decrease in slow isoforms and an increase in fast isoforms. No significant changes were observed in denervated EDL (Table 1).
Separation of MLCs by 2D-gel electrophoresis
MLCs were analysed by 2D-gel electrophoresis to detect possible variants of the five isoforms separated by 1D gels (Fig. 1): MLC1slow, MLC1fast, MLC2slow, MLC2fast and MLC3. In 2D gels (Fig. 2), MLC1slow
was divided by isoelectric focusing (IEF) into two spots, named 1s and 1s1 (1s1 being more acidic than 1s), and MLC1fast was similarly divided into 1f and 1f1. MLC2slow was separated into three spots, indicated as 2s, 2s1 and 2s2, in order from basic to acidic isoelectric point, whereas MLC2fast was divided into two spots, namely 2f and 2f1, 2f1 being a more acidic variant.
FEBS Journal 272 (2005) 5771–5785 ª 2005 FEBS
5774
C. Bozzo et al.
Myosin phosphorylation and denervation
(2s2) appeared in MLC2slow, and a second, acidic spot (2f1) appeared in MLC2fast (Fig. 2 where 2s2 and 2f1 are circled, and Table 3).
MLC3 appeared as a single spot (not shown in Fig. 2). The spots corresponding to MLC isoforms and their variants were identified and classified, as previously des- cribed [24], on the basis of their molecular weight (sec- ond dimension), isoelectric point (first dimension) and immunoblotting. The reactivity with the antibody FL-172sc15370, specific for MLC2, showed that the spots 2s, 2s1, 2s2, 2f and 2f1 were variants of either MLC2slow or MLC2fast [24], whereas the reactivity with the antibody PSR-45, specific to P-serine, showed that the spots 1s1, 1f1, 2s1, 2s2 and 2f1 contained phos- phorylated serine residues. No spots were reactive to the antibody PTR-8, specific to P-threonine. Finally, the identity of the spots was confirmed with good scores by mass spectrometry, as shown in Table 2.
In control EDL, MLC2fast was predominant (see also Table 1) and was divided by IEF into two vari- ants (2f and 2f1), the less acidic variant being more abundant (Table 3). MLC2slow was also present and composed of two spots. Importantly, careful analysis of the relative positions of the spots in 2D gels of con- trol EDL compared with control soleus showed that the two variants of MLC2slow present in EDL corres- ponded to 2s1 and 2s2, whereas the less acidic variant, 2s, was not detectable. Denervation of EDL modified the relative proportion of the variants of MLC2slow, as the more acidic spot (2s2) significantly decreased (Fig. 2, arrow, and Table 3).
The proportions of
The relative proportions of the spots corresponding to MLC isoforms and their variants were densito- metrically quantified, as described in the Experi- mental procedures, and the results are shown in Table 3. In control soleus (CONT, CODE), the pre- dominant isoform, MLC2slow (Table 1), was composed of two spots, the less acidic (2s) being more abundant than the more acidic (2s1). MLC2fast was also present and appeared to be composed of only one spot (2f). Denervation of soleus caused not only a shift from MLC2slow to MLC2fast, as described above (Table 1), but also a significant increase of the more acidic forms for both slow and fast MLC2. A third, more acidic, spot
the spots corresponding to MLC1slow and MLC1fast were determined in soleus and EDL of control and treated animals (Fig. 2 and Table 3). Interestingly, only the predominant isoform appeared divided into two spots, both in soleus (1s and 1s1), where MLC1slow was more abundant, and in EDL (1f and 1f1), where MLC1fast was predomin- ant. The less abundant isoform appeared as a single spot, both in soleus (1f) and in EDL (1s). The ratio between the more acidic spot and the less acidic spot was (cid:1)1 : 4 in both MLC1 isoforms and did not change after denervation.
Table 2. Identification of rat muscle proteins by mass spectrometry and database searching. Proteins were identified by ESI MS ⁄ MS and ⁄ or MALDI-TOF. MLC, myosin light chain; PMF, peptide mass fingerprint; ESI-quadrupole-TOF analysis (MS ⁄ MS). Theor. pI, theoretical isoelec- tric point.
b
Spots (Fig. 2) Protein name
Swiss-Prot accession code
Matched peptides by PMF
Sequence coverage
Peptides sequenced by MS ⁄ MSa
Theor. pI; Mr
Actin MLC1s MLC1f MLC1s1 MLC1f1 MLC2s
P02568 P16409 P02600 P16409 P02600 P08733
15 9 5 9 5 9
2 2 2 1 2 2
46% 50% 30% 50% 30% 43%
5.3 ⁄ 42.4 5.0 ⁄ 22.1 5.0 ⁄ 20.6 5.0 ⁄ 22.1 5.0 ⁄ 20.6 4.9 ⁄ 18.7
Actin, skeletal muscle MLC1s b, ventricular isoform MLC1f, skeletal muscle isoform MLC1s1 b, ventricular isoform MLC1f, skeletal muscle isoform MLC2 (MLC2v), myosin regulatory light chain 2, ventricular ⁄ cardiac muscle isoform
MLC2f
MLC2, myosin regulatory light chain 2,
P04466
5
3
32%
4.8 ⁄ 18.9
skeletal muscle isoform
MLC2s1
P08733
5
—
26%
4.9 ⁄ 18.7
MLC2 (MLC2v), myosin regulatory light chain 2, ventricular ⁄ cardiac muscle isoform
MLC2f1 MLC 2s2
P04466 P08733
10 (12)b 7
— 1
54% 50%
4.8 ⁄ 18.9 4.9 ⁄ 18.7
Myosin regulatory light chain 2 MLC2 MLC2 (MLC-2v), myosin regulatory light chain 2, ventricular ⁄ cardiac muscle isoform
a Calculated for the corresponding Swiss-Prot entry. b Identified on the basis of mass determination with a score of 1.105 · 10)6 on the Swiss-Prot database.
FEBS Journal 272 (2005) 5771–5785 ª 2005 FEBS
5775
C. Bozzo et al.
Myosin phosphorylation and denervation
l
s t a r
e h T 1 1 . 4 6 2 . 7 9 4 . 3 1 1 . 4 6 2 . 7 9 4 . 3
Effects of CsA treatment
’ 1 s 2 ‘
±
±
±
±
±
±
) 4 ¼ n (
, ’ s 2 ‘
i
o r t n o c
A s C
–
–
s a
. s m r o f o s
i
A s C
i
d e t a e r t 4 2 . 0 2 0 0 . 6 2 5 2 . 8 2 6 7 . 9 7 0 0 1 0 0 . 4 7 5 7 . 1 7
l
)
i
: s s e r o h p o r t c e e
) 4 ¼ n (
l
) t s a f
±
±
±
±
±
±
r o (
A s C O C
(
1 C L M d n a d e t a c d n 5 7 . 3 7 7 . 7 1 1 . 3 5 7 . 3 7 7 . 7 1 1 . 3
l
A s C O C
–
–
l
w o s
l
e g - D 2 e r a w o s 4 4 . 1 2 7 1 . 2 3 5 6 . 5 2 6 5 . 8 7 0 0 1 5 3 . 4 7 3 8 . 7 6 h t i
a t o t
t n e m t a e r t
f o
)
f o
±
±
±
±
±
±
A s C
w d e t a r a p e s
) 4 ¼ n (
(
A
s t n a i r a v
E D
2 C L M 1 9 . 4 * 6 6 . 3 2 6 . 3 1 9 . 4 2 6 . 3 * 6 6 . 3
–
–
l
a
l
s a
. ’ 1 f 1 ‘
4 8 . 9 1 7 2 . 2 2 8 2 . 5 2 6 1 . 0 8 0 0 1 2 7 . 4 7 3 7 . 7 7 e h T e g a t n e c r e p
, s e c s u m L D E
) 4 ¼ n (
±
±
±
±
±
±
4 3 . 3 9 8 . 3 5 9 . 4 4 3 . 3 5 9 . 4 9 8 . 3 n i r o p s o c y c
To study whether CsA administration could reproduce the effects of denervation on the expression and phos- phorylation of myosin subunits, a group of five rats was treated for 2 weeks with CsA, as described in the Experimental procedures. As shown in Table 4, at the end of two weeks of treatment, body mass was signifi- cantly lower in rats that received CsA than in rats receiving vehicle alone (COCsA). As initial body mass did not differ among the groups of animals, the differ- ence observed at the end of the treatment pointed to a significant impairment in body mass growth ((cid:1)10%) caused by CsA. After CsA treatment, EDL mass was significantly decreased ()32%), whereas soleus mass was similar to that of the control (Table 4). The higher atrophy induced by CsA in fast compared with slow muscles has been reported in previous studies [28].
r o f
l
’ f 1 ‘
E D O C
–
–
l
s a
s
s u e o s
i
.
s o r t n o c
i
D S
s a
i
±
) 4 ¼ n (
±
±
±
±
±
±
i
l
) t s a f
s e u a v
–
–
s t a r
r o (
t s a f
, )
l
E D
w o s
(
d n a d n a 3 2 . 0 2 9 0 . 0 3 3 8 . 3 2 7 7 . 9 7 7 1 . 6 7 0 0 1 1 9 . 9 6 d e s s e r p x e n 6 7 . 0 8 5 . 1 7 7 . 0 6 7 . 0 7 7 . 0 8 5 . 1 1 C L M d e t a c d n d e v r e s e r a 2 C L M d n a T N O C L D E 7 5 . 8 1 6 1 . 3 3 5 6 . 5 2 3 4 . 1 8 5 2 . 4 7 0 0 1 4 8 . 6 6
i
f o
±
±
±
±
s t a r
) 4 ¼ n (
f o
t h g
t n a i r a v
A s C
–
–
–
n a e m s a 0 4 . 4 8 4 . 2 0 4 . 4 8 4 . 2 1 C L M 1 C L M n a h c
i l
0 0 1 0 0 1 7 2 . 7 7 4 0 . 0 8 3 7 . 2 2 6 9 . 9 1 d e s s e r p x e
MHC expression was modified by CsA treatment in both soleus and EDL (Fig. 1 and Table 4). In soleus, CsA induced a reduction of MHCI, associated with a surprising increase in MHCIIb expression. In EDL, CsA caused a significant increase of MHCIIa and MHCIId ⁄ x expression, accompanied by a significant decrease in the expression of MHCIIb. Interestingly, CsA administration did not cause any change in the distribution of MLC isoforms in the two muscles ana- lysed. Furthermore, no changes in the distribution of the variants separated with 2D-electrophoresis were detected (Fig. 2 and Table 3).
i
s t n a i r a v
a t a D
e r a h c a E d e t a v r e n e d e h t n s o y m d n a
MLC kinase and PP1 expression
f o
) 4 ¼ n (
. ’ 1 f 2 ‘
, )
±
±
±
±
9 1 . 8 6 5 . 4 9 1 . 8 6 5 . 4
s a e r e h w
. 2 C L M
E D O C
A s C O C
–
–
–
(
’ f 2 ‘
s m r o f o s
i
. p u o r g
t s a f
s a
l
, ’ 1 s 1 ‘
s t a r
t s a f
d n a 0 0 1 0 0 1 3 2 . 6 7 3 1 . 1 8 7 7 . 3 2 7 8 . 8 1
i
±
±
±
±
±
±
±
’ s 1 ‘
i
) 4 ¼ n (
l
s a
E D
–
l
f o
f o
t s a f
i
f o
l
l
i
s t n a i r a v
) 4 ¼ n (
l
m o r f
±
±
±
±
s t n a i r a v
f o
l
f o
) 5 0 . 0
a r e t a o r t n o c
E D O C
–
–
–
<
r o f
s t n a i r a v
P
(
f o
i
s
i
) 4 ¼ n (
, ) T N O C
±
±
±
±
(
i
t n e r e f f i d
l
l
s t n a i r a v
s a e r e h w
s t a r
d n a d n a o r t n o c * 6 0 . 8 * 3 9 . 2 * 6 0 . 8 1 4 . 6 5 9 . 1 4 3 . 4 5 9 . 1 d e t a c d n d n a w o s d e t a v r e n e d e r a 5 1 . 6 5 1 . 0 2 5 8 . 9 7 0 0 1 9 0 . 6 6 9 8 . 9 7 6 7 . 7 2 1 1 . 0 2 2 C L M w o s e v i t c e p s e r g e d e t a c d n e h t 6 1 . 3 2 3 . 3 6 1 . 3 2 3 . 3 2 C L M e h t e r a w o s e h t 0 0 1 0 0 1 1 0 . 4 7 8 6 . 8 7 9 9 . 5 2 2 3 . 1 2 e h t 1 C L M e h t d e s u n o i t u b i r t s d 9 3 . 7 1 4 . 1 9 3 . 7 1 4 . 1
s u e o S
–
–
–
. 3
i
. )
, ’ 2 s 2 ‘
s
s
i
e v i t a e R T N O C 9 0 . 4 7 3 6 . 9 7 0 0 1 0 0 1 1 9 . 5 2 7 3 . 0 2 e h T n o s s e r p x e
f 1
f 2
A s C
(
y l t n a c fi n g S *
1 1 s 1 1 f 1 2 1 s 2 2 s 2 1 f 2 d n a e l b a T d e t a e r t n u e m a s 1 C L M 2 C L M
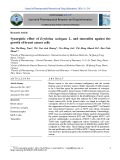
The expression of the skeletal MLC kinase and the phosphatase subunit, PP1, were determined by SDS ⁄ PAGE, western blot and densitometry, using actin band as a reference signal. The results are shown in Fig. 3. In soleus, denervation significantly increased MLC kinase expression by (cid:1) 2.5-fold, but did not influ- ence PP1 expression, which remained similar to the values obtained in CONT and in CODE. CsA adminis- tration did not affect either MLC kinase or PP1 expres- sion. In control EDL (CONT, CODE and COCsA), the level of MLC kinase expression was 1.5-fold higher than in control soleus, but lower than the MLC kin- ase level reached in denervated soleus. Denervation reduced MLC kinase expression in EDL by 30%, so that the MLC kinase level in denervated EDL was sim- ilar to that measured in control soleus. The addition of CsA did not change the expression of MLC kinase. The level of PP1 expression was similar in soleus and EDL, and no variation in PP1 expression was observed after EDL denervation and CsA treatment.
FEBS Journal 272 (2005) 5771–5785 ª 2005 FEBS
5776
C. Bozzo et al.
Myosin phosphorylation and denervation
Table 4. Body mass (BM), muscle mass (MM), muscle mass ⁄ body mass ratio (MM ⁄ BM), and distribution of slow and fast myosin heavy chain (MHC) and myosin light chain (MLC) isoforms determined by SDS ⁄ PAGE and densitometry in soleus and EDL muscles of rats treated with cyclosporin A (CsA, n ¼ 5) and rats serving as controls for cyclosporin A treatment (COCsA, n ¼ 5). Each MHC isoform is expressed as a percentage of the total amount of MHC isoforms. Each alkali (MLC1 and ⁄ or MLC3) or regulatory (MLC2) isoform is expressed as a per- centage of the total amount of alkali or regulatory MLC, respectively. Data are expressed as mean values ± SD.
Soleus
EDL
COCsA
CsA
COCsA
CsA
309 ± 2 127 ± 14 0.41 ± 0.05
277 ± 22* 119 ± 24 0.43 ± 0.08
309 ± 2 146 ± 26 0.47 ± 0.09
277 ± 22* 98 ± 5* 0.43 ± 0.08
85.11 ± 6.18 14.89 ± 6.18 – –
75.08 ± 5.25* 20.24 ± 4.81 – 4.68 ± 1.01*
1.71 ± 3.41 3.01 ± 1.39 39.29 ± 2.11 55.99 ± 3.04
2.69 ± 2.78 9.71 ± 2.02* 45.75 ± 2.31* 41.85 ± 2.87*
Body mass (BM, g) Muscle mass (MM, mg) MM ⁄ BM MHC MHCI MHCIIa MHCIId ⁄ x MHCIIb
Alkali light chains
90.85 ± 5.80 9.15 ± 5.80
89.06 ± 5.11 10.94 ± 5.11
6.81 ± 5.25 93.19 ± 5.25
7.16 ± 6.18 92.84 ± 6.18
MLC1slow MLC1fast + MLC3 Regulatory light chains
86.35 ± 5.40 13.65 ± 5.40
83.49 ± 9.95 16.51 ± 9.95
9.16 ± 7.73 90.84 ± 7.73
8.08 ± 4.14 91.92 ± 4.14
MLC2slow MLC2fast
*Significantly different (P < 0.05) from COCsA.
A
B
Fig. 3. Myosin light chain kinase (MLC kinase) and phosphatase regulatory subunit (PP1) in soleus and EDL muscles of control untreated rats (CONT), controlateral leg (CODE) and denervated leg (DE) of rats with surgical section of the sciatic nerve, rats receiving a daily injection of cremophor A solution (COCsA) and rats receiving cyclosporin A diluted in cremophor A solution (CsA). (A) Representative immunoblots after electrophoresis on 12% SDS ⁄ PAGE gels. (B) Mean values and SDs of the ratios of MLC kinase and PP1 signals to actin signal. n ¼ 5. *Significantly different (P < 0.05) from CONT.
Effects of CLFS on MLC2 phosphorylation and MLC kinase and PP1 expression in EDL
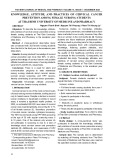
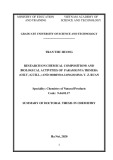
(data not shown) (29,36). 2D-electrophoresis (Fig. 4A) showed that CLFS caused pronounced changes in the distribution of the variants of both MLC2slow and MLC2fast. Whereas four MLC2 variants were detect- able in CONT EDL (left panel of Fig. 4A, see also Fig. 2) (i.e. the slow 2s1 and 2s2 and the fast 2f and
CLFS of EDL for three weeks induced a fast-to-slow transition in MHC isoforms, with a decrease in MHCIId ⁄ x and MHCIIb and an increase in MHCIIa
FEBS Journal 272 (2005) 5771–5785 ª 2005 FEBS
5777
C. Bozzo et al.
Myosin phosphorylation and denervation
A
B
Fig. 4. Effects of chronic low frequency stimulation (CLFS) on myosin light chain MLC2 phosphorylation in EDL muscle. (A) Separation of the MLC2 variants in silver-stained 2D gels in CONT EDL, in EDL after CLFS and in CONT soleus. Three variants (2s, 2s1, and 2s2) of MLC2 slow, and two variants (2f and 2f1) of MLC2 fast, were separated on 2D gels; also see Fig. 2. The pH gradient extends from basic on the left to acidic on the right. Mr and isoelectric point labels are placed on the upper and left edge of the MLC region. (B) Immunoblotting for the detection of MLC kinase, PP1 and actin expression (left), and ratios of MLC kinase and PP1 signals to actin signal (right) from CONT EDL, CLFS EDL and CONT soleus. *Significant difference (P < 0.05) between CONT EDL and CLFS EDL.
forms. No
attempt was made
f1), only two major spots were detected after CLFS: the slow 2s and the fast 2f (middle panel of Fig. 4A). This pattern resembled that present in CONT soleus (right panel of Fig. 4A, see also Fig. 2). Interestingly, the variant 2s, typical of soleus, appeared in CLFS EDL, and the acidic variants 2s1 and 2s2 disappeared. Among the variants of MLC2 fast, only 2f was present in CLFS EDL. The expression of MLC kinase in CLFS EDL was reduced to approximately two-thirds of the level measured in CONT EDL, becoming sim- ilar to the level measured in CONT soleus (Fig. 4B). No change in PP1 expression was observed.
Discussion
the three spot pattern present
The major goal of this study was to examine the nerve influence on MLC phosphorylation in slow and fast muscles. In both cases we found that, in addition to the known effects on myosin isoform expression, den- ervation was able to modify the degree of MLC2 phos- phorylation. Whereas in EDL, denervation caused a shift towards less acidic variants of MLC2, in soleus, denervation caused a shift towards more acidic vari- ants of MLC2. No variations in the distribution of MLC1 variants were detected.
2D-gel electrophoresis with IEF based on strips with immobilized pH gradients was used to separate
the phosphorylated and unphosphorylated forms. A detailed analysis using mass spectrometry was per- formed to reinforce the identification of the individ- ual spots based on isoelectric point (first dimension), molecular mass (second dimension) and immunostain- ing. The spots corresponding to actin and the vari- ants of MLC isoforms, were identified. The reactivity immunoglobulin provided evi- with anti-(P-serine) dence to identify the more acidic variants as phos- phorylated to determine which residues undergo phosphorylation, as the focus of the study was the long-term changes in the ratios between more acidic and less acidic vari- ants. Both the slow and the fast isoforms of alkali MLC (MLC1slow and MLC1fast) were present in two discrete variants (1s and 1s1 and, respectively, 1f and 1f1) with slightly different isoelectric points and similar molecular weights. Interestingly, both in so- leus and in EDL, only the more abundant MLC1 isoform appeared divided in two spots and therefore the three spot pattern detectable in soleus was the mirror image of in EDL (Fig. 2). Three variants of MLC2 slow (2s, 2s1, 2s2) were separated on 2D gels. The identification had been achieved in our previous study by immuno- blotting with antibody specific to MLC2 [24] and was study, by MS. The two more confirmed,
in this
FEBS Journal 272 (2005) 5771–5785 ª 2005 FEBS
5778
C. Bozzo et al.
Myosin phosphorylation and denervation
the three spots
remains controversial
in denervated soleus,
acidic spots (2s1 and 2s2) were stained by anti-(P-ser- ine) immunoglobulin. The comparison between soleus and EDL of control animals revealed a new and unexpected difference as the two less acidic spots (2s in soleus, whereas the two and 2s1) were present more acidic spots (2s1 and 2s2) were present in EDL (Figs 2 and 4). After denervation, 2s2 became detect- able in soleus and became smaller in EDL. The ori- [24], gin of regarding whether they represent unphosphorylated (2s), monophosphorylated (2s1) or di-phosphorylated (2s2) variants, as observed in smooth muscle [37], or two distinct post-translational the combination of modifications. In favour of the second explanation is the complete removal of 2s2 and the incomplete removal of 2s1 by phosphatase [24], and the recent observation of a de-amidation site [38] in MLC2slow, which gives origin to a more acidic form. Finally, two distinct variants (2f and 2f1) of the fast MLC2 isoform were separated by IEF and their identifica- tion confirmed by MS. The more acidic spot (2f1) was reactive with anti-(P-serine) immunoglobulin.
The changes of the phosphorylation level after den- ervation are examples of long-term post-translational modification, clearly different from the increase in phosphorylation that occurs after repetitive stimulation and which is responsible for post-tetanic potentiation [20]. It has been known for many years that the phos- phorylation level is higher in fast than in slow muscles [20]. A decrease in phosphorylation level has been pre- viously described in muscles that are subjected to CLFS [21–23], a condition which is known to induce a fast-to-slow transformation. Our previous work [24] has shown that slow-to-fast transformation, induced by either disuse (hindlimb unloading) or clenbuterol administration, is associated with an increased phos- phorylation level. Denervation is known to affect myosin isoforms, the transcriptional changes being detectable at the mRNA level after a few days and at the protein level within a few weeks [3,9,10]. The chan- ges in myosin subunit expression observed in this study were in complete agreement with previous observa- tions, as, slow myosin was expressed to a lower extent (both MHCI and slow MLC) than fast myosin (MHCIId ⁄ x and fast MLC), which increased. In denervated EDL, only an increase in the expression of MHCIIa, indicative of a moderate transition towards a slow phenotype, was observed. In accordance with previous observations on long-term changes in myosin phosphorylation, the slow-to-fast transition in soleus was associated with an increased level of phosphorylation, and the fast-to-slow (or fast-to-less fast) transition in EDL with a decrease in phosphorylation level. CLFS experiments
confirmed the
link between fast-to-slow transformation and a decrease in the phos- phorylation level, by showing that in a fast muscle the stimulation, according to a pattern typical of a slow muscle, induced, at the same time, changes in myosin isoform expression and decreased myosin phosphoryla- tion. This latter was related to a decreased expression of MLC kinase. Taken together, the changes following denervation of soleus, and the changes following CLFS of EDL, demonstrate that the stimulation pattern is essential for the long-term regulation of myosin phos- phorylation. Interestingly, the spot 2s, which is the most abundant in soleus, also appears in EDL after CLFS.
If the more acidic variants, reactive with anti-(P- serine) immunoglobulin, can be considered as phosphor- ylated forms of MLC2 slow or MLC2 fast, the extent of MLC2 phosphorylation in the soleus and EDL of con- trol animals found in this study was generally higher than the values for resting muscles reported in other studies. The difference might be a result of the proce- dure used for muscle sampling or the methods employed for separation of the phosphorylated variants. In fact, the values found in this study are very similar to those reported by Gonzalez and coworkers [23], who used a sampling protocol and a separation based on 2D-elec- trophoresis that were very similar to those used in the present study. 2D-electrophoresis has often been used to separate phosphorylated variants in cardiac and smooth muscles [39] but seldom in skeletal muscle [23]. IEF after electrophoresis in pyrophosphate gels [20] and urea-gly- cerol-acrylamide gel electrophoresis [26] have been more often used in skeletal muscle. In many studies, muscles have been allowed to rest for a given time interval, either in vivo or in vitro, before freezing. In this study, deep anaesthesia was expected to induce prolonged muscle relaxation and give time sufficient to reach low and steady levels of phosphorylation. We believe that the most important condition for reliable comparison is to follow carefully the protocols chosen for muscle sampling and phosphorylated myosin determination. In our view, the high reproducibility of the data and the similarity with the data obtained with comparable pro- tocols [23] supports the reliability of our determination of the basal level of myosin phosphorylation.
The results obtained provide clear evidence that the long-term changes in phosphorylation level are caused by changes in MLC kinase, without signifi- cant variations of the phosphatase, or at least of the subunit, PP1. Western blot analysis phosphatase showed that upon denervation, MLC kinase increases in soleus and decreases in EDL. Preliminary results
FEBS Journal 272 (2005) 5771–5785 ª 2005 FEBS
5779
C. Bozzo et al.
Myosin phosphorylation and denervation
than in slow muscles [43], and (c) recent studies on the promoter region of MHCI [44] cast some doubts as to whether transcriptional CsA effects are only mediated by interruption of the CaN–NFAT path- way.
obtained in our laboratory with quantitative PCR confirm that both denervation and hindlimb unload- ing cause an increase in the mRNA of MLC kinase (data not shown). In agreement with these observa- the tions, a moderate increase in transcription of MLC kinase gene is reported in the supplementary data of a microarray study of the transcriptional changes occurring in soleus during hindlimb unload- ing [40].
by
caused
changes
In this study, not only MLC2 phosphorylation, but also MLC1 phosphorylation, was taken into considera- tion. In cardiac muscle [34], three variants of MLC1 slow exist and the more acidic forms are phosphorylat- ed either in Ser200 or in Thr69. Our observations are, to the best of our knowledge, the first demonstration that two variants with different isoelectric points exist also in skeletal muscle. The reactivity with anti-(P-ser- ine) immunoglobulin suggests that a serine residue is phosphorylated. The ratio between the unphosphoryl- ated and phosphorylated variants is similar in cardiac and in skeletal muscle as for both fast and slow MLC1 the more acidic form represents 25% of the total. In cardiac muscle, ischemic preconditioning has been shown to modify the ratio from 1 : 4 to 1 : 3 [34]. Our results show that in skeletal muscles neither denerva- tion nor hindlimb unloading (our unpublished data) were able to modify the ratio between the variants of MLC1.
the observed changes
this
to be
further
regulation needs
relevance of
taking into account
To shed some light on the intracellular signaling controlling MLC2 phosphorylation and pathway MLC kinase expression, we explored whether the degree of phosphorylation and MLC kinase concen- tration were affected by 2 weeks of CsA administra- tion, a condition that is expected to reproduce the transcriptional denervation. According to a widely accepted model, the transcrip- tional effects of neural discharge pattern are medi- ated by an intracellular signalling pathway that links cytosolic calcium increase to calmodulin (CAM), cal- cineurin (CaN) and NFAT [30,33]. Dephosphorylated by CaN, NFAT translocates into the nucleus and contributes to activate the transcription of genes spe- cific for the slow phenotype [30,32,41,42]. CsA is expected to inhibit the phosphatase action of CaN and therefore to block the signalling pathway con- necting neural stimulation and transcription. The results obtained in this study confirmed that CsA transition in administration induces a slow-to-fast soleus, as previously observed by Bigard et al. [33], and also a fast-to-less fast transition in EDL; how- ever, no significant changes in MLC2 phosphoryla- expression were detected. tion and MLC kinase in MHC isoform Whereas expression suggest that CsA administration was effective at the transcriptional level, the lack of effect on MLC2 phosphorylation and MLC kinase expres- these two parameters sion supports the view that were regulated by a pathway different from CAM– CaN–NFAT. This conclusion needs to be considered with caution as CsA treatment and denervation might be not completely overlapping, in view of the following reasons (a) whereas CsA should only inter- fere with the signalling pathway mediating neural discharge inside muscle fibres, denervation achieved by severing the sciatic nerve not only interrupts neural discharge on muscles, but also causes unload- ing as activity of both agonist and antagonist mus- cles is removed, (b) fast muscles, such as EDL, are more responsive to CsA than slow muscles with regard to atrophy and to myosin isoform transition, as previously observed by Bigard et al. [33], in agree- ment with the higher concentration of CaN in fast
In conclusion, this study provides evidence which strongly suggests that changes in fibre type are asso- ciated with changes in myosin phosphorylation level, with an increase associated with slow-to-fast trans- ition and a decrease associated with fast-to-slow transition. In particular, the comparison between den- ervation of soleus and CLFS of EDL shows that the pattern of low frequency neural stimulation, typical of slow muscles, determines low levels of phosphory- the typical lation together with the expression of slow fibre genes. The mechanism and the time course of clarified, although the parallel variations of phosphorylation and MLC kinase amount point to the transcriptional regulation of MLC kinase as a possible mechanism, and the lack of effect of CsA administration suggests a calcineurin-independent intracellular signalling. The physiological the association between fast fibre phenotype and higher phosphorylation lev- els can be understood, that the same time, a repetitive stimulation induces, at decrease in force development through the fatigue mechanism and an increase in force development through phosphorylation. Thus, the presence of a more effective phosphorylation mechanism in fast fibres, which are more prone to fatigue, might repre- the quick sent a useful mechanism to counteract reduction of force that, in fast fibres, follows con- tractile activity.
FEBS Journal 272 (2005) 5771–5785 ª 2005 FEBS
5780
C. Bozzo et al.
Myosin phosphorylation and denervation
Experimental procedures
end of the treatment, precisely as indicated for denervation (see comparison 1, above). The CLFS group was compared with the CONT group described in comparison 1.
Animals and treatments
Protein extraction for 1D- and 2D-electrophoreses
Experiments were performed on adult male Wistar rats weighing (cid:1) 250 g. Animals were divided into five groups for three comparisons, as described below. The experiments and the treatment of the animals were approved by the French Agricultural and Forest Ministry and the French National Education Ministry (authorization 5900996).
Comparison 1: effects of denervation
compared with five
Muscle powder was used to extract myofibrillar proteins for MHC and MLC analysis by electrophoresis. Myofibril- lar proteins were extracted from 7 to 10 mg of dry muscle powder, as described previously [45], washed first with a solution containing 6.3 mm EDTA (pH 7), 0.1% (v ⁄ v) pepstatine and 1% (v ⁄ v) phenylmethanesulfonyl fluoride, and then with a second solution containing 50 mm KCl, 0.1% (v ⁄ v) pepstatine and 1% (v ⁄ v) phenylmethanesulfo- nyl fluoride. The proteins were resuspended in 1mL of sterile MilliQ water and their concentration was deter- mined by a protein assay kit (Dc Protein Assay; BioRad, Ivry s ⁄ Seine, France) to prepare samples with a final pro- tein content of 10 lg for 1D-electrophoresis, 70 lg for 2D-electrophoresis, and 150 lg for mass spectrometry. This last protein quantity was chosen to optimize the mass spectrometry analysis by intensifying the less abundant spots, and avoiding contamination between spots migra- ting in very near positions. Then, the proteins were preci- pitated for 2 h with acetone (8 : 1 v ⁄ v), followed by centrifugation for 1 h at 13 000 g. The pellet was dissolved in Laemmli solution for SDS ⁄ PAGE or in rehydration buffer for 2D-electrophoresis.
1D-electrophoresis for MHC and MLC analyses
Five animals with surgical section of the sciatic nerve (DE) were control, untreated animals (CONT). Rats of the DE group were anaesthetized with Zoletil (10 mgÆkg)1; zolazepam ⁄ tiletamine 1 : 1, v ⁄ v) and xilazine (2%, v ⁄ v) 0.06 mLÆkg)1, and (cid:1)1 cm of the sciatic nerve on the right hindlimb at the level of trochanter was removed. The left hindlimb was used as a control of the denervation (CODE). Two weeks after denervation, the ani- mals were anaesthetized with an intraperitoneal injection of ethylcarbamate and left in a completely relaxed state for 10 min, then the muscles (soleus and EDL) were dissected and the animal killed by exsanguination. Once dissected, soleus and EDL were quickly blotted, weighed and frozen in liquid N2. The muscles were then pulverized in a small steel mortar cooled with fluid nitrogen and stored at )80 (cid:1)C until analysed. The time from muscle dissection to freezing never exceeded 10 min, and preliminary experi- ments showed that no substantial differences in the propor- tions of MLC variants were observed using a faster freezing protocol.
Comparison 2: effects of CsA administration
MHC isoform composition was determined by SDS ⁄ PAGE on a 4.5% stacking gel and a 8% separating gel. Electro- phoresis was run for 20 h at low temperature (180 V con- stant, 13 mA per gel). For the analysis of MLC isoform composition, 12% separating gels with 4% stacking gels were used. The electrophoresis was run for 8 h at low tem- perature (150 V, 13 mA per gel). After the run, gel slabs were silver-stained, as described previously [24]. The relative proportions of MHC or MLC isoforms in each sample were determined by densitometry (GS-700 Imaging Densi- tometer; BioRad). At least two independent measurements were performed on each sample. The mean value was used as an individual measurement.
A group of five animals received 10 mgÆday)1Ækg)1 CsA, diluted in a 10% cremophor A solution, by intraperitoneal injection. This group was compared with a group of five rats receiving the vehicle alone (i.e. 10% cremophor A solu- tion) (COCsA). The volume of the cremophor solution injected was calculated according to the animal weight, as for the CsA group. At the end of 2 weeks of treatment, ani- mals were killed and muscles prepared exactly as described for denervation experiments (see comparison 1, above).
2D-electrophoresis for MLC analysis
Comparison 3: CLFS
Proteins were separated by 2D-gel electrophoresis, using a procedure similar to that previously described [24]. For the first dimension, or IEF, proteins were solubilized in 8 m urea, 2% (v ⁄ v) Chaps, 0.01 m dithiothreitol and 2% carrier ampholites (buffer, and then separated using the Ettan IPGphor Isoelectric Focusing System on 3.5% acrylamide (all strips with immobilized pH gradients
(pH 4–7)
Finally, a group of five rats were treated at the Institute of Neurophysiology, University of Oslo, according to the pro- tocol indicated as CLFS. After sciatic nerve section, EDL was stimulated with trains at 20 Hz for 10 s, every 20 s for three weeks [29,36], a period necessary to obtain an optimal fast-to-slow phenotype transition. EDL was prepared at the
FEBS Journal 272 (2005) 5771–5785 ª 2005 FEBS
5781
C. Bozzo et al.
Myosin phosphorylation and denervation
Amersham Biosciences, Bucks, UK). Strips were rehydrated at 50 V for 12 h and proteins were focused under the fol- lowing voltage conditions: 500 V for 1 h, 500–1000 V for 1 h, and 8000 V until reaching 100 000 VÆh. The tempera- ture was kept constant at 20 (cid:1)C. After reduction with a buffer comprising 6 m urea, 30% (v ⁄ v) glycerol, 2% (v ⁄ v) dithiothreitol and 0.375 m Tris ⁄ HCl, pH 8.8, and alkylation with the same buffer containing 2.5% (v ⁄ v) iodoacetamide, the strips were embedded in a 4% polyacrylamide stacking gel and the proteins separated by SDS ⁄ PAGE (12% gel) for 8 h at 150 V at low temperature (4 (cid:1)C). Following elec- trophoresis, the gels were silver-stained, as described previ- ously [24] or stained with Coomassie Brilliant Blue, as specified. The positions of slow and fast isoforms of MLC on 2D gels were identified according to their isoelectric point in the first dimension, and to appropriate markers of molecular weight in the second dimension, and confirmed by immunostaining [24] and by mass spectrometry (see below).
the percentage distribution of
each spot was characterized by a value of brightness-area product (BAP) with a constant threshold after black ⁄ white inversion using Adobe Photoshop Software (Adobe, San Jose, CA, USA). In each gel, the BAP values of the spots identified as slow and, respectively, fast isoforms of MLC1 and MLC2 were summed to give a total for each isoform: slow MLC1, fast MLC1, slow MLC2 and fast MLC2. The value of each spot was expressed as a percentage of the total value for that particular isoform. From percent- age values obtained in different gels, the mean values ± standard deviation were calculated. The quantification pro- cedure had been validated previously [24] by running, on separate gels, known mixtures of a constant amount of purified actin and increasing amounts of purified slow MLC2, and determining the ratio between the BAP values of MLC2 and actin (Fig. 1B in Bozzo et al. [24]). The reli- ability of the silver staining was further validated by com- paring the spot quantification on silver-stained and on Coomassie blue-stained gels. Both staining protocols lead to similar values of the MLC variants.
Protein transfer and immunoblotting
Mass spectrometry for identification of the 2D spots
Tryptic in-gel digestion
Selected spots were excised from 2D gels stained with Coo- massie Brilliant Blue, and proteins were in-gel digested, as previously described [46]. Briefly, gel pieces were destained and the proteins were reduced with dithiothreitol, alkylated with iodoacetamide and digested with porcine trypsin (modi- fied sequencing grade; Promega, Madison, WI, USA) over- night at 37 (cid:1)C. The supernatant was then transferred to another tube and residual tryptic peptides were extracted upon incubation of gel spots, first with 25 mm NH4HCO3 at 37 (cid:1)C for 15 min followed by shrinking of gel pieces with acetonitrile, and then upon incubation with 5% (v ⁄ v) formic acid at 37 (cid:1)C for 15 min and shrinking with acetonitrile. The extracts were combined with the primary supernatant and dried in a SpeedVac centrifuge (Savant Instrument Inc., NY, USA). Protein digests were then resuspended in 20 lL of 1% (v ⁄ v) trifluoroacetic acid and purified on Zip Tip C18 microcolumns (Millipore, Bedford, MA, USA) according to the instructions provided by the manufacturer. Peptides were eluted in 50% (v ⁄ v) methanol containing 0.1% (v ⁄ v) formic acid, and analysed directly by mass spectrometry.
Proteins separated on 12% gels by SDS ⁄ PAGE were trans- ferred to nitrocellulose membrane to analyse the expression of MLC kinase, PP1 and actin by immunostaining. Proteins separated on 2D gels were transferred to nitrocellulose mem- brane to characterize the spots corresponding to the MLC. In both cases, transfer was obtained by a semidry transfer procedure by applying a current of 0.8 mAÆcm)2 for 6 h. Nitrocellulose sheets were reacted first with the primary anti- bodies for 1 h at 37 (cid:1)C. The following primary antibodies were used: monoclonal anti-actin clone AC-40 (A3853; Sigma Aldrich, St Louis, MO, USA), polyclonal anti-(MLC kinase) (sc9456), polyclonal anti-(PP1) (sc6106), polyclonal anti-(MLC2) (FL-172sc15370) (Santa Cruz Biotechnology, Santa Cruz, CA, USA), monoclonal anti-(phospho-serine) (PSR-45) and monoclonal anti-(phospho-threonine) (PTR-8) (both Sigma Aldrich). Then, a rabbit anti-mouse immuno- globulin (P260; Dako, Glostrup, Denmark) for anti-actin, a goat anti-mouse immunoglobulin (Chemicon International, Hants, UK) for anti-phosphoserine and anti-phosphothreo- nine, and a rabbit anti-goat immunoglobulin (A5420; Sigma Aldrich) for anti-(MLC kinase), anti-PP1 and anti-MLC2 were employed as secondary antibodies. The bands or the spots were visualized by an enhanced chemiluminescence (ECL) method. Preliminary tests were carried out for each antibody to check any cross-reactivity and to verify the exact position of each protein on the gel, particularly actin and PP1 that had a very similar molecular mass.
Mass spectrometry
Image analysis and quantification
Mass spectra were acquired on a tandem mass spectrometer Q-TOF Micro (Micromass, Manchester, UK) equipped with a Z-spray nanoflow electrospray interface. NanoESI capillaries were prepared in-house from borosilicate glass
2D gels were digitized with a scanner (EPSON 1650; Epson, Meerbusch, Germany) at a resolution of 1200 dots per inch. The spots were analysed densitometrically and
FEBS Journal 272 (2005) 5771–5785 ª 2005 FEBS
5782
C. Bozzo et al.
Myosin phosphorylation and denervation
Spatiales, grant 3194), Conseil Regional du Nord Pas-de-Calais. The authors wish to express their gratit- ude to Professor T. Lomo, Institute of Neurophysiol- ogy, University of Oslo, for valuable help with CLFS experiments, and to Novartis Pharma AG, Basel for the gift of CsA.
References
1 Schiaffino S & Reggiani C (1996) Molecular diversity of myofibrillar proteins: gene regulation and functional significance. Physiol Rev 76, 371–423.
2 Buller AJ, Eccles JC & Eccles RM (1960) Interactions between motoneurones and muscles in respect of the characteristic speeds of their responses. J Physiol 150, 417–439.
3 Midrio M, Danieli-Betto D, Megighian A, Velussi C,
Catani C & Carraro U (1992) Slow-to-fast transforma- tion of denervated soleus muscle of the rat, in the pre- sence of an antifibrillatory drug. Pflugers Arch 420, 446–450.
4 Schiaffino S, Gorza L, Pitton G, Saggin L, Ausoni S, Sartore S & Lomo T (1988) Embryonic and neonatal myosin heavy chain in denervated and paralyzed rat skeletal muscle. Dev Biol 127, 1–11.
5 Kirschbaum BJ, Heilig A, Hartner KT & Pette D
tubes of 1 mm outer diameter (OD) and 0.78 mm inner dia- meter (ID) (Harvard Apparatus, Holliston, MA, USA) using a Flaming ⁄ Brown P-80 PC micropipette puller (Sutter Instruments, Hercules, CA, USA), and gold coated using an Edwards S150B sputter coater (Edwards High Vacuum, Crawley, West Sussex, UK). The capillary tips were cut under a stereomicroscope to give inner diameters of 1–5 lm. Typically, 2 lL of solution eluted from the Zip Tip C18 microcolumn was loaded directly onto the capillary tips and analysed using the following experimental parame- ters (positive ion mode): capillary voltage, 1.5 kV; sample cone, 30.0 V; extractor cone, 1.0 V. In the collision cell, argon was at an indicated inlet pressure of 10 p.s.i. and the collision energy setting was 4.0 V. The electrospray source was heated at 40 (cid:1)C and the desolvatation gas (nitrogen) was set at a flow of 50 LÆh)1. When MS ⁄ MS experiments were performed, the collision gas was typically used at an indicated inlet pressure of 30 p.s.i. and the collision energy setting was 30 V. External calibration was performed using a solution of 0.1% (v ⁄ v) phosphoric acid in 50% (v ⁄ v) aqueous acetonitrile. Instrument control, data acquisition and processing were achieved with masslynx software (Micromass). Deionized water from the MilliQ water sys- tem (Millipore) was always used. HPLC-grade methanol and acetonitrile, trifluoroacetic acid, dithiothreitol and iodoacetamide were purchased from Fluka (Buchu, Switzer- land). Formic acid was obtained from Sigma.
Database searching
(1989) Electrostimulation-induced fast-to-slow transi- tions of myosin light and heavy chains in rabbit fast- twitch muscle at the mRNA level. FEBS Lett 243, 123–126.
6 Kirschbaum BJ, Schneider S, Izumo S, Mahdavi V,
Nadal-Ginard B & Pette D (1990) Rapid and reversible changes in myosin heavy chain expression in response to increased neuromuscular activity of rat fast-twitch muscle. FEBS Lett 268, 75–78.
7 Salmons S & Vrbova G (1969) The influence of activity on some contractile characteristics of mammalian fast and slow muscles. J Physiol 201, 535–549.
Molecular mass values of individual tryptic peptides, and MS ⁄ MS spectra used for protein identification, were searched using the MASCOT search engine (http:// www.matrixscience.com) against the SWISS-PROT data- base, with trypsin plus potentially one missed cleavage. Peptide mass fingerprint and MS ⁄ MS spectra analysis used the assumption that peptides were monoisotopic, carbami- domethylated at cysteine residues and, as a variable modifi- cation, oxidized at methionine residues.
8 Pette D & Staron RS (1990) Cellular and molecular diversities of mammalian skeletal muscle fibers. Rev Physiol Biochem Pharmacol 116, 1–76.
Statistical analysis
9 Huey KA & Bodine SC (1998) Changes in myosin mRNA and protein expression in denervated rat soleus and tibialis anterior. Eur J Biochem 256, 45–50.
All data were expressed as mean values ± standard devi- ation. The statistical significance of the difference between means was determined using the t-test or ANOVA followed by the Bonferroni test. Differences at or above the 95% confidence level were considered significant (P < 0.05).
Acknowledgements
10 Michel RN, Parry DJ & Dunn SE (1996) Regulation of myosin heavy chain expression in adult rat hindlimb muscles during short-term paralysis: comparison of denervation and tetrodotoxin-induced neural inactiva- tion. FEBS Lett 391, 39–44.
11 Jakubiec-Puka A, Ciechomska I, Morga J & Matusiak
A (1999) Contents of myosin heavy chains in denervated slow and fast rat leg muscles, Comp Biochem Physiol B Biochem Mol Biol 122, 355–362.
This work was partially supported by EU grant HPRN-CT-2000-0091 to CB, Italian Ministry of Uni- versity, through PRIN (Research Project of National Interest) grant 2004, CNES (Centre National d’Etudes
FEBS Journal 272 (2005) 5771–5785 ª 2005 FEBS
5783
C. Bozzo et al.
Myosin phosphorylation and denervation
12 Larsson L & Ramamurthy B (2000) Aging-related
changes in skeletal muscle. Mechanisms and interven- tions. Drugs Aging 17, 303–316.
chain associated with slow-to-fast transition in rat soleus. Am J Physiol Cell Physiol 285, C575–C583. 25 Germinario E, Esposito A, Megighian A, Midrio M, Biral D, Betto R & Danieli-Betto D (2002) Early changes of type 2B fibers after denervation of rat EDL skeletal muscle. J Appl Physiol 92, 2045–2052.
13 Larsson L, Yu F, Hook P, Ramamurthy B, Marx JO & Pircher P (2001) Effects of aging on regulation of mus- cle contraction at the motor unit, muscle cell, and mole- cular levels. Int J Sport Nutr Exerc Metab 11 (Suppl.), S28–S43.
26 Matsushita STS, Shoji S & Yanagisawa N (1988) Effect of denervation on contractile properties and myosin light chain phosphorylation in rat fast-twitch skeletal muscles. Biomed Res 9, 353–360.
27 Tubman LA, Rassier DE & MacIntosh BR (1996)
14 Blumenthal DK & Stull JT (1980) Activation of skeletal muscle myosin light chain kinase by calcium (2+) and calmodulin. Biochemistry 19, 5608–5614.
Absence of myosin light chain phosphorylation and twitch potentiation in atrophied skeletal muscle. Can J Physiol Pharmacol 74, 723–728.
28 Mitchell PO, Mills ST & Pavlath GK (2002) Calcineurin
15 Damer CK, Partridge J, Pearson WR & Haystead TA (1998) Rapid identification of protein phosphatase 1-binding proteins by mixed peptide sequencing and data base searching. Characterization of a novel holoen- zymic form of protein phosphatase 1. J Biol Chem 273, 24396–24405.
16 Fujioka M, Takahashi N, Odai H, Araki S, Ichikawa
differentially regulates maintenance and growth of phe- notypically distinct muscles. Am J Physiol Cell Physiol 282, C984–C992.
29 Windisch A, Gundersen K, Szabolcs MJ, Gruber H & Lomo T (1998) Fast to slow transformation of dener- vated and electrically stimulated rat muscle. J Physiol 510, 623–632.
30 Chin ER, Olson EN, Richardson JA, Yang Q,
K, Feng J, Nakamura M, Kaibuchi K, Hartshorne DJ, Nakano T et al. (1998) A new isoform of human myo- sin phosphatase targeting ⁄ regulatory subunit (MYPT2): cDNA cloning, tissue expression, and chromosomal mapping. Genomics 49, 59–68.
Humphries C, Shelton JM, Wu H, Zhu W, Bassel-Duby R & Williams RS (1998) A calcineurin-dependent tran- scriptional pathway controls skeletal muscle fiber type. Genes Dev 12, 2499–2509.
17 Moorhead G, Johnson D, Morrice N & Cohen P (1998) The major myosin phosphatase in skeletal muscle is a complex between the beta-isoform of protein phospha- tase 1 and the MYPT2 gene product. FEBS Lett 438, 141–144.
18 Persechini A, Stull JT & Cooke R (1985) The effect of
myosin phosphorylation on the contractile properties of skinned rabbit skeletal muscle fibers. J Biol Chem 260, 7951–7954.
31 Meissner JD, Gros G, Scheibe RJ, Scholz M & Kubis HP (2001) Calcineurin regulates slow myosin, but not fast myosin or metabolic enzymes, during fast-to-slow transformation in rabbit skeletal muscle cell culture. J Physiol 533, 215–226.
32 Schiaffino S & Serrano A (2002) Calcineurin signaling
and neural control of skeletal muscle fiber type and size. Trends Pharmacol Sci 23, 569–575.
33 Bigard X, Sanchez H, Zoll J, Mateo P, Rousseau V,
19 Stephenson GM & Stephenson DG (1993) Endogenous MLC2 phosphorylation and Ca(2+)-activated force in mechanically skinned skeletal muscle fibres of the rat. Pflugers Arch 424, 30–38.
20 Moore RL & Stull JT (1984) Myosin light chain phos- phorylation in fast and slow skeletal muscles in situ. Am J Physiol 247, C462–C471.
21 Klug GA, Biedermann M, Houston ME, Stuart D,
Veksler V & Ventura-Clapier R (2000) Calcineurin co- regulates contractile and metabolic components of slow muscle phenotype. J Biol Chem 275, 19653–19660. 34 Arrell DK, Neverova I, Fraser H, Marban E & Van
Mumby M & Stull JT (1992) Chronic low frequency stimulation reduces myosin phosphorylation in rabbit fast twitch muscle. Can J Physiol Pharmacol 70, 859– 865.
22 Klug GA, Botterman BR & Stull JT (1982) The effect of low frequency stimulation on myosin light chain phosphorylation in skeletal muscle. J Biol Chem 257, 4688–4690.
Eyk JE (2001) Proteomic analysis of pharmacologically preconditioned cardiomyocytes reveals novel phosphory- lation of myosin light chain 1. Circ Res 89, 480–487. 35 Stevens L, Firinga C, Gohlsch B, Bastide B, Mounier Y & Pette D (2000) Effects of unweighting and clenbuterol on myosin light and heavy chains in fast and slow mus- cles of rat. Am J Physiol Cell Physiol 279, C1558– C1563.
23 Gonzalez B, Negredo P, Hernando R & Manso R
36 Westgaard RH & Lomo T (1988) Control of contractile properties within adaptive ranges by patterns of impulse activity in the rat. J Neurosci 8, 4415–4426.
(2002) Protein variants of skeletal muscle regulatory myosin light chain isoforms: prevalence in mammals, generation and transitions during muscle remodelling. Pflugers Arch 443, 377–386.
24 Bozzo C, Stevens L, Toniolo L, Mounier Y & Reggiani C (2003) Increased phosphorylation of myosin light
37 Ikebe M, Inagaki M, Kanamaru K & Hidaka H (1985) Phosphorylation of smooth muscle myosin light chain kinase by Ca2+-activated, phospholipid-dependent pro- tein kinase. J Biol Chem 260, 4547–4550.
FEBS Journal 272 (2005) 5771–5785 ª 2005 FEBS
5784
C. Bozzo et al.
Myosin phosphorylation and denervation
43 Spangenburg EE, Williams JH, Roy RR & Talmadge RJ (2001) Skeletal muscle calcineurin: influence of phenotype adaptation and atrophy. Am J Physiol Regul Integr Comp Physiol 280, R1256–R1260.
44 Giger JM, Haddad F, Qin AX & Baldwin KM (2004)
Effect of cyclosporin A treatment on the in vivo regula- tion of type I MHC gene expression. J Appl Physiol 97, 475–483.
38 White MY, Cordwell SJ, McCarron HC, Tchen AS, Hambly BD & Jeremy RW (2003) Modifications of myosin-regulatory light chain correlate with function of stunned myocardium. J Mol Cell Cardiol 35, 833–840. 39 Fitzsimons DP, Bodell PW & Baldwin KM (1989) Phos- phorylation of rodent cardiac myosin light chain 2: effects of exercise. J Appl Physiol 67, 2447–2453. 40 Stevenson EJ, Giresi PG, Koncarevic A & Kandarian SC (2003) Global analysis of gene expression patterns during disuse atrophy in rat skeletal muscle. J Physiol 551, 33–48.
45 Toursel T, Bastide B, Stevens L, Rieger F & Mounier Y (2000) Alterations in contractile properties and expres- sion of myofibrillar proteins in wobbler mouse muscles. Exp Neurol 162, 311–320.
46 Wilm M, Shevchenko A, Houthaeve T, Breit S,
41 Crabtree GR & Olson EN (2002) NFAT signaling: choreographing the social lives of cells. Cell 109 (Suppl.), S67–S79.
42 Rao A, Luo C & Hogan PG (1997) Transcription fac-
Schweigerer L, Fotsis T & Mann M (1996) Femtomole sequencing of proteins from polyacrylamide gels by nano-electrospray mass spectrometry. Nature 379, 466–469.
tors of the NFAT family: regulation and function. Annu Rev Immunol 15, 707–747.
FEBS Journal 272 (2005) 5771–5785 ª 2005 FEBS
5785