intTypePromotion=1
zunia.vn Tuyển sinh 2024 dành cho Gen-Z zunia.vn zunia.vn
ADSENSE

Numerical investigation of stress intensity factor for semi-circular bend specimen with chevron notch

Chia sẻ: Huỳnh Lê Khánh Thi | Ngày: | Loại File: PDF | Số trang:10

8
lượt xem
0
download
 
  Download Vui lòng tải xuống để xem tài liệu đầy đủ

One of the specimens to investigate the mode-I fracture toughness of rock and geo-materials is semi-circular bend (SCB) specimen. In general, initial cracks in rock test specimens are produced in two shapes: straight-edge cracks and chevron notches. The ISRM suggested SCB specimen has straight shaped notch.

Chủ đề:
Lưu

Nội dung Text: Numerical investigation of stress intensity factor for semi-circular bend specimen with chevron notch

  1. Engineering Solid Mechanics 3 (2015) 235-244 Contents lists available at GrowingScience Engineering Solid Mechanics homepage: www.GrowingScience.com/esm Numerical investigation of stress intensity factor for semi-circular bend specimen with chevron notch Eqlima Mahdavia,b*, Yuzo Obarab, Majid Reza Ayatollahia a Fatigue and Fracture laboratory, School of Mechanical Engineering, Iran University of Science and Technology, 16846-13114, Tehran, Iran b Graduate School of Science and Technology, Kumamoto University, Kumamoto, Japan ARTICLE INFO ABSTRACT Article history: One of the specimens to investigate the mode-I fracture toughness of rock and geo-materials is Received 6 April, 2015 semi-circular bend (SCB) specimen. In general, initial cracks in rock test specimens are Accepted 12 July 2015 produced in two shapes: straight-edge cracks and chevron notches. The ISRM suggested SCB Available online specimen has straight shaped notch. However, use of V-shaped (or chevron) notch in the SCB 15 July 2015 Keywords: specimen is preferred because of some technical difficulties associated with making a sharp Semi-circular bend specimen crack or creating pre-crack to conduct the experimental tests. In this paper, the minimum Chevron notch dimensionless stress intensity factor of cracked chevron notched semi-circular bend Rock (CCNSCB) specimen is determined using finite element analysis with ABAQUS software. An Stress intensity factor analytical method, (i.e. Bluhm’s slice synthesis method) is used to verify the results. It is shown Finite element analysis that a good agreement exists between the numerical data and theoretical results. © 2015 Growing Science Ltd. All rights reserved. 1. Introduction Rocks are complex materials which contain natural joints, fractures or flaws. Since discontinuities usually have some effects on the mechanical properties of rock, evaluation of cracks in rock mass is very important. Fracture mechanics is employed as a useful tool to solve various rock engineering problems such as rock cutting, hydraulic fracturing, tunneling, blasting, stability of rocks, etc. The earliest work on fracture mechanics in brittle materials was performed by Griffith (1921). Since, there were some limitations in Griffith theory, Irwin (1957) developed the extension of Griffith’s theory to an arbitrary crack and proposed the criterion for the crack growth. In addition, Irwin explained that the stress field around the crack tip is evaluated by an important parameter called stress intensity factor (SIF). Stress intensity factor, K as most important parameter in linear elastic fracture mechanics (LEFM), defines the magnitude of the local stresses around the crack tip. This factor depends on loading * Corresponding author. E-mail addresses: eqlima.mahdavi@gmail.com (E. Mahdavi) © 2015 Growing Science Ltd. All rights reserved. doi: 10.5267/j.esm.2015.7.001
  2. 236 condition, crack size, crack shape, and geometric boundaries. Fracture toughness is termed as critical value of stress intensity factor and denoted as Kc that describes the material resistance against propagation of pre-existing cracks (Kanninen & Popelar, 1985). Generally this parameter depends on temperature, environment, loading rate, the composition of the material and its microstructure as well as geometric properties. Accurately measuring the rock fracture toughness is crucial in engineering applications. Several methods have been proposed in the literature to measure the fracture toughness of rocks. International Society for Rock Mechanics (ISRM) suggested short rod (SR) and chevron bending (CB) test methods in 1988 (Ouchterlony, 1988), cracked chevron notched Brazilian disc (CCNBD) in 1995 (Fowell, 1995), and semi-circular bend specimen (SCB) in 2014 (Kuruppu et al., 2014). All of the specimens used in these methods are core-based, which facilitate the sample preparation from cores obtained from natural rock masses. Accordingly, several researchers have used the mentioned specimens for determining the mode I fracture toughness of different rocks (Ayatollahi & Aliha, 2008; Cui et al., 2010; Aliha et al., 2012a,b; Erarslan & Williams, 2012; Kuruppu & Chong, 2012; Akbardoost et al., 2014; Aliha & Ayatollahi, 2014; Dai et al., 2015). The semi-circular bend (SCB) specimen proposed initially by Chong and Kuruppu (1987) has recently received much attention by researchers. The SCB specimen have some advantages over other specimens such as convenient sample preparation (directly prepared from rock cores), simple geometry and loading configuration, the straightforward testing procedure and application of compressive load which is more appropriate for rocks instead of tensile loads. Furthermore, surrounding environment such as temperature, confining pressure, water vapor pressure and so on is known as important parameters which affect the fracture toughness of rock materials. The SCB specimen is suitable to measure the rock fracture toughness at elevated temperatures, high strain rates, high confining pressures, and water vapor pressure (Obara et al., 2007; Kuruppu & Chong, 2012). Artificial crack in rock test specimens can be created with either a straight or a chevron shape. When a cracked chevron notched rock specimen is subjected to an externally applied load, there is a stress concentration around the crack front. As this concentrated stress reaches a critical value, failure occurs. The fracture toughness is then calculated in terms of the stress intensity factor (SIF) using the failure load, notch size, and the other geometrical parameters of the specimen. Cracked chevron notched semi-circular bending (CCNSCB) method was first proposed by Kuruppu (1997) as shown in Fig. 1. Unlike the straight cracked samples, computation of the stress intensity factor is not easy and straightforward for a chevron notch crack. In this paper, finite element analysis is performed for obtaining the minimum dimensionless stress intensity factor in the chevron notched semi-circular bend specimen. Then an analytical method (i.e. Bluhm’s slice synthesis method) is applied to verify the results. 
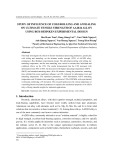
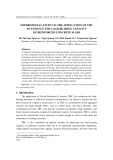
2. Semi-circular bend specimen Geometric parameters in the CCNSCB specimen of radius R is shown in Fig. 1b in which a0, a1, and am are the initial, final, and critical crack lengths, respectively. θ is the half of the chevron notch angle, B is the thickness and S is the half-distance between the supports. However, the normalized parameters are used as α0 (=a0/R), α1 (=a1/R), α(=a/R), αB(=aB/R), and αS(=S/R).
  3. E. Mahdavi et al. / Engineering Solid Mechanics 3 (2015) 237 A 𝑹 P 𝒂𝟏 𝒂𝒎 R 𝒂𝟎 a 𝟐𝜽 𝒃 𝑩 2S A (a) (b) Fig. 1. (a) Semi-circular bend specimen geometry and loading configuration, and (b) chevron notch Using the formulation proposed by ISRM to calculate the rock fracture toughness of CCNBD specimen (Fowell, 1995), the following formulation could be written for the fracture toughness (KIc) of the CCNSCB specimen: Pmax * K Ic = Ymin (1) B R Indeed, KIc is the critical stress intensity factor corresponding to the initiation of fracture. In Eq. (1) Y*min is the minimum dimensionless stress intensity factor for mode-I loading, and Pmax is the maximum peak load at the onset of fracture. Y*min can be determined using numerical techniques. In the next section the variations of this non dimensional fracture parameter is obtained for different geometries of notch in the CCNSCB specimen. 3. Finite element analysis of SCB specimen In the following, the CCNSCB is analyzed by the commercial finite element software ABAQUS and the stress intensity factor is determined using the J-integral method. 3D modeling of the CCNSCB is used to calculate the distribution of stress intensity factor at the crack front. The mechanical properties were selected as E = 2.94 GPa and ν = 0.3. Geometric properties of the specimen can be found in Table 1. Table 1. Geometric properties in mm Geometric parameter Value Normalized value Radius of specimen, R (mm) 37.5 - Thickness of specimen, B (mm) 30 αB=0.8 Support distance, 2S (mm) 26.25 αs=0.7 Initial crack length, a0 (mm) 3.75 α0=0.1 Final crack length, a1 (mm) 22.5 α1=0.6 Chevron angle, 2θ π/2 - 
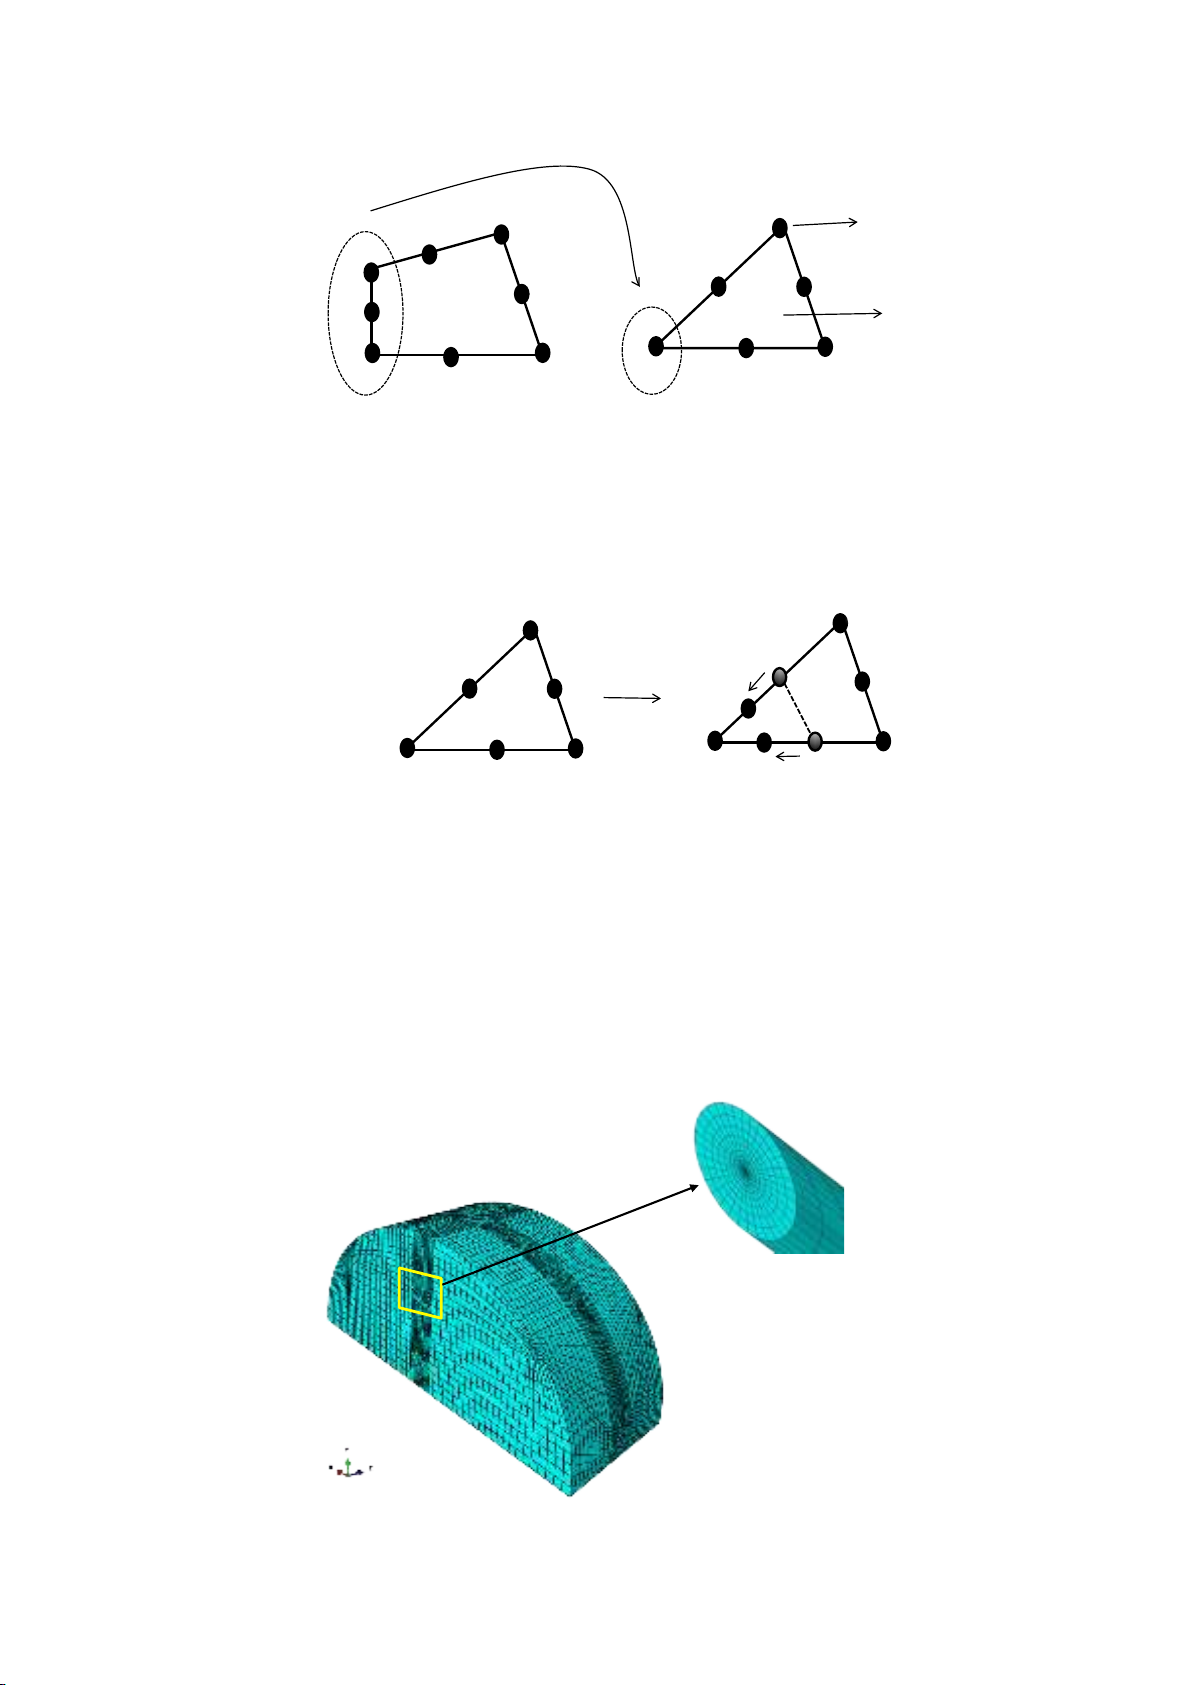
After geometric modeling and appropriate partitioning the model, the crack can be created. For modeling the crack, there are two important points that must be considered. The first is that since around the crack tip, the triangular elements can cover the model better than other elements, they should be used at the first ring around the crack tip; But, for performing the J-integral method it is not allowed to use of two types of elements in the model. To solve this problem, the collapsed element was introduced. In collapsed elements, the nodes on one side around the crack front have the same geometric location at the crack tip. In Fig. 2, the collapsed element is shown in 2D modeling.
  4. 238 The nodes are tied together 1 1 node 4 6 4 2 2 Crack front 7 element 6 8 3 7 3 8 5 5 Fig. 2. Collapsed element for modeling the crack tip region. In addition, the other important issue must be considered is the singularity at the crack tip. Actually, to obtain the mesh convergence in a small-strain analysis, the singularity at the crack tip should be considered. In small-strain analysis, the strain singularity of linear elasticity is ε∝r-1/2 (r is the distance from the crack tip). By moving the mid-side nodes on the sides connected to the crack tip to the ¼ point nearest to the crack tip, singularity of linear elasticity can be satisfied (as shown in Fig. 3). 1 1 4 2 2 4 6 6 Crack tip 7 3 7 3 8 8 5 5 Fig. 3. Elastic singular element If the part is two-dimensional, the crack front should be modeled with a ring of triangles and quadrilateral elements are assigned to the rest of the contour integral region. In the case of three- dimensional, a ring of wedges and hexahedral elements are used for the crack front and the remainder of the contour integral region, respectively. A typical 3D finite element modeling of the CCNSCB specimen can be seen in Fig. 4. Approximately, 50000 20-node 3D elements were used to mesh this model. As mentioned above, because of singularity at the crack tip, the elastic singular elements and finer mesh were used around the crack tip as shown in Fig. 4 Fig. 4. A typical finite element mesh used for simulating the CCNSCB specimen.
  5. E. Mahdavi et al. / Engineering Solid Mechanics 3 (2015) 239 
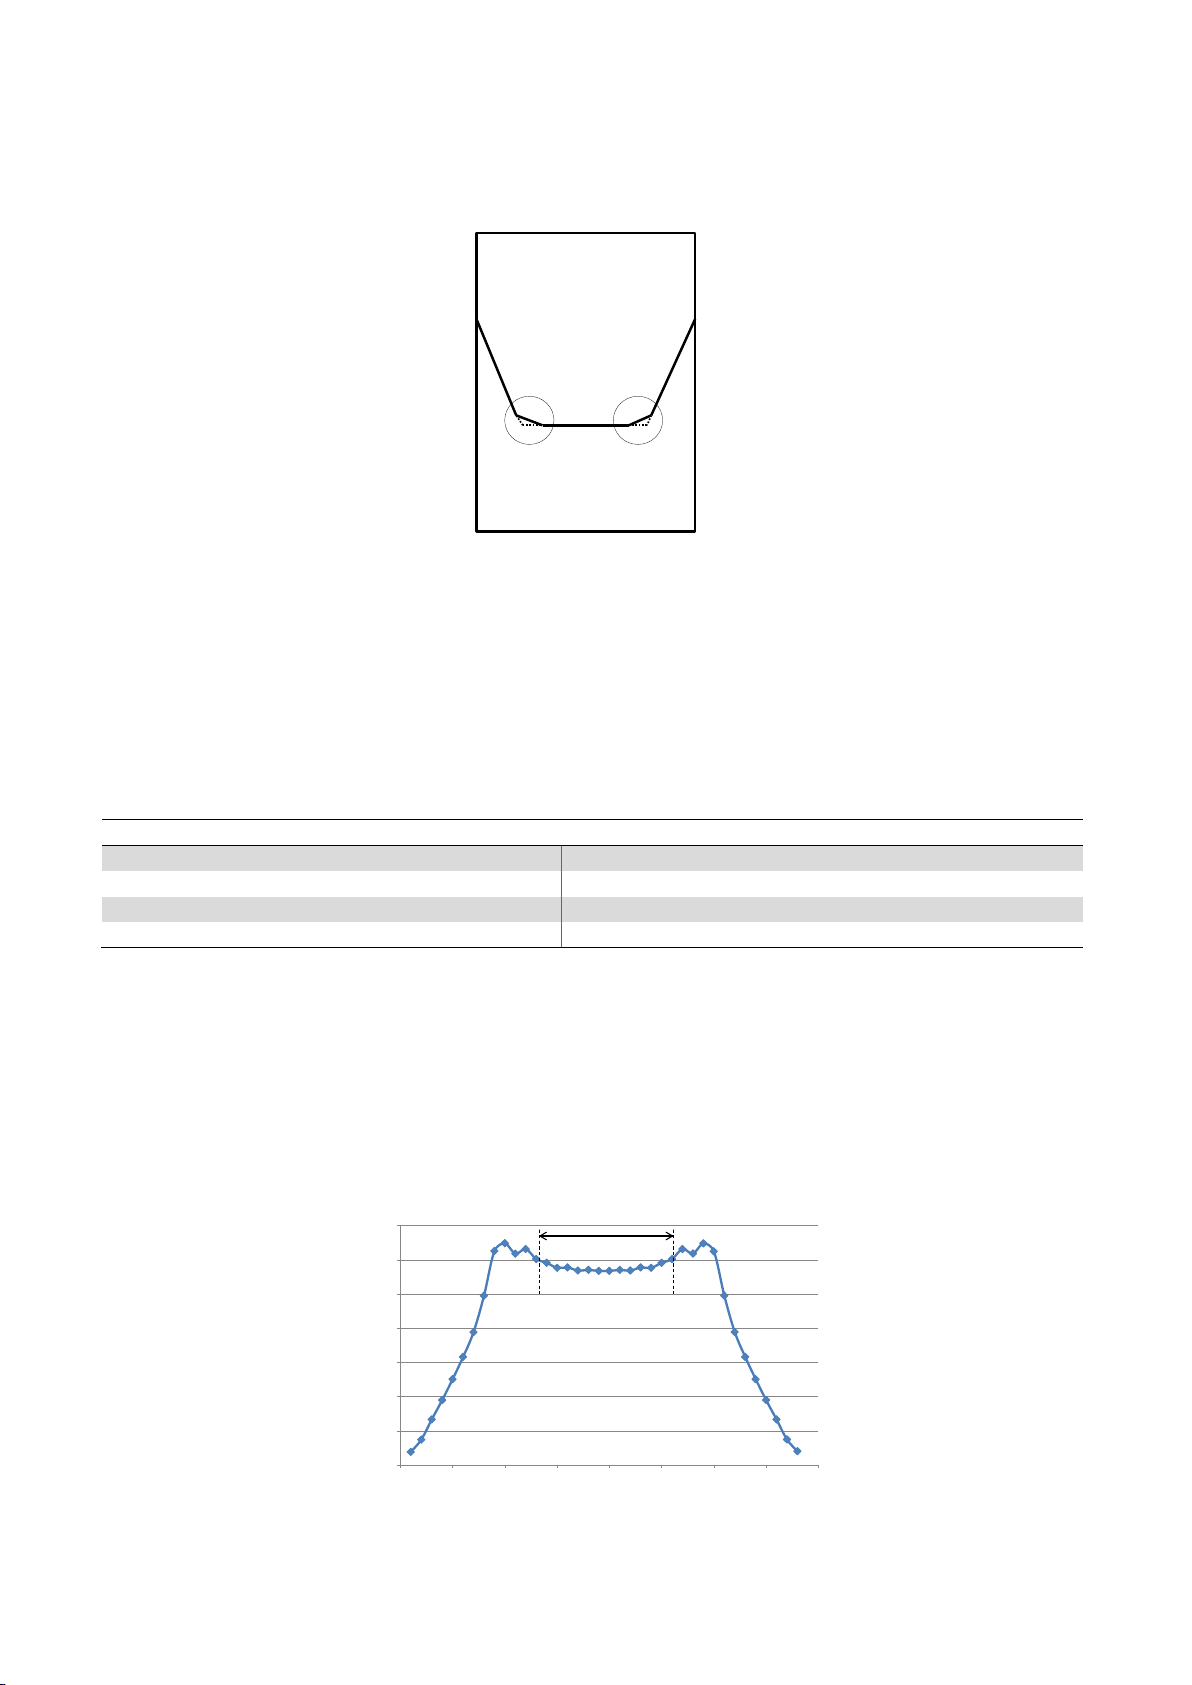
It should be noted that there were some problems in the modeling of chevron notch because of high stress concentration at the two corners of notch. As shown in Fig. 5, the modified shape of sharp corners was used to model the chevron notch in the ABAQUS software. Using this model, more uniform results can be obtained. Fig. 5. Modified shape of chevron notch modeling in the ABAQUS software In fact, to compute the minimum stress intensity factor at critical crack length, the crack length was increased step by step from initial crack length to the final crack length. After that, by plotting the distribution of dimensionless stress intensity factor for different values of crack length and finding the turning point in the diagram, the critical crack length and the corresponding minimum dimensionless stress intensity factor can be obtained. For this purpose, eight different crack lengths were considered to analyze the CCNSCB specimen as shown in Table 2. Table 2. Different crack length in each case of FE modeling α=a/R α=a/R Case-1 0.2 Case-5 0.4 Case-2 0.25 Case-6 0.45 Case-3 0.3 Case-7 0.5 Case-4 0.35 Case-8 0.55 4. Results and discussion The distribution of the stress intensity factor along the crack front for case-3 was plotted in Fig. 6. It can be seen that the diagram has a relatively uniform region at the middle part of the crack front and two decreasing part at the two side notches. In fact, the two side notches are not true crack. In addition, stress intensity factors are not identical along the middle part of the crack front. Thus, a suitable averaging method should be used for the values of stress intensity factor at the uniform middle part of the crack front. 3.50 3.00 2.50 2.00 Y* 1.50 1.00 0.50 0.00 0.00 5.00 10.00 15.00 20.00 25.00 30.00 35.00 40.00 Node number along crack front Fig. 6. Dimensionless stress intensity factor along the crack front for case-1
  6. 240 The same procedure was repeated for different values of the crack front and the average of dimensionless stress intensity factor was determined in the region of the uniform middle part for each case. The results of dimensionless stress intensity factor are summarized in Table 3. Table 3. Finite element values obtained for the dimensionless stress intensity factor and for different crack length ratios α Y* Case-1 0.2 3.01 Case-2 0.25 2.80 Case-3 0.3 2.86 Case-4 0.35 2.97 Case-5 0.4 3.2 Case-6 0.45 3.5 Case-7 0.5 3.92 Case-8 0.55 4.52 The variation of Y* with respect to the dimensionless crack length, α is shown in Fig. 7. The relation is approximated to the convex downward. When the minimum value indicates the critical value, the crack length reaches its critical value. 5.5 5 4.5 Y* 4 3.5 Y*min=2.805 at α m =0.267 3 2.5 α m 0.3 0.1 0.2 0.4 0.5 0.6 Normalized crack length (α =a/R) Fig. 7. Variation of dimensionless stress intensity factor with dimensionless crack length It can be observed from this figure that the stress intensity factor in the CCNSCB specimen first decreases and then increases as the crack grows. In fact, due to the high stress concentration at the tip of chevron notch, the crack grows sub-critically at first; then after reaching a critical value (αm), unstable crack growth occurs rapidly and final failure takes place in the specimen. A forth order polynomial was fitted to Y* versus normalized crack length. To identify the critical crack length, maximum stress intensity factor was determined by setting the derivative of this equation to zero. One of the roots was equal to 0.267 as critical crack length. Thus, the minimum dimensionless stress intensity factor can be obtained from Eq. 2. Then, the fracture toughness of specimen could be obtained from Eq. 1 using maximum experimental load (fracture load). In this case, the minimum stress intensity factor was obtained as 2.805 at α=0.267. Y * = 63958 − 413618α + 171439α 2 − 309293α 3 + 224242α 4 . (2) In order to compare the result, a semi-analytical method, i.e., the slice synthesis method (SSM) was used. In this method that proposed first by Bluhm (1975), the thickness of the specimen is divided into a number of slices. Each slice is considered as a cracked straight through specimen that is simpler that the complex configuration of chevron notched specimens to be analyzed. A new slice synthesis method was proposed to obtain the stress intensity factor directly (Wang et al. 2004). They determined the stress
  7. E. Mahdavi et al. / Engineering Solid Mechanics 3 (2015) 241 intensity factor of the CCNBD specimen from this new procedure of slice synthesis method with small corrections using an empirical factor. This procedure has a better precision for a wider range of geometric parameters. In the following, the same procedure is used for the CCNSCB specimen. Eq. (1) has been proposed for a crack, while, as shown in Fig. 11, only the central part of the specimen that is formed due to the crack growth is a real crack. If the stress intensity factor of the central part is considered as KI, the stress intensity factor of two lateral chevron parts that are not real cracks has a lower value than KI. A reduction factor for the slices other than the central part could be introduced as KI central slice K I′ =  (3) KI β other slices where β as an empirical factor has a value greater than one and depends on the chevron geometry. Since each slices is considered as straight-through cracked specimen, the following relation that suggested for the SCB with straight crack was used to determine the fracture toughness of each slice (Kuruppu et al., 2014) Pmax π a K Ic = YI (a R , S R ), 2 RB (4) −1.297 + 9.516α − (0.47 + 16.457( S / R ))α + (1.071 + 34.401( S / R ))α 2 , YI = where YI is the normalized mode-I stress intensity factor that depends on the crack length and the span ratio. Using Eq. (1), Eq. (3), and Eq. (4) and summing up the loads applied on each slice, the total load can be obtained based on the equilibrium principle as N K I .(2 R.∆t ) ∑β K I .2 Rb =P + , (5) π a YI (α ) i =1 π a YI (α i ) where Δt and N are the thickness of each slice and the number of slices, respectively. YI is the dimensionless stress intensity factor of the SCB with straight crack and αi=ai/R where ai is the crack length of ith slice. The thickness of the central part of specimen is as follows =b 2 R ( α s2 − α 02 − α s2 − α 2 ). (6) The thickness, Δt and the normalized crack length αi of each slice could also be calculated as follows  B −b ∆t = N ,  (7) α = α 2 − ( α 2 − α 2 − b − i.∆t ) 2 ,  i s s 0 2R R where i is the slice number from the center of the specimen apart of the central part having the flat notch. For the CCNSCB specimen that divided into N slices in two chevron parts (as shown in Fig. 8), the following relation for the stress intensity factor can be written based upon the equilibrium principle
  8. 242 −1  2b B N /2 4. ∆t B  =Y  * +∑  , (8)  πα YI (α ) i =1 β πα i .YI (α i )  where Δt is the thickness of each slice, b is the thickness of central part, and αi is the dimensionless crack length of ith slice. 𝑩 𝒃 𝒂𝒊 𝜟𝒕 Fig. 8. Slice synthesis method for CCNSCB specimen The empirical value of β, expressing the difference between the stress intensity factor of the central part and the lateral sections of a chevron notched specimen was proposed as follows (Wang 2004): α1 − α (9) β = 1+ γ αB Employing three-dimensional finite element analysis of the CCNSCB specimen in mode-I loading and using the SSM for a similar SCB specimen and then comparing the results, the coefficient γ was estimated as 0.85. The minimum value of Eq. 8 is determined by putting its derivative with respect to α equal to zero. By finding the critical value of dimensionless crack length and putting its value in Eq. 8, one can obtain the minimum dimensionless stress intensity factor. Fig. 9 presents the distribution of dimensionless stress intensity factor with varying α obtained from the finite element analysis and the SSM technique. Shown in this figure is also a comparison between the results of two methods which indicates a reasonable agreement between them. 5.5 5 4.5 FEM αm(FE) αm(SSM) Y* 4 0.22 0.32 0.267 0.277 Y*min(FE)=2.805 Y*min(SSM)=2.793 3.5 3 SSM 2.5 0.1 0.2 0.3 0.4 0.5 0.6 Normalized crack length (α =a/R) Fig. 9. Comparison of results obtained from the FEM and SSM techniques
  9. E. Mahdavi et al. / Engineering Solid Mechanics 3 (2015) 243 In Table 4, discrepancies between the critical value and critical crack length of two methods, i.e., FE and SSM are presented. The high accuracy of results is proved and the FE modeling can be employed successfully to obtain the stress intensity factor of the CCNSCB specimen. Table 4. Values of Y* and critical crack length obtained from FEM and SSM methods Y*min αm FEM 2.805 0.267 SSM 2.793 0.2768 % Discrepancy 0.43% 3.54% 5. Conclusion One of the specimens to determine the fracture toughness of rocks is the semi-circular bend specimen with chevron notch. Stress intensity factor at the crack front is an important parameter to find the fracture toughness. In this paper, a useful technique was used to obtain the dimensionless stress intensity factor of the CCNSCB specimen using finite element modeling. In this analysis, by changing the crack length of the specimen, a relation between the dimensionless stress intensity factor and crack length can be fitted. Then using the relation and finding the minimum value of this relation by setting its derivative to zero, the minimum dimensionless stress intensity factor and the critical crack length can be obtained. The minimum dimensionless stress intensity factor obtained from the FE analysis was then compared with the SSM result. Small discrepancy between two methods demonstrated the good precision of the FE result. References Aliha, M. R. M., Sistaninia, M., Smith, D. J., Pavier, M. J., & Ayatollahi, M. R. (2012). Geometry effects and statistical analysis of mode I fracture in guiting limestone. International Journal of Rock Mechanics and Mining Sciences, 51, 128-135. Aliha, M. R. M., Ayatollahi, M. R., & Akbardoost, J. (2012). Typical upper bound–lower bound mixed mode fracture resistance envelopes for rock material. Rock Mechanics and Rock Engineering, 45(1), 65-74. Aliha, M. R. M., & Ayatollahi, M. R. (2014). Rock fracture toughness study using cracked chevron notched Brazilian disc specimen under pure modes I and II loading–A statistical approach. Theoretical and Applied Fracture Mechanics, 69, 17-25. Akbardoost, J., Ayatollahi, M. R., Aliha, M. R. M., Pavier, M. J., & Smith, D. J. (2014). Size- dependent fracture behavior of Guiting limestone under mixed mode loading. International Journal of Rock Mechanics and Mining Sciences, 71, 369-380. Ayatollahi, M. R., & Aliha, M. R. M. (2008). On the use of Brazilian disc specimen for calculating mixed mode I–II fracture toughness of rock materials. Engineering Fracture Mechanics, 75(16), 4631-4641. Bluhm, J. I. (1975). Slice synthesis of a three dimensional “work of fracture” specimen. Engineering Fracture Mechanics, 7(3), 593-604. Chong, K. P., Kuruppu, M. D., & Kuszmaul, J. S. (1987). Fracture toughness determination of layered materials. Engineering fracture mechanics, 28(1), 43-54. Cui, Z. D., Liu, D. A., An, G. M., Sun, B., Zhou, M., & Cao, F. Q. (2010). A comparison of two ISRM suggested chevron notched specimens for testing mode-I rock fracture toughness. International Journal of Rock Mechanics and Mining Sciences, 47(5), 871-876.
  10. 244 Dai, F., Wei, M. D., Xu, N. W., Zhao, T., & Xu, Y. (2015). Numerical investigation of the progressive fracture mechanisms of four ISRM-suggested specimens for determining the mode I fracture toughness of rocks. Computers and Geotechnics, 69, 424-441. Erarslan, N., & Williams, D. J. (2012). The damage mechanism of rock fatigue and its relationship to the fracture toughness of rocks. International Journal of Rock Mechanics and Mining Sciences, 56, 15-26. Fowell, R. J. (1995, January). Suggested method for determining mode I fracture toughness using cracked chevron notched Brazilian disc (CCNBD) specimens. In International Journal of Rock Mechanics and Mining Sciences & Geomechanics Abstracts (Vol. 32, No. 1, pp. 57-64). Pergamon. Griffith, A. A. (1921). The phenomena of rupture and flow in solids. Philosophical transactions of the royal society of london. Series A, containing papers of a mathematical or physical character, 163- 198. Irwin, G. R. (1957). Analysis of stresses and strains near the end of a crack traversing a Plate. Journal of Applied Mechanics, 24(1), 361-364. Kanninen, M. F., & Popelar, C. H. (1985). Advanced fracture mechanics. Oxford Engineering Science Series (15). Oxford University Press, New York. Kuruppu, M. D., Obara, Y., Ayatollahi, M. R., Chong, K. P., & Funatsu, T. (2015). ISRM-suggested method for determining the mode I static fracture toughness using semi-circular bend specimen. In The ISRM Suggested Methods for Rock Characterization, Testing and Monitoring: 2007-2014 (pp. 107-114). Springer International Publishing. Kuruppu, M. D., & Chong, K. P. (2012). Fracture toughness testing of brittle materials using semi- circular bend (SCB) specimen. Engineering Fracture Mechanics, 91, 133-150. Kuruppu, M. D. (1997). Fracture toughness measurement using chevron notched semi-circular bend specimen. International journal of fracture, 86(4), L33-L38. Ouchterlony, F. (1988). ISRM suggested methods for determining fracture toughness of rocks. International Journal of Rock Mechanics and Mining Sciences & Geomechanics abstracts, 25, 71- 96. Obara, Y., Sasaki, K., & Yoshinaga, T. (2007). Estimation of fracture toughness of rocks under water vapor pressure by Semi-Circular Bend (SCB) test. Journal-Mining and Materials Processing Institute of Japan, 123(4/5), 145. Obara, Y., Sasaki, K., Yoshinaga, T., & Suzuki, Y. (2007, July). Influence of water vapour pressure of surrounding environment on fracture toughness and crack velocity of rocks. In Proceedings of 11th congress of ISRM (Vol. 1, pp. 51-54). Wang, Q. Z., Jia, X. M., & Wu, L. Z. (2004). Wide-range stress intensity factors for the ISRM suggested method using CCNBD specimens for rock fracture toughness tests. International journal of rock mechanics and mining sciences, 41(4), 709-716. Wang, Q. Z. (1998). Stress intensity factors of the ISRM suggested CCNBD specimen used for mode- I fracture toughness determination. International Journal of Rock Mechanics and Mining Sciences, 35(7), 977-982.
ADSENSE

CÓ THỂ BẠN MUỐN DOWNLOAD


Đồng bộ tài khoản
6=>0