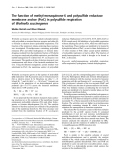
A pH-dependent conformational change in EspA, a component of the Escherichia coli O157:H7 type III secretion system Tomoaki Kato1,2, Daizo Hamada2, Takashi Fukui2, Makoto Hayashi1, Takeshi Honda3, Yoshikatsu Murooka1 and Itaru Yanagihara2
1 Department of Biotechnology, Graduate School of Engineering, Osaka University, Japan 2 Department of Developmental Infectious Diseases, Research Institute, Osaka Medical Center for Maternal and Child Health, Japan 3 Department of Bacterial Infections, Research Institute for Microbial Diseases, Osaka University, Japan
Keywords ANS binding; CD; FT-IR; partially unfolded; sedimentation equilibrium
Correspondence D. Hamada, Department of Developmental Infectious Diseases, Research Institute, Osaka Medical Center for Maternal and Child Health, 840 Murodo, Izumi, Osaka 594-1011, Japan Fax: +81 725 57 3021 Tel: +81 725 56 1220 E-mail: daizo@mch.pref.osaka.jp
(Received 21 September 2004, revised 1 March 2005, accepted 1 April 2005)
doi:10.1111/j.1742-4658.2005.04697.x
pH-Dependent structural changes for Escherichia coli O157:H7 EspA were characterized by CD, 8-anilino-2-naphthyl sulfonic acid (ANS) fluores- cence, and sedimentation equilibrium ultracentrifugation. Far- and near- UV CD spectra, recorded between pH 2.0 and 7.0, indicate that the protein has significant amounts of secondary and tertiary structures. An increase in ANS fluorescence intensity (in the presence of EspA) was observed at aci- dic pH; whereas, no increased ANS fluorescence was observed at pH 7.0. These results suggest the presence of a partially unfolded state. Interest- ingly, urea-induced unfolding transitions, monitored by far-UV CD spectro- scopy, showed that the protein is destabilized at pH 2.0 as compared with EspA at neutral pH. Although increased ANS fluorescence was observed at pH 3.0, the urea-induced unfolding curve is similar to that found at pH 7.0. This result suggests the presence, at pH 3.0, of an ordered, but partially unfolded state, which differs from typical molten globule. The results of analytical ultracentrifugation and infrared spectroscopy indicate that EspA molecules associate at pH 7.0, suggesting the formation of short filamentous oligomers containing a-helical structures, whereas the protein tend to form nonspecific aggregates containing intermolecular b-sheets at pH 2.0. Our experiments indicate that EspA has the potential to spontane- ously form filamentous oligomers at neutral pH; whereas the protein is partially unfolded, assuming different conformations, at acidic pH.
EPEC, such complex structures, which include the pro- teins, EspA, EspB, EspD [7,8], probably permit direct delivery of effector proteins, such as, Tir [9–11], EspF [12,13], EspG [14] and Orf19 [15], into the host cell [16].
Enterohaemorrhagic and enteropathogenic Escherichia coli (EHEC and EPEC, respectively) cause outbreaks of serious diarrhoea. These bacteria express type III secretion systems [1], which consist of various protein components encoded at the locus of enterocyte efface- ment, LEE [2–5]. To date, type III secretion systems have been identified in more than 20 pathogenic bac- terial species [6]. The type III secretion system is a fila- mentous multiprotein complex that assembles across the bacterial and host cell surfaces. For EHEC and
EspA is a major component of this large, transiently expressed, filamentous surface organelle [17,18]. EspA oligomerization may be mediated by interactions between coiled-coil regions of individual EspA mole- falgellin in a manner similar to that of cules [19]
Abbreviations ANS, 8-anilinonaphthalene-1-sulfonic acid; EHEC, enterohaemorrhagic Escherichia coli; EPEC, enteropathogenic Escherichia coli; FT-IR, Fourier transform infrared; LB, Luria–Bertani.
FEBS Journal 272 (2005) 2773–2783 ª 2005 FEBS
2773
T. Kato et al.
pH-Dependent EspA conformational change
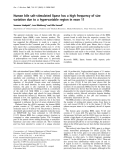
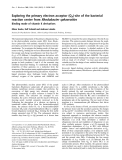
Fig. 1. Secondary structure prediction for EspA based on its amino acid sequence. H and E refer to a-helical and b-strand propensities, respectively.
molecules, which assemble to form flagella filaments [20]. The EspA-containing filamentous apparatus may form a conduit for translocation of bacterial proteins into host cells [21]. Recently, a model of EspA fila- ments has been built based on negative-stain EspA electron micrographs [18]. Interestingly, the model is a helical tube with a diameter of 120 A˚ , enclosing a cen- tral channel of 25 A˚ diameter, and has an axial rise of 4.6 A˚ per subunit. EspA filaments may attach to host cells via an EspB ⁄ D pore-forming complex [22] and the EspB ⁄ D complex may also specifically interact with the host-target protein, a-catenin [23]. Such a super- structure, formed by EspA ⁄ B ⁄ D and a-catenin, facili- tates the delivery of effector proteins into host cells [16].
Although there is information available concerning the roles and structural properties of EspA filaments, to date, the conformation and the thermodynamic properties of EspA have not been characterized.
Recombinant EspA prepared from soluble fractions without unfolding the protein, at pH 7.0 and 20 (cid:1)C, showed a CD spectrum typical of a protein with a significant amount of secondary structure (Fig. 2A). Importantly, the spectrum for the sample prepared by urea-solubilized cells was almost completely super- imposable on the above spectrum. This observation
In this study, we characterized certain conformational and thermodynamic properties of EspA in solution techniques. using spectroscopic and physicochemical Far-UV CD shows that the protein has a substantial amount of secondary structure throughout the pH range of 2.0–7.0. However, an analysis of 8-anilino- 2-naphthyl sulfonic acid (ANS) fluorescence (in the presence of EspA) suggests that a conformational transition occurs between pH 3.0 and 5.0, with expo- sure of hydrophobic protein surfaces. Consistent with this observation, urea-induced EspA unfolding transi- tions, as followed by far-UV CD, indicate that the folded structure is less stable at pH 2.0. A sedimenta- tion equilibrium study shows that EspA forms oligo- mers at pH 7.0, indicating an ability by EspA to form filamentous structures. The data now reported suggest that EspA, at near physiological conditions, assumes short filamentous oligomers, but dissociates into parti- ally unfolded species at acidic pH.
Results
CD
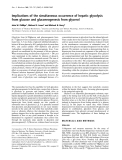
Fig. 2. CD spectra of EspA at various pH values. (A) Far- and (B) near-UV CD spectra at pH 2.0 (broken line), pH 3.0 (dotted line), and pH 7.0 (continuous line). Circles indicate the spectrum at pH 7.0 for recombinant EspA prepared from soluble fraction of cell lysate. (C) Plot of ellipticity at 222 nm vs. pH.
The secondary structure prediction for EspA, based on its amino acid sequence, suggests that the protein is predominantly a-helical in conformation (Fig. 1). The secondary structures of the recombinant EspA pre- pared here were analysed by far-UV CD spectra. In this study, the recombinant EspA protein was prepared under either native or denaturing conditions. To clarify whether both preparations yielded protein with similar propertiees, we first compared the CD spectra of EspA prepared under the different conditions.
FEBS Journal 272 (2005) 2773–2783 ª 2005 FEBS
2774
T. Kato et al.
pH-Dependent EspA conformational change
suggests that our preparation of recombinant EspA using urea, which included unfolding and refolding steps was successful, and that this protein reversibly unfolds and refolds, at least under the controlled con- ditions used here.
The ellipticity at 222 nm for EspA at pH 7.0 was )13 600 degÆcm2Ædmol)1. This ellipticity value yields an a-helical content of 37.2% when used in the equation:
7.0. Interestingly, when the solution pH was between 3.0 and 7.0, the spectra are almost identical and the derived secondary structure estimates are similar to each other (Fig. 2C and Table 1). The pH 2.0 spec- trum also indicates a significant amount of secondary structure, although the spectral intensity is smaller than those obtained at higher pH. This observation suggests that at pH 2.0 EspA is less ordered than at pH 3.0–7.0.
fH ¼ (cid:1)ð½h(cid:2)222 þ 2340Þ=30300
ANS binding
where fH and [h]222 are the a-helical fraction and the ellipticity at 222 nm, respectively [24]. This value, derived from the pH 7.0 CD spectrum, is smaller than that estimated from the secondary structure prediction using the amino acid sequence (62.0% and 8.3% for a-helices and b-sheets, respectively, Table 1). The sec- ondary structure contents, estimated by the program CDPro, are 39.6% and 13.6% for a-helices and b-sheets, respectively. This a-helical value is also smal- ler than that predicted using the amino acid sequence (62.0% and 8.3% for a-helices and b-sheets, respect- ively, Table 1).
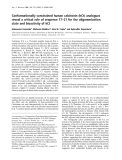
ANS binds to solvent-accessible hydrophobic surfaces and when bound its fluorescence intensity at (cid:3) 500 nm increases. This property of ANS is often used to detect partially unfolded protein intermediates [25], e.g. mol- ten globules, which are compact intermediates with significant amounts of native-like secondary structure, but with disordered tertiary contacts and solvent- exposed hydrophobic clusters [26–34]. To determine if partially unfolded EspA species are present as a result of solution conditions, we recorded ANS fluorescence spectra, with EspA present at various pH conditions.
Between pH 6.0 and 9.0 the ANS fluorescence was insignificant (Fig. 3), suggesting that negligible amounts of hydrophobic surfaces are solvent-accessible However, ANS fluorescence increased when the pH decreased from 6.0 to 2.0 (Fig. 3). This observation suggests that hydrophobic surfaces become exposed upon decreasing the pH. Since the protein maintains a significant amount of secondary structure (as estimated
Although the intensity is significantly low, the near- UV CD spectrum of EspA at pH 7.0 and 20 (cid:1)C, showed a minimum and a maximum around 280 and 290 nm. As in the case of far-UV CD, the near-UV CD spectrum at pH 2.0 was similar to the spectrum at pH 7.0, although the intensity of each peak bacome slightly smaller. It is in the near-UV region that aro- matic residues display optical activity. EspA contains five tyrosines at positions 22, 51, 53, 110 and 182, and no tryptophans. Therefore, the shape of the near-UV CD spectra of EspA suggests the presence of some ter- tiary contacts around at least one of the tyrosines both at pH 7.0 and 2.0 (Fig. 2B). To gain further insight
into the conformational properties of EspA, we recorded far-UV CD spectra for solutions with the pH adjusted between 2.0 and
Table 1. EspA Secondary structure composition at various pH val- ues as estimated using the far-UV CD spectral data. Values were calculated using CDPro [44,45].
Conditions
a-Helix (%) b-Sheet (%) Turn (%) Others (%)
32.6 ± 3.0 40.9 ± 6.9 39.8 ± 8.1 39.6 ± 7.1
16.1 ± 2.4 12.0 ± 4.1 13.0 ± 1.1 13.6 ± 5.2
pH 2.0 pH 3.0 pH 5.0 pH 7.0 Predicted valuesa 62.0
8.3
21.9 ± 0.9 29.9 ± 0.4 19.6 ± 2.1 29.1 ± 2.0 19.0 ± 2.0 28.5 ± 1.0 19.7 ± 1.7 27.6 ± 0.4 29.7b
Fig. 3. ANS fluorescence at 460 nm as a function of pH. Circles indicate the raw data. The line is drawn only to assist the reader and has no theoretical relevance. The approximated baselines for NII and NI (see text in detail) are shown by dotted and broken lines, respectively.
a Estimated from the secondary structure prediction (Fig. 1) using the PHDSEC algorithm available at the PREDICTPROTEIN server [46–48]. b The value is for non-a-helical and non-b-strand regions.
FEBS Journal 272 (2005) 2773–2783 ª 2005 FEBS
2775
T. Kato et al.
pH-Dependent EspA conformational change
from far-UV CD spectra between pH 2.0 and 5.0, Fig. 2), the results of the ANS study suggest formation of a partially unfolded state, possibly similar to the a-lactalbumin molten globule characterized at acidic pH [34].
Sedimentation equilibrium
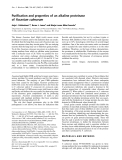
correlation between ln(A280) and r2. However, the data (Fig. 4A) indicate that ln(A280) exponentially increases with increased r2. This sedimentation equilibrium pro- file indicates either the presence of large protein oligo- mers or a contribution to the plot by nonideal solution behaviour. Probably, the solution behaves as an ideal system under the experimental conditions, i.e., 10 mm sodium phosphate, pH 7.0, 100 mm NaCl. Thus, it is unlikely that the curvature shown in Fig. 4A is caused by nonideal behaviour. Figure 4B shows
Under physiological conditions, during EHEC or EPEC infection, EspA is associated with filamentous structures. We therefore tested, using sedimentation equilibrium ultracentrifugation, whether recombinant EspA has the potential to form oligomers.
that Mapp increases with an increase in the concentration of EspA. The data of Fig. 4B suggest that the size distribution of EspA ran- ges from that of the monomer to approximately that of a 30-mer when the protein concentration is 1 mgÆmL)1, i.e. 44 lm.
Figure 4 shows the results for the EspA sedimenta- tion equilibrium experiments at pH 7.0 and 20 (cid:1)C. If a protein solution contains only a single molecular weight species, then a plot of the natural logarithm of the protein absorption at 280 nm [ln(A280)] vs. the the radial distance (r2) shows a linear square of
We also attempted to analyse the sedimentation pro- file of the partially unfolded state that exists at pH 2.0. However, it was extremely difficult to obtain the exact size of protein at pH 2.0 probably due to the forma- tion of irreversible aggregates during the long period of centrifugation. Although no visible precipitates were found at the beginning, protein absorption started to decrease after about 24 h, and become almost unde- tectable after 48 h. This may be caused by the require- ment of high protein concentration (> 1 mgÆmL)1) due to the lack of tryptophan residues in EspA for reliable detection as well as the need for a long equilibration period (> 24 h) essential for the sedimentation equilib- rium study. The result is, however, consistent with the idea that the protein is partially unfolded at pH 2.0, because partially unfolded species are generally prone to form nonspecific aggregates (see below). Thus, com- pared with other simple spectroscopic measurements such as CD, ultracentrifugation may generally not be suitable for the analysis of partially folded proteins which are prone to aggregate.
FT-IR spectroscopy
The previous sedimentation equilibrium study indica- ted that after a long incubation at pH 2.0 the EspA solution contains aggregates, although these are invis- ible just after preparation of the sample. FT-IR spectro- scopy also confirmed the presence of molecular species containing intermolecular b-strands typical for nonspecific aggregates.
Fig. 4. Sedimentation equilibrium. (A) Plot of the logarithm of the absorbance at 280 nm, A280, as a function of the square of the radial distance, r2. Data were collected at pH 7.0 with 1.0 mgÆmL)1 EspA. (B) Plot of Mapp vs. protein concentration.
As indicated by CD, the soluble EspA at pH 7.0 shows an IR spectrum suggestive of the formation of a-helical structures with a peak around 1650 cm)1 (Fig. 5). However, the spectrum taken for the solution at pH 2.0 has an additional maximum peak around 1620 cm)1 which is characteristic for the intermole-
FEBS Journal 272 (2005) 2773–2783 ª 2005 FEBS
2776
T. Kato et al.
pH-Dependent EspA conformational change
Fig. 5. FT-IR spectroscopy of EspA. The spectra at pH 2.0 (broken line), aggregates formed at pH 7.0 (dotted line), and soluble fraction at pH 7.0 (continuous line).
Fig. 6. Urea-induced EspA unfolding transitions at various pH val- ues, 20 (cid:1)C. The transition curves are obtained from far-UV CD spectra at pH 2.0 (triangles), pH 3.0 (squares) and pH 7.0 (circles). The approximated baselines for folded (NI or NII) and unfolded states are drawn by dotted and broken lines, respectively, The ideal ellipticity for 50% of folded or unfolded species is shown by a thin line.
cular b-sheets usually formed in the nonspecific aggre- gates.
conformational state is clearly distinguishable from the typical molten globule formed by EspA at pH 2.0.
Discussion
pH-dependence of EspA conformations
Importantly, precipitates are also formed at pH 7.0 in the presence of EspA > 1 mgÆmL)1. The IR spec- trum for these aggregates, however, is significantly similar to the spectrum taken for the soluble EspA (Fig. 5). This observation suggests that EspA has an intrinsic potential to self-associate into oligomeric structures, which consist of a-helical secondary struc- tures.
Urea-induced unfolding
surface
The present analysis suggests that the amount of EspA secondary structure, at various pH conditions, is highly conserved, even at pH 2.0. However, ANS bind- ing experiments indicate that a conformational change occurred upon decreasing pH. The characteristics of this conformational change are consistent with the for- mation of a partially unfolded species, probably sim- ilar to a molten globule. Molten globules are compact denatured states with significant amounts of native-like secondary structure, but with disrupted tertiary inter- actions [26–34]. Although peak intensity is slightly dif- ferent, the near-UV CD spectrum at pH 7.0 is closely similar to that at pH 2.0 (Fig. 2B). This is apparently inconsistent with the idea that the conformational spe- cies of EspA at pH 2.0 is in a typical molten globule state. In this sense, the partially unfolded structure at pH 2.0, which exposes hydrophobic clusters to the sol- vent, may contain rather rigid tertiary conformation compared with the classical molten globule state. It should be noted that the urea-induced denaturation data indicated a decreased stability and cooperativity against urea-induced unfolding for EspA at pH 2.0 compared with that at pH 7.0. This suggests that transitions may occur around some conformational
The stability of EspA at various pH values was ana- lysed using far-UV CD spectroscopy. By plotting the ellipticity at 222 nm as a function of urea concentra- tion, cooperative unfolding transitions were obtained at all pH values (Fig. 6). Between pH 3.0 and 7.0, the transitions occurred between 3.0 and 6.0 m urea. How- ever, the transition region shifted towards lower urea concentrations of about 0.0–3.0 m at pH 2.0. This observation is qualitatively consistent with the ANS the protein, at binding results, which show that pH 2.0, assumes a partially unfolded conformation with exposed hydrophobic surfaces. Interestingly, the stability of the protein at pH 3.0 seems comparable to that at pH 7.0. This observation would seem to be inconsistent with the pH 3.0 ANS binding experiment as that experiment indicates a degree of unfolding resulting in hydrophobic solvent-exposure. Therefore, between pH 3 and 5, a partially unfolded state with highly ordered native-like tertiary contacts, but also with fluctuating regions, may exist. This
FEBS Journal 272 (2005) 2773–2783 ª 2005 FEBS
2777
T. Kato et al.
pH-Dependent EspA conformational change
pH 2.0–3.0. Importantly, at pH 2.0, the ellipticity at 222 nm decreased compared with the value at pH 3.0– 7.0. Thus, some of the a-helical structure formed at pH 3.0–7.0 may be disrupted at pH 2.0, whereas ter- tiary contacts, at least, around one of the tyrosine resi- dues are conserved.
partial unfolding. One possible explanation, reconciling this discrepancy, is that, unlike the traditional molten globule, EspA maintains a well-ordered native-like domain, but also has less structured regions with exposed hydrophobic patches at pH 3.0. We designate this conformational state, NII, the native structure at acidic pH, which has a distinctive character compared with the native conformation at neutral pH (NI). Thus, the conformational change of EspA, associated with changing pH, can be schematically represented as in Scheme 1:
pH 2:0
5:0–7:0
3:0 IA … NII … NI
The evidence suggests that the partially folded state at pH 2.0 may have native-like tertiary contacts but a lower a-helical structures content compared with NI and NII. It is now designated as IA, i.e. acid-induced intermediate structure.
In an attempt to understand how pH and urea con- centration affect the conformations of EspA, we con- structed an EspA pseudo phase diagram with urea concentration as a function of pH (Fig. 7), according to Scheme 1. For ANS binding (Fig. 3), the ANS transition midpoint can be considered to be the appar- ent NI to NII transition midpoint, assuming that the maximum ANS intensity in Fig. 3 corresponds to the ANS fluorescence for NI. The urea-induced unfolding transitions, between pH 3.0 and 5.0 (Fig. 6), provide apparent midpoints for the transitions from either NII or NI to the unfolded state (U); whereas, the transition
Recently, the three-dimensional structure of EspA complexed with its chaperone, CesA, has been solved by X-ray crystallography [35]. In this model, only the N-terminal 29 and C-terminal 43 residues (amino acid positions at 31–59 and 148–190) of EspA correspond- ing to the binding interface of CesA could be clearly solved. The other regions corresponding to the amino acid positions between 60 and 147 could not be solved, possibly due to the conformational disorder or mul- tiple conformations. If the unsolved regions in the the EspA–CesA complex structure are disordered, a-helical content of EspA should be 37.5%. This value is highly consistent with the a-helical content estimated here from far-UV CD spectra of EspA at pH 7.0 (39.6%). It is generally considered that the native-like secondary structures are present in the partially folded state of a protein. Thus, it would be natural to assume that the two a-helices of EspA shown in the EspA– CesA complex structures may be also formed in the partially folded state of EspA at pH 2.0. According to the EspA–CesA complex structure, only Y53 forms tertiary contacts with the C-terminal a-helix of EspA and CesA, and other tyrosines located in these a-heli- ces are exposed to the solvent. Therefore, the near-UV CD signals observed at pH 7.0 and 2.0 in Fig. 2B might be responsible for the formation of tertiary con- tacts around Y53. The formation of nonspecific aggre- gates which occurred at pH 2.0 in the presence of high concentration of EspA indicate that the oligomeric EspA at pH 7.0 can tend to dissociate into monomers at pH 2.0 since the oligomerization into native struc- ture should prevent the formation of nonspecific aggre- gates. In this sense, the near-UV CD signal observed at pH 2.0 can be responsible for the intramolecular tertiary contacts around Y53, whereas the signal at pH 7.0 might reflect the intermolecular tertiary con- tacts. However, the information on three-dimensional structure of EspA at different pH, particularly around the amino acids between 60 and 147, which could not be resolved by X-ray crystallography of EspA–CesA complex, is critical to evaluate such a possibility.
Importantly,
Fig. 7. Pseudo phase diagram for EspA: urea concentration vs. pH at 20 (cid:1)C. The boundaries are defined by the ANS binding and the urea-induced unfolding curves shown in Figs 3 and 5. U, Unfolded state; IA, acid-induced intermediate state; NI, native state at neutral pH; NII, native state at acidic pH. The transition midpoints for NI (or NII) to U (circles), IA to U (squares) and NI to NII (triangles) are shown by lines.
the pH 3.0, urea-induced unfolding transition is almost superimposable onto the pH 7.0 transition curve. This observation suggests that the protein, at pH 3.0, is as stable as that at pH 7.0. How- ever, the ANS binding data indicate exposure of hydrophobic surfaces at pH 3.0, probably due to
FEBS Journal 272 (2005) 2773–2783 ª 2005 FEBS
2778
T. Kato et al.
pH-Dependent EspA conformational change
approximately 14 nm. This is significantly shorter than the length of EspA filaments formed on EHEC and EPEC cell surfaces. Therefore, the assistance of addi- tional factors, such as molecular chaperones, may be needed to form longer EspA filaments, or the addi- tional residues present at the N-terminal region of our recombinant protein can destabilize the filaments. Alternatively, time scales longer than those used in our experiments may be necessary for the formation of suf- ficiently long filaments.
midpoint for IA to U is found using the pH 2.0 urea- induced unfolding data. Importantly, since we have no clear information on the transition between NII and NI by the addition of urea due to the spectral similarity between these species, the boundary between NI and U shown around neutral pH may actually correspond to the boundary between NII and U. Also, unfortunately, the experiments reported herein do not provide the boundary between NII and IA. Additional experimenta- tion using, for example, NMR or calorimetry is needed to construct a more complete EspA phase diagram. Although the phase diagram of Fig. 7 is incomplete, it contains sufficient information such that, for a given set of solution conditions, the existing conformational state(s) can probably be identified.
The C-terminal regions (Val138 to Gln181) of two EspA molecules may associate to form coiled-coil structures [19]. These coiled-coils may then associate further, forming oligomers. Based on our data, we pro- pose that the oligomeric native state, found at neutral pH, dissociates at pH 3 into a monomeric native-like state with an ordered N-terminal domain and less structured hydrophobic C-terminal tail.
In summary, we provide, herein, the first study con- cerning the properties of the secondary structure of EspA. EspA is shown to spontaneously associate into oligomeric structures at neutral pH. However, two dis- tinctive partially unfolded species occur at lower pH. Based on these results, a phase diagram, illustrating potential EspA conformational transitions, was con- structed. Additional studies are necessary to character- ize the EspA filamentous structure at the atomic level and to elucidate the thermodynamic requirements for filament formation. Such information should clarify the role of EspA during host cell infection by EPEC and EHEC.
Experimental procedures
Expression and purification of recombinant EspA
The dissociation of oligomers into monomers upon decreasing pH was previously observed for Salmonella strain SJ25 flagellin [36]. In that case, the protein, at acidic pH, assumes a conformation with an associated ellipticity at 222 nm of )3800 deg (cid:1)CÆm-2Ædmol)1. Thus, some residual conformation may be present in monomeric flagellin at acidic pH. It is possible that the structural properties of monomeric flagellin, at acidic pH, are similar to those of molten globules.
Oligomerization
acids with additional amino the 20
The espA gene was amplified from an E. coli O157:H7 cos- mid library (RIMD 0509890, Sakai strain) [42,43] by PCR and PCR product was cloned into pT7 vector. (Novagen, Madison, WI, USA). The650 bp NdeI–SacI fragment con- taining the espA gene was then inserted into the expression vector, pET28a (Novagen). The recombinant EspA has an sequence MGSSHHHHHHSSGLVPRGSH on the N-terminal side of the native sequence. The plasmid pET28a-EspA was transformed into E. coli BL21 (DE3).
that
suggest
Luria–Bertani (LB) broth, supplemented with 50 lgÆmL)1 kanamycin, was inoculated with E. coli BL21 colonies and incubated overnight at 37 (cid:1)C with shaking. A portion of the overnight culture was diluted 100-fold into fresh LB medium and incubated at 37 (cid:1)C with shaking. Protein expression was induced by addition of IPTG (at concentra- tions up to 1 mm) when the cultures reached an optical density of 0.5 at 600 nm.
located in insoluble
After 3 h of further shaking at 37 (cid:1)C, the cells were harvested by centrifugation at 6000 g for 20 min at 4 (cid:1)C and the pellet was placed on ice for 15 min. Most expressed EspA are fractions. However, some EspA are also present in the soluble frac- tion. Therefore, we prepared the recombinant EspA from total cell solubilized by urea or from only soluble frac- tions.
The EspA filamentous superstructure has been ana- lysed by electron microscopy [17,18]. It was suggested that other factors, such as molecular chaperones, are required to form an ordered EspA filamentous assem- bly [18]. However, based on our sedimentation equili- brium data, we recombinant EspA spontaneously forms oligomers. For flagellin, several additives, e.g. salts or polyethylenglycoles, are required to induce formation of long, ordered filaments [37–41]. Unfortunately, we were unable to produce long EspA filaments even when such additives were present (data not shown). The results of the sedimentation equili- brium experiment indicate that the largest oligomer formed by the recombinant protein is approximately a 30-mer. According to the model derived from electron microscopy, an axial rise for one filament is 4.6 A˚ per subunit [18]. Thus, a 30-mer, formed by recombinant EspA, corresponds to a filament with a length of
FEBS Journal 272 (2005) 2773–2783 ª 2005 FEBS
2779
T. Kato et al.
pH-Dependent EspA conformational change
data were expressed as mean residue ellipticity, [h], where [h] is defined as [h] ¼ 100 hobs (c · l))1, hobs is the observed intensity, c is the concentration in residue moles per litre, and l is the path length in cm. The secondary structure composition of EspA was estimated using the program package CDPro [44,45]. Reported values are the average of the results obtained from three independent programs: con- tinll, selcon3 and cdsstr, according to the instruction of cdpro program package. The [h] values between 200 and 250 nm with an interval of 0.2 nm taken at different pH were directly used for input data.
For preparation of EspA from urea-solubilized total cells, the cells were resuspended in 100 mm sodium phos- phate, pH 8.0, 10 mm Tris ⁄ HCl, 8.0 m urea and lysed by sonication. The solution was centrifuged at 10 000 g for 30 min at 4 (cid:1)C to separate the soluble and pellet fractions. The soluble fraction was diluted drop-wise 100-fold into 50 mm sodium phosphate, pH 8.0, 300 mm NaCl, 10 mm imidazole at 4 (cid:1)C. The solution was loaded onto Ni–NTA agarose (Qiagen, Valencia, CA, USA) and eluted using a 0–0.5-m imidazole gradient. The eluted EspA was dialysed against 50 mm sodium phosphate pH 8.0, 300 mm NaCl, 10 mm imidazole and rechromatographed over Ni–NTA agarose. Eluted EspA was concentrated by ultrafiltration using a YM10 filter (Millipore, Billerica, MA, USA) and then dialysed against 10 mm sodium phosphate pH 7.0. Protein solutions were stored at )20 (cid:1)C.
The urea-induced unfolding curves were obtained by plotting the ellipticity at 222 nm against urea concentration. To estimate the urea concentration of midpoint of the unfolding reaction (Cm), the baseline for folded and unfol- ded species are approximated from the plateau regions of pre- and post-transition, respectively. The data were ana- lysed according to the assumption of two-state transition between a native and an unfolded state. However, we should stress here that this analysis should be incorrect because various oligomeric forms are present among native conformers. However, without any data about the propor- tion of each native oligmer, this treatment is the only the probable and most conventional method to estimate Cm values without any bias. The details in the analysis and the parameters for unfolding are available as supplementary material in Table S1.
Fluorescence spectrum
For purification from the soluble fraction, cells collected by centrifugation were resuspended in 50 mm sodium phosphate pH 8.0, 300 mm NaCl, 10 mm imidazole. Lyso- zyme (1 mgÆmL)1 final concentration) was added, and the solution was incubated at 4 (cid:1)C for 30 min. RibonucleaseA and dideoxynuclease I (10 and 5 lgÆmL)1 final concentra- tions, respectively) were then added. Incubation was con- tinued at 4 (cid:1)C for a further 15 min. The solution was cleared by centrifugation at 10 000 g at 4 (cid:1)C for 30 min. The supernatant was applied to Ni–NTA agarose equili- brated with 50 mm sodium phosphate pH 8.0, 300 mm NaCl, 20 mm imidazole, and washed with the same buffer. The recombinant EspA was eluted with 50 mm sodium phosphate pH 8.0, 300 mm NaCl, 250 mm imidazole. The eluted protein was dialysed against, 50 mm sodium phos- phate pH 8.0, 300 mm NaCl, 10 mm imidazole, and puri- fied again by Ni–NTA agarose.
ANS fluorescence spectra were recorded using a FP-777 fluorimeter (Jasco). The excitation wavelength was 350 nm and fluorescence emission spectra were recorded between 400 and 650 nm. The protein concentration was 0.1 mgÆmL)1 (4.4 lm) and the ANS concentration was 5 lm. The temperature was kept at 20 (cid:1)C using a Peltier-type thermostatically controlled cell holder.
Sedimentation equilibrium
The purity of the recombinant protein was checked by SDS ⁄ PAGE, which provided a single band around mole- cular weight of 20 kDa, a value consistent with calculated molecular weight of recombinant EspA. About 1 mg of EspA were purified from 1 L culture by urea-solubilization procedure, whereas only 0.1 mg of protein could purified without solubilization by urea.
CD spectroscopy
for Sedimentation equilibrium experiments were performed using a Beckman Optima XL-I analytical ultracentrifuge (Fullerton, CA, USA) operated at 15 000 r.p.m., 20 (cid:1)C. Various amounts of protein were dissolved in 20 mm sodium phosphate pH 7.0, 100 mm NaCl. Using the pro- gram, AA comp (RASMB web site: http://www.rasmb. bbri.org/rasmb/mac/aa_comp-stafford), in conjunction with the EspA amino acid composition, the partial specific vol- ume of EspA was calculated as 0.731. The apparent molecular weight (Mapp) was estimated according to the fol- lowing equation:
FEBS Journal 272 (2005) 2773–2783 ª 2005 FEBS
2780
ð1Þ Mapp ¼ 2RT ð1 (cid:1) tqÞx2 d lnðCÞ dðr2Þ CD spectra were recorded using a J-600 spectropolarimeter (Jasco, Tokyo, Japan). The temperature was adjusted to 20 (cid:1)C using a thermostatically controlled cell holder con- nected to a circulating water bath. For far- and near- UV CD spectra, cells of 1 mm and 1 cm path length were used, respectively. Protein concentrations were 0.1 and 1 mgÆmL)1 far- and near-UV CD measurements, respectively. The samples were prepared about 12 h before the measurements and the measurements were completed within 24 h after preparation of samples. The sample pH was checked by pH electrode, Horiba compact pH meter, B-212 (Horiba, Kyoto, Japan) after each measurement. The
T. Kato et al.
pH-Dependent EspA conformational change
rhagic Escherichia coli O157: H7. Infect Immun 66, 3810–3817. 5 Zhu C, Agin TS, Elliott SJ, Johnson LA, Thate TE, where R is the gas constant, T is the absolute temperature, x is the angular velocity, q is the solvent density and c is the protein concentration at the radial distance r.
FT-IR
Kaper JB & Boedeker EC (2001) Complete nucleotide sequence and analysis of the Locus of Enterocyte efface- mant from rabbit diarrheagenic Escherichia coli RDEC- 1. Infect Immun 69, 2107–2115. 6 Shuch R & Maurelli AT (2000) The type III secretion
pathway. Dictating the outcome of bacterial–host inter- actions. In Virulence Mechanisms of Bacterial Pathogens (Brogden KA, Roth JA, Stanton TB, Bolin CA, Minion FC & Wannemuehler MJ, eds), 3rd edn. ASM Press, American Society for Microbiology, Washington, DC. 7 Clarke SC, Haigh RD, Freestone PP & Williams PH
(2003) Virulence of enteropathogenic Escherichia coli, a global pathogen. Clin Microbiol Rev 16, 65–78. 8 Roe AJ, Hoey DE & Gally DL (2003) Regulation,
secretion and activity of type III-secreted proteins of enterohaemorrhagic Escherichia coli O157. Biochem Soc Trans 31, 98–103. 9 Kenny B, DeVinney R, Stein M, Reinscheid DJ, Frey separating
EA & Finlay BB (1997) Enteropathogenic E. coli (EPEC) transfers its receptor for intimate adherence into mammalian cells. Cell 91, 511–520.
Infrared spectra were recorded using Avatar 370 (Thermo Nicolet Co., Madison, WI, USA) under continuous purge with dry nitrogen gas. Normal spectral resolution used was 2 cm)1. The spectra of 128 scans were averaged. A Happ–Genzel apodization function was applied before Fourier transformation. The samples were transferred to an IR sample cell consisting of a pair of CaF2 windows separated by a 15-lm spacer. FT-IR measurements were carried out at room temperature. Recombinant protein (5 mg) dissolved in 5 mL 10 mm sodium phosphate was lyophilized and resuspended in 200 lL 10 mm sodium phosphate ⁄ 2H2O at pH 7.0 or 2H2O at pH 2.0. At pH 7.0, visible precipitates were found in the solution. The spectra of soluble and insoluble fractions were individually taken after centrifugation at each fraction by 13 000 g at 4 (cid:1)C for 20 min. The concentration of soluble EspA at pH 7.0 was 1 mgÆmL)1 estimated by UV absorp- tion spectrum. At pH 2.0, no visible precipitates were found. Thus, the concentration of EspA is considered to be 10 mgÆmL)1. However, the presence of some aggregated species was obvious from the FT-IR spectrum as discussed in the text.
10 Vlademir VC, Takahashi A, Yanagihara I, Akeda Y, Imura K, Kodama T, Kono G, Sato Y & Honda T (2001) Talin, a host cell protein, interacts directly with the translocated intimin receptor, Tir, of enteropatho- genic Escherichia coli, and is essential for pedestal for- mation. Cell Microbiol 3, 745–751.
Acknowledgements
11 Vlademir VC, Takahashi A, Yanagihara I, Akeda Y,
Imura K, Kodama T, Kono G, Sato Y, Iida T & Honda T (2002) Cortactin is necessary for F-actin accumulation in pedestal structure induced by enteropathogenic Eschericha coli infection. Infect Immun 70, 2206–2209. 12 Crane JK, McNamara BP & Donnenberg MS (2001)
We thank Prof Yuji Goto for the use of the CD spec- trometer and Miyo Sakai for performing the ultracen- trifugation experiments. This work was supported in part by grants-in-aid for scientific research from the Japan Ministry of Education, Culture, Sports, Science and Technology (MEXT).
Role of EspF in host cell death induced by enteropathogenic Escherichia coli. Cell Microbiol 3, 197–211.
References
1 Galan JE & Collmer A (1999) Type III secretion
13 McNamara BP & Donnenberg MS (1998) A novel pro- line-rich protein, EspF, is secreted from enteropatho- genic Escherichia coli via the type III export pathway. FEMS Microbiol Lett 166, 71–78. machines: bacterial devices for protein delivery into host cells. Science 284, 1322–1328. 2 McDaniel TK, Jarvis KG, Donnenberg MS & Kaper
JB (1995) A genetic locus of enterocyte effacement con- served among diverse enterobactrial pathogens. Proc Natl Acad Sci USA 92, 1664–1668. 14 Elliott SJ, Krejany EO, Mellies JL, Robins-Browne RM, Sasakawa C & Kaper JB (2001) EspG, a novel type III system-secreted protein from enteropathogenic Escherichia coli with similarities to VirA of Shigella flex- neri. Infect Immun 69, 4027–4033. 15 Kenny B & Jepson M (2000) Targeting of an entero-
3 McDaniel TK & Kaper JB (1997) A cloned pathogeni- city island from enteropathogenic Escherichia coli con- fers the attaching and effacing phenotype on K-12 E. coli. Mol Microbiol 23, 399–407. pathogenic Escherichia coli (EPEC) effector protein to host mitochondria. Cell Microbiol 2, 579–590. 16 Nougayre` de J-P, Fernandes PJ & Donnenberg MS
FEBS Journal 272 (2005) 2773–2783 ª 2005 FEBS
2781
(2003) Adhesion of enteropathogenic Escherichia coli to host cells. Cell Microbiol 5, 359–372. 4 Perna NT, Mayhew GF, Po´ sfai G, Eliott SJ, Donnen- berg MS, Kaper JB & Blattner FR (1998) Molecular evolution of a pathogenicity island from enterohemor-
T. Kato et al.
pH-Dependent EspA conformational change
31 Creighton TE (1997) How important is the molten glob- ule for correct protein folding? Trends Biochem Sci 22, 6–10. 32 Kuwajima K (1989) The molten globule state as a clue
17 Sekiya K, Ohishi M, Ogino T, Tamano K, Sasakawa C & Abe A (2001) Supermolecular structure of the enteropathogenic Escherichia coli type III secretion system and its direct interaction with the EspA-sheath- like structure. Proc Natl Acad Sci USA 98, 11638– 11643. for understanding the folding and cooperativity of glob- ular-protein structure. Proteins 6, 87–103. 33 Kuwajima K (1992) Protein folding in vitro. Curr Opin Biotechnol 3, 462–467. 34 Kuwajima K (1996) The molten globule state of a-lact- 18 Daniell SJ, Kocsis E, Morris E, Knutton S, Booy FP & Frankel G (2003) 3D structure of EspA filaments from enteropathogenic Escherichia coli. Mol Microbiol 49, 301–308. albumin. FASEB J 10, 102–109. 19 Delahay RM, Knutton S, Shaw RK, Hartland EL,
35 Yip CK, Finlay BB & Strynadka NCJ (2005) Structural characterization of a type III secretion system filament protein in complex with its chaperone. Nature Struct Mol Biol 12, 75–81. Pallen MJ & Frankel G (1999) The coiled-coil domain of EspA is essential for the assembly of the type III secretion translocon on the surface of enteropathogenic Escherichia coli. J Biol Chem 274, 35969–35974.
36 Uratani Y, Asakura S & Imahori K (1972) A circular dichroism study of Salmonella flagellin: evidence for conformational change on polymerization. J Mol Biol 67, 85–98. 37 Novikov VV, Metlina AL & Poglazov BF (1994) A 20 Hyman HC & Trachtenberg S (1991) Point mutations that lock Salmonella typhimurium flagellar filaments in the straight right-handed and left-handed forms and their relation to filament superhelicity. J Mol Biol 220, 79–88. 21 Knutton S, Rosenshine I, Pallen MJ, Nisan I, Neves study on the mechanism of polymerisation of Bacillus brevis flagellin. Biochem Mol Biol Int 33, 723–728. 38 Abram D & Koffler M (1964) In vitro formation of
flagella-like filaments and other structures from flagellin. J Mol Biol 116, 168–185. 39 Asakura S, Eguchi G & Iino T (1966) Salmonella BC, Bain C, Wolff C, Dougan G & Frankel G (1998) A novel EspA-associated surface organelle of enteropatho- genic Escherichia coli involved in protein translocation into epithelial cells. EMBO J 17, 2166–2176.
flagella: in vitro reconstruction and over-all shapes of flagellar filaments. J Mol Biol 16, 302–316. 40 Asakura S, Eguchi G & Iino T (1964) Reconstitution of bacterial flagella in vitro. J Mol Biol 10, 42–56. 41 Wakabayashi K, Hotani H & Asakura S (1969) Poly- 22 Ide T, Laarmann S, Greune L, Schillers H, Oberleithner H & Schmidt MA (2001) Characterization of transloca- tion pores inserted into plasma membranes by type III- secreted Esp proteins of enteropathogenic Escherichia coli. Cell Microbiol 3, 669–679.
merization of Salmonella flagellin in the presence of high concentrations of salts. Biochim Biophys Acta 175, 195– 203. 23 Kodama T, Akeda Y, Kono G, Takahashi A, Imura K, Iida T & Honda T (2002) The EspB protein of entero- haemorrhagic Escherichia coli interacts directly with a-catenin. Cell Microbiol 4, 213–222.
24 Chen Y-H, Yang JT & Martinez HM (1972) Determina- tion of the secondary structures of proteins by circular dichroism and optical rotatory dispersion. Biochemistry 11, 4120–4131.
42 Hayashi T, Makino K, Ohnishi M, Kurokawa K, Ishii K, Yokoyama K, Han CG, Ohtsubo E, Nakayama K, Murata T, Tanaka M, Tobe T, Iida T, Takami H, Honda T, Sasakawa C, Ogasawara N, Yasunaga T, Kuhara S, Shiba T, Hattori M & Shinagawa H (2001) Complete genome sequence of enterohemorrhagic Escherichia coli O157: H7 and genomic comparison with a laboratory strain K-12. DNA Res 8, 11–22. 25 Semisotnov GV, Rodionova NA, Kutyshenko VP, Ebert B, Blanck J & Ptitsyn OB (1987) Sequential mechanism of refolding of carbonic anhydrase B. FEBS Lett 224, 9–13.
26 Ohgushi M & Wada A (1983) ‘Molten-globule state’: a compact form of globular proteins with mobile side- chains. FEBS Lett 164, 21–24. 27 Ohgushi M & Wada A (1984) Liquid-like state of side
chains at the intermediate stage of protein denaturation. Adv Biophys 18, 75–90. 28 Ptitsyn OB (1995) How the molten globule became. Trends Biochem Sci 20, 376–379. 43 Perna, NT, Plunkett G, 3rd Burland V, Mau B, Glas- ner JD, Rose DJ, Mayhew GF, Evans PS, Gregor J, Kirkpatrick HA, Posfai G, Hackett J, Klink S, Boutin A, Shao Y, Miller L, Grotbeck EJ, Davis NW, Lim A, Dimalanta ET, Potamousis KD, Apodaca J, Anan- tharaman TS, Lin J, Yen G, Schwartz DC, Welch RA & Blattner FR (2001) Genome sequence of enterohaemorrhagic Escherichia coli O157: H7. Nature 409, 529–533. 29 Ptitsyn OB (1995) Molten globule and protein folding. Adv Protein Chem 47, 83–229. 30 Arai M & Kuwajima K (2000) Role of the molten
FEBS Journal 272 (2005) 2773–2783 ª 2005 FEBS
2782
globule state in protein folding. Adv Protein Chem 53, 209–282. 44 Sreerama N & Woody RW (2000) Estimation of protein secondary structure from circular dichroism spectra: comparison of CONTIN, SELCON, and CDSSTR methods with an expanded reference set. Anal Biochem 287, 252–260.
T. Kato et al.
pH-Dependent EspA conformational change
45 Sreerama N, Venyaminov SY & Woody RW (2000) 48 Rost B, Sander C & Schneider R (1994) PHD – an
Automatic Mail Server for Protein Secondary Structure Prediction. CABIOS, 10, 53–60.
Estimation of protein secondary structure from circular dichroism spectra: inclusion of denatured proteins with native proteins in the analysis. Anal Biochem 287, 243– 251.
Supplementary material
46 Rost B & Sander C (1993) Prediction of protein struc- ture at better than 70% accuracy. J Mol Biol 232, 584–599.
47 Rost B & Sander C (1994) Combining evolutionary information and neural networks to predict protein secondary structure. Proteins 19, 55–72.
The following material is available from http://www. blackwellpublishing.com/products/journals/suppmat/EJB/ EJB4697/EJB4697sm.htm Table S1. Cm values and apparent mapp approximated from urea-unfolding curves at different pH.
FEBS Journal 272 (2005) 2773–2783 ª 2005 FEBS
2783