
Research Article
Preclinical Pharmacokinetics Study of R- and S-Enantiomers of the Histone
Deacetylase Inhibitor, AR-42 (NSC 731438), in Rodents
Hao Cheng,
1
Zhiliang Xie,
1
William P. Jones,
1
Xiaohui Tracey Wei,
2
Zhongfa Liu,
1
Dasheng Wang,
1
Samuel K. Kulp,
1
Jiang Wang,
3
Christopher C. Coss,
1
Ching-Shih Chen,
1
Guido Marcucci,
1,3,4,6
Ramiro Garzon,
3,4
Joseph M. Covey,
5
Mitch A. Phelps,
1,3,7
and Kenneth K. Chan
1,3,5,7
Received 17 August 2015; accepted 20 January 2016; published online 4 March 2016
Abstract. AR-42, a new orally bioavailable, potent, hydroxamate-tethered phenylbutyrate class I/IIB
histone deacetylase inhibitor currently is under evaluation in phase 1 and 2 clinical trials and has
demonstrated activity in both hematologic and solid tumor malignancies. This report focuses on the
preclinical characterization of the pharmacokinetics of AR-42 in mice and rats. A high-performance
liquid chromatography–tandem mass spectrometry assay has been developed and applied to the
pharmacokinetic study of the more active stereoisomer, S-AR-42, when administered via intravenous and
oral routes in rodents, including plasma, bone marrow, and spleen pharmacokinetics (PK) in CD2F1 mice
and plasma PK in F344 rats. Oral bioavailability was estimated to be 26 and 100% in mice and rats,
respectively. R-AR-42 was also evaluated intravenously in rats and was shown to display different
pharmacokinetics with a much shorter terminal half-life compared to that of S-AR-42. Renal clearance
was a minor elimination pathway for parental S-AR-42. Oral administration of S-AR-42 to tumor-bearing
mice demonstrated high uptake and exposure of the parent drug in the lymphoid tissues, spleen, and
bone marrow. This is the first report of the pharmacokinetics of this novel agent, which is now in early
phase clinical trials.
KEY WORDS: AR-42; histone deacetylase inhibitor; mouse; pharmacokinetics; rat.
INTRODUCTION
The dynamic balance of DNA acetylation levels in cells,
modulated by histone deacetylase (HDAC) and histone acetyl-
transferases (HATs), is crucial for regulating chromatin structure
and transcriptional dysregulation of genes that are implicated in
controlling either cell cycle progression or pathways regulating
cell differentiation and/or apoptosis (1–5). Evidence has shown
that this epigenetic marking system is associated with inappropri-
ate gene expression in many forms of cancer (3,6,7). Encouraged
by the finding that inhibition of HDAC induces cancer cell
apoptosis (8,9), inhibitors of HDAC have been developed as a
potent and specific strategy for the treatment of solid tumors and
hematological malignancies (1,2,10–12). Several classes of
HDAC inhibitors have been developed including short-chain
fatty acids, such as phenylbutyrate and valproic acid (10); various
hydroxamic acid derivatives such, as SAHA and TSA (4,12,13);
and cyclic tetrapeptides, such as depsipeptide (2,10,14). These
compounds have exhibited in vitro potencies in the mM to nM
range (1,10). Recently, a novel class of hydroxamate-tethered
phenylbutyrate derivatives has been designed and synthesized
with nM HDAC inhibitory activity (13,15–17). One of these
compounds, designated R,S-N-hydroxy-4-(3-methyl-2-
phenylbutyrylamino)-benzamide(R,S-AR-42,OSU-HDAC-42,
NSC 731438) (Fig. 1), exhibited potent cytotoxicity in the NCI 60-
cell line screen with a mean GI
50
of 0.2 μM(7,11,).
AR-42 was shown to increase histone H-4 acetylation
and p21waf1/CIP1 expression and to decrease pAkt in PC-3
prostate carcinoma cells (7). AR-42 also inhibited the growth
of subcutaneous PC-3 xenografts when administered orally to
nude mice (50 mg/kg every other day and 25 mg/kg once
daily) (11). Immunoblotting demonstrated increased histone
H-3 acetylation in tumors from treated mice. More recent
data demonstrates that AR-42 appears to have further unique
activity among other HDAC inhibitors, including downregu-
lation of CD44, IRF4, and c-Myc within multiple myeloma
cells, thus restoring sensitivity to immunomodulatory drug
therapy and to a greater extent than panobinostat, a recently
FDA-approved HDAC inhibitor (19). Another study com-
pared AR-42 to both vorinostat and romidepsin, two other
Hao Cheng and Zhiliang Xie contributed equally to this work.
1
College of Pharmacy, The Ohio State University, 500 W. 12th
Avenue, Columbus, Ohio 43210, USA.
2
Sanofi-Aventis, Malvern, Pennsylvania, USA.
3
Comprehensive Cancer, The Ohio State University, Columbus,
Ohio, USA.
4
College of Medicine, The Ohio State University, Columbus, Ohio,
USA.
5
The National Cancer Institute, Rockville, Maryland, USA.
6
Gehr Family Center For Leukemia Research Hematologist Malignancies
Institute City of Hope, Duarte, CA 90010, USA.
7
To whom correspondence should be addressed. (e-mail:
phelps.32@osu.edu; chan.56@osu.edu)
The AAPS Journal, Vol. 18, No. 3, May 2016 ( #2016)
DOI: 10.1208/s12248-016-9876-3
737 1550-7416/16/0 00-0737/0 #2016 American Association of Pharmaceutical Scientists3

MATERIALS AND METHODS
Materials
Non-formulated S-AR-42 and hesperetin (IS) were
supplied by the Drug Synthesis and Chemistry Branch of
the National Cancer Institute (Bethesda, MD). R-AR-42 was
synthesized as previously described (18). Acetonitrile, meth-
anol, ethyl acetate, and formic acid were of analytical grade
and purchased from Fisher Scientific(Pittsburgh,PA).
Distilled water was purified using an E-pure water purifica-
tion system (Barnstead, Dubuque, IA). Phosphate-buffered
saline (PBS) was obtained from Invitrogen (Grand Island,
NY). CD2F1 mice, F344 rats, mouse plasma, and rat plasma
were purchased from Harlan, Inc. (Indianapolis, IN).
Ketamine, xylazine, heparin sodium (1000 unit/mL), and
saline of medical grade were obtained from The Ohio State
University Wexner Medical Center.
Instruments
ThequantitativeassayforboththeS-andR-
enantiomers of AR-42 was initially developed on a Perkin-
Elmer Sciex API 300 and was later transferred to an Applied
Biosystems (AB Sciex) API 3000 triple quadrupole mass
spectrometer with partial cross-validation of the method.
Both systems were coupled to a Shimadzu HPLC system
(Shimadzu, Columbia, MD) equipped with a CBM-20A
system controller, SIL-20AC temperature-controlled
autosampler, and a CTO-20A column oven.
Preparation of Stock Solutions and Standards
Stock solutions of S-AR-42 and IS, each 1 mg/mL, were
prepared in MeOH and kept at −80°C. By serial dilution of S-
AR-42 stock solution with blank plasma, working standard
solutions at 10, 20, 50, 100, 200, 500, 1000, 2000, 5000, and
10,000 ng/mL were prepared. The working internal standard
solution was prepared by 100-fold dilution of IS stock
solution using methanol. All these working solutions were
prepared on the day of each run and discarded after use.
Sample Preparation Procedure
Ten microliter working standards or working quality
control (QC) solutions were spiked to 90 μL blank plasma
sample to give final concentrations of 0, 1, 2, 5, 10, 20, 50, 100,
200, 500, and 1000 ng/mL. After vortex mixing for 30 s, 10 μL
IS working solution was added, and the samples were vortex
mixed again for 30 s. The samples were extracted by ethyl
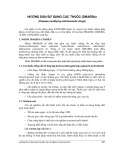
133.23 177.00
Fig. 1. MS/MS spectra of 10 μg/mL AR-42 (left) and internal standard, hesperetin (right). Chemical structures display potential fragmentation
of each compound
738 Cheng et al.
FDA-approved HDAC inhibitors, in two murine cancer ca-
chexia models (20). The data demonstrated that AR-42
significantly improved the preservation of body weight and
prevented tumor burden-induced reductions in lower limb
muscle mass and grip strength when compared to even
maximally tolerated doses of vorinostat and romidepsin.
Critically, AR-42 significantly prolonged survival of cachectic
mice, while the other agents did not. Most importantly, AR-42 is
well tolerated in the clinic relative to other HDAC inhibitors
(21), and it is being actively evaluated in clinical trials for both
solid tumors (clinicaltrials.gov ID, NCT02282917) and hemato-
logic malignancies (NCT01129193, NCT01798901, and
NCT02569320). Because of higher in vivo potency, the S-isomer,
S-N-hydroxy-4-(3-methyl-2-phenylbutyrylamino)-benzamide
(S-AR-42) was selected for preclinical and eventual clinical
development by the National Cancer Institute. This report
describes the preclinical pharmacokinetic characterization of S-
AR-42 in mice and rats along with a limited comparison with R-
AR-42 pharmacokinetics in rats, which provides some explana-
tion for why the S-AR-42 isomer exhibits greater in vivo effects
at reduced doses compared to R-AR-42.

acetate (1000 μL, 30 min) on a mechanical shaker. After
centrifugation at 15,900 g for 1 min, the organic layers were
separated and transferred to a glass tube and concentrated to
dryness with a stream of nitrogen. The residues were
reconstituted in 100 μL reconstitution solution (MeOH/water,
60:40 with 0.2% formic acid) and 20 μL was injected into the
LC-MS system.
Chromatographic Conditions
Separation was carried out at room temperature using
a Thermo Beta Basic C8 column (50 cm × 2.1 mm, 5 μm
particle size, Thermo Hypersil-Keystone, Bellefonte, PA),
which was coupled to a 2-μmprecolumnfilter (Thermo
Hypersil-Keystone, Bellefonte, PA). The isocratic mobile
phase, comprising 60% methanol/40% water/0.2% formic
acid, was delivered to the precolumn at a flow rate of
0.2 mL/min and to the ion source at 10 μL/min after a
95:5 (LC:MS) split. The total run time was 6 min.
Mass Spectrometry
The mass spectrometer was operated using
electrospray ionization (ESI) with an ionspray voltage of
+4200 V. The positive ion multiple-reaction-monitoring
mode analysis was performed using nitrogen as the
collision gas. Nitrogen curtain gas flow and the ionspray
flow were set at 0.6 and 0.9 L/min, respectively. The
pressure in the collision cell was set at 0.29 Pa. The orifice
voltage and ring voltage were set to +50 and +320 V,
respectively. A dwell time of 600 ms and a pause time of
1.2 ms between scans were used to monitor precursor/
product ion pairs of S-AR-42 (m/z313.2–133.2) and IS
(m/z303.2–177.2). The mass spectrometer was tuned daily
to its optimum sensitivity and mass accuracy by infusion
of a standard calibration solution of polypropylene glycol
and a fresh standard solution of S-AR-42 at 5 ng/mL in
the HPLC mobile phase as described above.
Assay Validation Experiments
The within-day and between-day accuracy and precision
were evaluated by analyzing four to six replicates of blank rat
and mouse plasma, mouse urine, and mouse bone marrow
sample sets individually spiked with S-AR-42 or R-AR-42 at
three concentration levels corresponding to QC-low (5 ng/
mL), QC-medium (50 ng/mL), and QC-high (500 ng/mL).
The linearity and reproducibility of the calibration curve and
QCs were evaluated by analysis of plasma, urine, and bone
marrow samples, which were prepared by spiking blank
matrix with the working standard and working internal
standard solutions.
Recovery and matrix effect were evaluated by mea-
suring the ratio of signals obtained from QC samples
prepared and processed as described above (recovery), or
samples where AR-42 was added to dried residue after
processing (post-spiked samples, matrix effect), to mea-
sured signals obtained from QC samples prepared in
reconstitution solution.
Stability
For the short-term stability study, S-AR-42 (500 ng/mL)
in phosphate-buffered saline (PBS) or mouse plasma were
incubated at 4, 24, and 37°C. At the time points of 0, 2, 4, 6, 8,
and 24 h following incubation, aliquots of 10 μL each were
removed and processed for AR-42 analysis. Long-term
stability was evaluated in mouse plasma (10 μg/mL) stored
in 10 μL aliquots at −20°C. At various times over a 22-day
period, aliquots were diluted 100-fold to 100 ng/mL before
processing and analysis.
Plasma Protein Binding
Ultra-filtration was employed to evaluate protein binding
of S-AR-42 in mouse plasma. Briefly, triplicate samples of
mouse plasma containing S-AR-42 at 0.5, 5, and 10 μg/mL
were incubated at 37°C for 1 h. A 0.35 mL aliquot of the
plasma sample from each concentration was loaded into a
Microcon centrifuge filter device (Regenerated Cellulose
30,000 MWCO, Millipore Corporation, Bedford, MA) for
centrifugation at 11,000 g and at 4°C for 50 min. The filters
were then carefully removed, and the clear, protein-free
solution at the bottom of the vial was obtained. Aliquots of
100 μL each were removed and processed for S-AR-42
analysis.
Protein binding was calculated using the following
equation:
Bound %ðÞ¼total drug−free drug
total drug 100
Drug Formulation
For preparation of intravenous (i.v.) dosing solutions in
mice, S-AR-42 was first dissolved in ethanol followed by
addition of twice the volume of PEG 400. Normal saline was
then added to produce the final proportion of ethanol, PEG
400, and saline at a ratio of 12:24:64. For oral (p.o.) dosing,
the total amount of saline was reduced slightly to achieve a
final ratio of ethanol, PEG 400, and saline of 15:30:55. For
rats, the ethanol, PEG 400, and saline ratios were 10:20:70
and 15:20:65 for i.v. and p.o. dosing, respectively.
Pharmacokinetic Study in Mice
All animal studies were conducted using protocols
approved by The Ohio State University Institutional Animal
Care and Use Committee. CD2F1 mice weighing 18–22 g
were used for the pharmacokinetic (PK) study. For i.v.
administration, approximately 100 μL (adjusted by body
weight) dosing solution was administrated via i.v. bolus to
reach a dose of 20 mg/kg per mouse (n= 6 per time point).
For the p.o. administration study, approximately 200 μL
(adjusted by body weight) dosing solution was administrated
via oral bolus to reach a dose of 50 mg/kg per mouse (n=6
per time point). Blood was collected via cardiac puncture at
0.08, 0.25, 0.5, 0.75, 1, 2, 3, 4, 6, 8, 16, 24, 48, and 72 h after
dosing. Blood samples were centrifuged at 1000 g for 5 min,
739Preclinical Pharmacokinetics Study of R- and S-AR-42

and the supernatant of each was collected and kept at −80°C
until analysis.
Pharmacokinetic Study in the Rat
Six F344 rats were given i.v. or p.o. administration at 20
or 50 mg/kg, respectively. The plasma samples were collected
at each time point via a jugular vein catheter. The time points
in this study were 0.08, 0.25, 0.5, 0.75, 1, 2, 3, 4, 6, 8, 16, 24, 48,
and 72 h. The quantification method of these samples is the
same as described above.
Urinary Excretion
Urine was collected from mice (n= 6) and rats (n=6)
housed in metabolic cages. Urine was collected prior to and at
24 h after S-AR-42 treatment (20 mg/kg S-AR-42 via i.v.
bolus administration). Cages were washed using distilled
water, which was collected and combined with the respective
urine samples prior to storage at −80°C.
AR-42 Uptake and Distribution in Mouse Bone Marrow
To determine bone marrow distribution of AR-42, the
human AML MV4-11 cell engrafted immune deficiency mice
were used with oral treatment. Specifically, each of the 23–
25 g NOD/SCID mice (Jackson Laboratory, Bar Harbor, ME,
USA) was engrafted with 0.3 × 10
6
human AML MV4-11 cells
through tail vein on day 0. Engraftments were confirmed
within approximately 2 weeks and prior to dosing for PK
analysis. AR-42 was dissolved in 0.5% methylcellulose and
1% tween-80 as a 4 mg/mL dosing solution. To conduct oral
administration of AR-42 on AML-engrafted mice, 200–
250 μL of dosing solution was administered at a dose of
40 mg/kg according to body weight using gavage on day 17
after the engraftment. Plasma, bone marrow, and spleens
were harvested from the treated mice at the time schedule of
0 (pre-dose), 0.25, 0.5, 1, 2, 3, 4, 6, 8, 16, 24, 48, and 72 h after
dosing (n= 3 mice per time point). All samples were
immediately stored at −80°C until analysis. Concentrations
of standard, QC, and experimental samples were measured
based on measured protein concentration within bone
marrow samples and with the assumptions that protein
content was 20% of total mass of the bone marrow tissue
and that 1 mg tissue equals 1 μL tissue volume.
miR-29b Expression in Bone Marrow
Gene expression of miR-29b in bone marrow and spleen
of AML-engrafted NGS mice were measured at four time
points (12, 24, 48, and 72 h) using real-time PCR with murine
primer/probes for primary-miR-29b-1 as published previously
(22). RT-PCR was performed using cDNA reverse-
transcribed from 1 μg of total RNA extracted from bone
marrow and spleen tissue by TRIzol reagent (Invitrogen)
using the manufacturer-recommended protocol. Real-time
RT-PCR reactions were performed using TaqMan reagents
(Applied Biosystems), and the data were analyzed by version
1.6 software of Sequence Detector. Results that represent the
fold change of transcript levels of miR-29b between these two
tissue samples were expressed as the mean S.D. from
triplicate determinations.
Data Analysis
Plasma concentration-time data were fit using nonlinear
least-squares regression using WinNonlin (V 6.0, Pharsight,
Mountain View, CA) computer software. Model selection was
guided by the Akaike information criteria and standard
errors of estimate. Weighting factors of 1/Y
2
and 1/Yhat were
evaluated.
RESULTS AND DISCUSSION
HPLC-MS/MS Conditions
The electrospray mass spectrum of S-AR-42 indicated
the parent [M+H]
+
ion at m/z313.2 was highly abundant.
When the parent ion was fragmented, the most highly
abundant ion observed was at m/z133.2 (Fig. 1). The
possible structures of observed fragment ions are presented
in Fig. 1. The mass spectrum of the IS demonstrated a parent
ion [M+H]
+
as the base peak at m/z303.2. The product ion
spectrum of the IS revealed m/z177.2 as the most abundant
ion. Thus, the transitions of m/z313.2 > 133.2 for AR-42 and
303.2 > 177.2 for the IS were selected for monitoring.
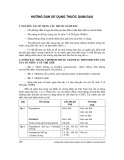
Chromatograms from blank mouse plasma and mouse plasma
with IS (1000 ng/mL) and S-AR-42 (2 ng/mL) are displayed in
Fig. 2and supports the assay selectivity in both mouse and rat
plasma using these transitions. Retention times for S-AR-42
and IS were 3.13 and 2.48 min, respectively. Due to moderate
tailing at higher AR-42 concentrations, the isocratic run time
was kept at 6 min. Peak area ratios of analyte/IS vs. nominal
concentrations were used to generate the calibration curves.
Assay Validation
The initial LC-MS/MS approach indicated negligible
interference in the extracts from either mouse or rat plasma
(Fig. 2). The limit of detection was 1 ng/mL for S-AR-42 with
signal-to-noise ratio >5 using 100 μL mouse or rat plasma and
100 μL reconstituted extract. The lower limit of quantification
(LLOQ) for S-AR-42 was set at 2 ng/mL (6 nM), both in
mouse plasma and rat plasma. Linearity was demonstrated
between the LLOQ to 50 ng/mL (0.16 μM) for low-
concentration samples and from 50 to 1000 ng/mL (3.2 μM)
for high-concentration samples. Table Idisplays within-day
and between-day validation data for both mouse and rat
plasma. Coefficients of variation (CVs) were found to be
within acceptable limits according to the FDA criteria (23).
Variation of accuracy was less than 10% for all means
calculated. Similarly, these data demonstrated adequate
reproducibility and sensitivity of the method to characterize
plasma pharmacokinetics in mice and rats. Similar validation
data was achieved in mouse urine and bone marrow as shown
in Table I. Recoveries were determined to be 99–108% for
mouse plasma, 83–89% for mouse urine, and 97–111% for rat
plasma. Matrix effects were similar at 98–107, 84–94, and 96–
110% for mouse plasma, mouse urine, and rat plasma,
respectively. These data show high recovery and minimal
matrix effect in each of the matrices tested.
740 Cheng et al.

Stability and Protein Binding of S-AR-42 in Mouse Plasma
by LC/MS/MS
S-AR-42 was found to be relatively stable in mouse
plasma at 4°C with an estimated degradation half-life of
122 h. However, at the higher temperatures tested, plasma S-
AR-42 concentrations declined monoexponentially and de-
graded with half-lives of 11.5 and 5.8 h at 24 and 37°C,
respectively. Little or no degradation was observed in PBS
buffer, even at 37°C. At −20°C, S-AR-42 was stable in mouse
plasma with no apparent decomposition over 22 days. Similar
results were observed in rat plasma. S-AR-42 was highly
RT: 0.00 - 6.00 SM: 15B
0.0 0.5 1.0 1.5 2.0 2.5 3.0 3.5 4.0 4.5 5.0 5.5 6.0
Time (min)
0
5
10
15
20
25
30
35
40
45
50
55
60
65
70
75
80
85
90
95
100 3.62
3.17
3.89
3.99
4.43
4.39
2.75
2.85
2.45
2.31
5.23 5.46
5.15
2.041.58
1.27
0.550.13 1.09
NL:
7.38E2
TIC F: + c ESI
SRM ms2
313.200
[132.990-
133.490] MS
PLstd0
RT: 0.00 - 6.00
0.0 0.5 1.0 1.5 2.0 2.5 3.0 3.5 4.0 4.5 5.0 5.5 6.0
Time (min)
0
5
10
15
20
25
30
35
40
45
50
55
60
65
70
75
80
85
90
95
100 2.64
2.95 3.08 4.542.37 3.58 3.93 4.99 5.19 5.751.951.370.49 0.930.23
NL:
2.44E6
TIC F: + c ESI
SRM ms2
303.130
[176.880-
177.380] MS
PLstd0
RT: 0.00 - 6.00 SM: 15B
0.0 0.5 1.0 1.5 2.0 2.5 3.0 3.5 4.0 4.5 5.0 5.5
Time
(
min
)
0
5
10
15
20
25
30
35
40
45
50
55
60
65
70
75
80
85
90
95
100 3.26
3.46 4.33
3.90
4.43
2.79
2.44
0.74 4.99 5.380.86
0.08 5.582.091.49
NL:
4.65E3
TIC F: + c ESI
SRM ms2
313.200
[132.990-
133.490] MS
PLstd2
Relative Abundance Relative AbundanceRelative Abundance
Fig. 2. Ion chromatograms of extracts from blank mouse plasma (top) or mouse plasma spiked with 1000 ng/mL hesperetin (IS, middle) and
2 ng/mL S-AR-42 (bottom)
741Preclinical Pharmacokinetics Study of R- and S-AR-42


![Quản Lý Điều Dưỡng: Hệ Thống, Kỹ Năng & Thực Hành [A-Z Mới Nhất]](https://cdn.tailieu.vn/images/document/thumbnail/2026/20260526/alfredodistefano10/135x160/32031780269987.jpg)


%20--%3e%3cdefs%3e%3cstyle%3e%20.st0%20{%20fill:%20%23fff;%20}%20.st1%20{%20fill:%20%237800fa;%20}%20%3c/style%3e%3c/defs%3e%3cpath%20class='st1'%20d='M117.78,12.18H43.11c2.9,3.47,4.65,7.94,4.65,12.82,0,5.6-2.3,10.66-6.01,14.29h76.02l7.22-13.56-7.22-13.56Z'/%3e%3cg%3e%3cpath%20class='st0'%20d='M53.58,26.17h-.59v-1.46h.59v-4.96h2.83c1.78,0,2.67.94,2.67,2.82v5.76c0,1.87-.89,2.81-2.67,2.81h-2.83v-4.96ZM55.36,21.37v3.34h1.1v1.46h-1.1v3.34h1.01c.61,0,.91-.37.91-1.1v-5.93c0-.74-.3-1.1-.91-1.1h-1.01Z'/%3e%3cpath%20class='st0'%20d='M65.99,31.14h-1.8l-.31-2.07h-2.19l-.31,2.07h-1.64l1.82-11.39h2.62l1.82,11.39ZM65.28,18.04c-.25.46-.51.77-.75.94-.21.15-.47.22-.79.22-.26,0-.57-.07-.92-.22l-.38-.15c-.14-.05-.26-.07-.37-.07-.3,0-.53.18-.71.54l-.91-.68c.25-.46.51-.77.75-.94.21-.14.48-.21.79-.21.26,0,.57.07.92.21l.38.15c.14.05.26.07.37.07.3,0,.53-.18.71-.54l.91.68ZM61.91,27.52h1.73l-.87-5.76-.87,5.76Z'/%3e%3cpath%20class='st0'%20d='M74.53,26.89v1.52c0,1.91-.89,2.86-2.67,2.86s-2.67-.95-2.67-2.86v-5.93c0-1.91.89-2.86,2.67-2.86s2.67.95,2.67,2.86v1.11h-1.69v-1.22c0-.75-.31-1.12-.93-1.12s-.93.37-.93,1.12v6.15c0,.74.31,1.11.93,1.11s.93-.37.93-1.11v-1.63h1.69Z'/%3e%3cpath%20class='st0'%20d='M81.4,31.14h-1.8l-.31-2.07h-2.19l-.31,2.07h-1.64l1.82-11.39h2.62l1.82,11.39ZM75.9,19.2l1.52-1.91h1.71l1.51,1.91h-1.61l-.76-.95-.75.95h-1.61ZM77.32,27.52h1.73l-.87-5.76-.87,5.76ZM83.1,15.99l-1.76,1.91h-1.26l1.17-1.91h1.86Z'/%3e%3cpath%20class='st0'%20d='M84.86,19.75c1.78,0,2.67.94,2.67,2.82v1.48c0,1.87-.89,2.81-2.67,2.81h-.85v4.28h-1.79v-11.39h2.64ZM84.01,21.37v3.86h.85c.58,0,.87-.36.87-1.08v-1.71c0-.71-.29-1.07-.87-1.07h-.85Z'/%3e%3cpath%20class='st0'%20d='M93.51,19.75c1.78,0,2.67.94,2.67,2.82v1.48c0,1.87-.89,2.81-2.67,2.81h-.85v4.28h-1.79v-11.39h2.64ZM92.66,21.37v3.86h.85c.58,0,.87-.36.87-1.08v-1.71c0-.71-.29-1.07-.87-1.07h-.85Z'/%3e%3cpath%20class='st0'%20d='M98.8,31.14h-1.79v-11.39h1.79v4.88h2.03v-4.88h1.83v11.39h-1.83v-4.88h-2.03v4.88Z'/%3e%3cpath%20class='st0'%20d='M105.36,24.55h2.46v1.62h-2.46v3.34h3.09v1.63h-4.88v-11.39h4.88v1.63h-3.09v3.18ZM108.17,17.29l-1.76,1.91h-1.26l1.17-1.91h1.86Z'/%3e%3cpath%20class='st0'%20d='M112.2,19.75c1.78,0,2.67.94,2.67,2.82v1.48c0,1.87-.89,2.81-2.67,2.81h-.85v4.28h-1.79v-11.39h2.64ZM111.35,21.37v3.86h.85c.58,0,.87-.36.87-1.08v-1.71c0-.71-.29-1.07-.87-1.07h-.85Z'/%3e%3c/g%3e%3ccircle%20class='st1'%20cx='25'%20cy='25'%20r='20'/%3e%3cpath%20class='st0'%20d='M32.78,19.27c2.92,0,4.43,2.55,5.28,5.33l.71,2.17c.14.38-.33.75-.71.75h-5.61c.19-.33.24-.71.09-1.08l-.75-2.45c-.43-1.32-.99-2.64-1.79-3.77.75-.57,1.65-.94,2.78-.94h0ZM25,18.38c3.25,0,4.9,2.78,5.89,5.89l.76,2.45c.14.42-.33.8-.8.8h-11.69c-.42,0-.94-.38-.8-.8l.75-2.45c.99-3.11,2.64-5.89,5.89-5.89h0ZM25,11.35c1.74,0,3.11,1.37,3.11,3.11s-1.37,3.11-3.11,3.11-3.11-1.41-3.11-3.11,1.41-3.11,3.11-3.11h0ZM17.27,19.27c1.08,0,1.98.38,2.73.94-.8,1.13-1.37,2.45-1.74,3.77l-.8,2.45c-.14.38-.05.75.09,1.08h-5.56c-.42,0-.9-.38-.75-.75l.71-2.17c.9-2.78,2.41-5.33,5.33-5.33h0ZM17.27,12.91c1.51,0,2.78,1.27,2.78,2.83s-1.27,2.83-2.78,2.83-2.83-1.27-2.83-2.83,1.27-2.83,2.83-2.83h0ZM32.78,12.91c1.56,0,2.78,1.27,2.78,2.83s-1.23,2.83-2.78,2.83-2.83-1.27-2.83-2.83,1.27-2.83,2.83-2.83h0ZM27.07,28.56v.09c0,.57-.24,1.08-.61,1.46h0v.05c-.38.33-.9.57-1.46.57s-1.08-.24-1.46-.61h0c-.38-.38-.61-.9-.61-1.46v-.09h1.41v.09c0,.19.05.38.19.47v.05c.09.09.28.19.47.19s.38-.09.47-.19v-.05c.14-.09.24-.28.24-.47t-.05-.09h1.41ZM30.99,28.56v.09c0,1.65-.66,3.16-1.74,4.24-1.08,1.08-2.59,1.79-4.24,1.79s-3.16-.71-4.24-1.79l-.05-.05c-1.04-1.08-1.7-2.55-1.7-4.2v-.09h1.41v.09c0,1.27.47,2.4,1.27,3.25h.05c.85.85,1.98,1.37,3.25,1.37s2.4-.52,3.25-1.37c.85-.8,1.37-1.98,1.37-3.25v-.09h1.37ZM34.99,28.56v.09c0,2.78-1.13,5.28-2.92,7.07-1.79,1.79-4.29,2.92-7.07,2.92s-5.23-1.13-7.07-2.92c-1.79-1.79-2.92-4.29-2.92-7.07v-.09h1.41v.09c0,2.4.94,4.53,2.5,6.08,1.56,1.56,3.72,2.5,6.08,2.5s4.52-.94,6.08-2.5c1.56-1.56,2.5-3.68,2.5-6.08v-.09h1.41Z'/%3e%3c/svg%3e)