doi:10.1046/j.1432-1033.2003.03774.x
Eur. J. Biochem. 270, 3916–3927 (2003) (cid:1) FEBS 2003
The single tryptophan of the PsbQ protein of photosystem II is at the end of a 4-a-helical bundle domain
Mo´ nica Balsera1, Juan B. Arellano1, Florencio Pazos2,*, Damien Devos2,†, Alfonso Valencia2 and Javier De Las Rivas1 1Instituto de Recursos Naturales y Agrobiologı´a (CSIC), Cordel de Merinas, Salamanca, Spain; 2Centro Nacional de Biotecnologı´a (CSIC), Cantoblanco, Madrid, Spain
model was built for the C-terminal domain of the PsbQ protein family (residues 46–149), while the N-terminal domain is predicted to have a flexible structure. The model for the C-terminal domain is based on the 3D structure of cytochrome b562, a mainly a-protein with a helical up/down bundle folding. Despite the large sequence differences between the template and PsbQ, the structural and ener- getic parameters for the explicit model are acceptable, as judged by the corresponding tools. This 3D model is compatible with the experimentally determined environ- ment of the tryptophan residue and with published struc- tural information. The future experimental determination of the 3D structure of the protein will offer a good valid- ation point for our model and the technology used. Until then, the model can provide a starting point for further studies on the function of PsbQ.
Keywords: extrinsic proteins; photosystem II; PsbQ; threading; three-dimensional model.
We examined the microenvironment of the single trypto- phan and the tyrosine residues of PsbQ, one of the three main extrinsic proteins of green algal and higher plant photosystem II. On the basis of this information and the previous data on secondary structure [Balsera, M., Arel- lano, J.B., Gutie´ rrez, J.R., Heredia, P., Revuelta, J.L. & De Las Rivas, J. (2003) Biochemistry 42, 1000–1007], we screened structural models derived by combining various threading approaches. Experimental results showed that the tryptophan residue is partially buried in the core of the protein but still in a polar environment, according to the intrinsic fluorescence emission of PsbQ and the fact that fluorescence quenching by iodide was weaker than that by acrylamide. Furthermore, quenching by cesium suggested that a positively charged barrier shields the tryptophan microenvironment. Comparison of the absorption spectra in native and denaturing conditions indicated that one or two out of six tyrosines of PsbQ are buried in the core of the structure. Using threading methods, a 3D structural
Photosystem II (PSII) is a type-II reaction center found in thylakoids of all oxygenic photosynthetic organisms (cyanobacteria, algae and higher plants), which harnesses light energy to oxidize water, producing molecular oxygen as a by-product [1–4]. The structure of the core of this pigment/protein complex, which consists of about 25 (intrinsic and extrinsic) proteins, denoted as PsbA–Z, has been X-ray resolved at 3.8 A˚ and 3.7 A˚ for two species of Synechococcus [5,6]. The 3D structures of these two PSII core complexes show the arrangement of some Psb proteins, chlorophylls and other cofactors, and also suggest some possible ligands for the Mn cluster, where water is oxidized. For a functional Mn cluster, other ionic cofactors (such as Ca2+ and Cl–) are required [7–9];
however, there is no clue as to where these two latter cofactors are localized in the X-ray structure of PSII. The three lumenal extrinsic proteins – PsbO, PsbV and PsbU – observed in the 3D structure of the PSII core of Thermosynechococcus vulcanus, have a role in the stabili- zation of the Mn cluster and of its ionic cofactors Ca2+ and Cl–, and also in the overall (thermo)stability of PSII [10–12]. PsbO is the only orthologous PSII extrinsic protein found in all oxygenic photosynthetic organisms, with PsbV and PsbU being present only in cyanobacterial and red algal PSII. Exceptionally, there is a fourth extrinsic protein of 20 kDa in red algal PSII that is not found in any of the other PSII complexes [13]. PsbP and PsbQ are the counterparts of PsbV and PsbU in green algae and higher plants [10]. All of these PSII extrinsic proteins facilitate oxygen evolution, but they differ in their specific binding to PSII. PsbO is the only extrinsic protein totally exchangeable without loss of function, in binding to PSII of any of the oxyphotosynthetic organisms. In contrast, the red algal PsbU and PsbV are only partially functional, and PsbP and PsbQ are not functional when binding to PSII of cyano-bacteria and red algae [14]. Differences in the binding properties of green algal and higher-plant PsbP and PsbQ have also been observed [15], suggesting that the former do not need the presence of PsbO when (re)binding to PSII. Moreover, it has been
Correspondence to A. Valencia, Centro Nacional de Biotecnologı´ a (CSIC), Cantoblanco, Madrid 28049, Spain. Fax: + 34 9585 45 06, Tel.: + 34 91 585 45 70, E-mail: valencia@cnb.uam.es Abbreviations: Chl, chlorophyll; Gdn/HCl, guanidine hydrochloride; PSII, photosystem II. *Present address: Imperial College, London UK. (cid:1)Present address: University of California, San Francisco, CA, USA. (Received 6 June 2003, revised 14 July 2003, accepted 29 July 2003)
3D Structural analysis of PsbQ (Eur. J. Biochem. 270) 3917
(cid:1) FEBS 2003
Isolation and purification of the PsbQ protein from spinach
suggested that the structure of some of these extrinsic proteins depends on the organism [15,16]. The specific binding sites for PsbO, PsbP and PsbQ in the lumenal side of green algal and higher plant PSII are less known than in cyanobacterial PSII. In higher plants, PsbO is believed to have an extended structure that lies on the surface of CP47/D2 (PsbB/PsbD) [17,18], but also on the surface of CP43/D1 (PsbC/PsbA) [19]. Intriguingly, the arrangement for the higher-plant PsbO is slightly different from that observed in the X-ray-resolved cyano- bacterial PSII. On the other hand, PsbP and PsbQ are positioned at the N-terminus of D1 [17,20]. In addition, PsbQ requires the presence of PsbP when binding to higher-plant PSII, but there is no direct evidence for their mutual interaction [10]. Likewise, the partial degradation of the N-terminal regions of PsbP and PsbQ results, respectively, in a decrease in, and in a complete loss of, binding affinity for the lumenal side of PSII [21,22].
PSII-enriched membranes were isolated from spinach leaves, as described previously [38] with some modifications [39]. Total chlorophyll (Chl) and the Chla/Chlb ratio were determined spectrophotometrically by the method of Arnon [40]. PSII-enriched membranes with a concentration of 4–6 mgÆmL)1 of Chl were stored at )80 (cid:2)C until use. When purifying PsbQ, PSII-enriched membranes were washed in a 10-fold excess of 20 mM Mes, pH 6.0, and then centrifuged at 40 000 g for 30 min at 4 (cid:2)C. The pellet was suspended in 20 mM Mes, pH 6.0, containing 10 mM CuCl2, to a concentration of 2 mgÆmL)1 of Chl. PSII-enriched mem- branes were incubated for 1 h at room temperature, followed by centrifugation at 40 000 g for 30 min at 4 (cid:2)C. The pH of the supernatant was adjusted to a value of 8.0, by adding, alternatively, pH-unadjusted stock solutions of Tris and EDTA. The final concentration of EDTA was 5 mM. Under these conditions, the pale blue of the supernatant at pH 6.0 became deep blue at pH 8.0. The supernatant was passed through a syringe filter (0.45-lm pore size) and stored at 4 (cid:2)C without any further treatment until required for chromatography. The chromatographic steps were carried out in an A¨ ktapurifier-100 apparatus (Amersham Pharmacia Biotech UK Limited). The native PsbQ protein was first passed through a cation-exchange High-Trap SP column (1 mL) (Amersham Biosciences AB,) and then through a gel-filtration Superdex-200 column HR 10/30 (Amersham Biosciences AB), both pre-equilibrated with 20 mM Tris/HCl, pH 8.0, containing 35 mM NaCl, 1 mM EDTA and 1 mM phenylmethanesulfonyl fluoride. Further details of these two chromatographic steps have been described previously [37].
From a functional point of view, there is a consensus that PsbO stabilizes the Mn cluster [10], but several roles have been assigned to the other two (or three) extrinsic proteins. In cyanobacteria, PsbV and PsbU maintain the overall stability of PSII, but PsbU may also optimize the Ca2+ and Cl– environment in the Mn cluster [23]. In red algae, oxygen evolution is strongly dependent on Ca2+ and Cl– in the absence of PsbV and PsbU, indicating that they both play a similar role to PsbP and PsbQ in green algae and higher plants [13,24–28]. Other functions proposed for PsbP and PsbQ are (a) to form a gate that is open for substrates [26] and products [29], but closed to non- physiological reducing agents [30]; (b) to create a low dielectric medium that is optimal for PSII binding to Ca2+ [31] and Cl– [32] and (c) to tune up the magnetic properties of the Mn cluster [33].
SDS/PAGE analysis
The SDS/PAGE analysis was carried out using a Protean II xi Cell (Bio-Rad Laboratories), according to Laemmli [41], with a total acrylamide content of 17% in the resolving SDS/polyacrylamide gel. The SDS/polyacrylamide gels were stained with Coomassie R-250.
Protein concentration and absorbance measurements
It will be very useful to address the analysis of the complex with information about the structure of the individual complexes. Unfortunately little is known about the 3D structure of PsbP and PsbQ, compared to the wealth of information about PsbO, PsbV and PsbU [6,34–36]. In a previous report [37] we suggested that the PsbQ protein had two different structural domains: the N terminus (residues 1–45), with a non-canonical secondary structure; and the C terminus (residues 46–149), with a mostly a-helix structure. Now, we propose a 3D model for the C-terminal domain of PsbQ based on its structural analogy with the known 3D structure of a protein, using threading and modelling. The resulting model is compatible with the information previ- ously obtained on the secondary structure of the protein and with the experimental results obtained from changes in the absorption of the protein under denaturing conditions, protein tryptophan fluorescence emission and fluorescence quenching.
Materials and methods
Absorption spectra were recorded in a Cary 100 UV-visible spectrophotometer (Varian Inc., Palo Alto, CA, USA), using a scan rate of 30 nmÆmin)1 at 20 (cid:2)C. The PsbQ protein concentration was determined from the sum of the extinction coefficients of its aromatic amino acids at 276 nm in 6 M Gdn/HCl, as described previously [42]; such deter- extinction coefficient of mination yielded a molar )1Æcm)1. The degree of tyrosine exposure (a) was 14 100 M calculated from the second-derivative spectrum [43], as follows:
a ¼ ðrn (cid:3) raÞ=ðru (cid:3) raÞ
Material and chemicals
where rn and ru are the experimentally determined numerical values of the ratio a/b, and ra is the theoretical numerical value of ratio a/b for a mixture of aromatic amino acids (Tyr and Trp), containing the same molar ratio as the protein under study, dissolved in a model
Spinach leaves were purchased at the local market. Guani- dine hydrochloride (Gdn/HCl), CsCl, Na2S2O3 and acryl- amide were from Sigma-Aldrich Corp. KI was from Merck & Co. Inc. All these chemicals were of reagent grade and used without further purification.
3918 M. Balsera et al. (Eur. J. Biochem. 270)
(cid:1) FEBS 2003
solvent (i.e. ethylene glycol), which possesses the same characteristics of the interior of the protein matrix. The script a is the peak–peak distance between the maximum at (cid:5)287 nm and the minimum at (cid:5)283 nm, and the script b is the peak–peak distance between the maximum at (cid:5)295 nm and the minimum at (cid:5)290 nm in the second derivative absorption spectrum of the protein.
Fluorescence emission spectra and fluorescence quenching
distribution of the scores for all the templates in the fold library. The protein fold recognition protocol proceeded as follows. First, a set of candidate folds was chosen based not only on the scores of the three best hits proposed by each threading program, but also on the fold similarity among the three best hits according to the FSSP database [54]. Then, 1D and 3D alignments of the query protein with each of the hit templates were inspected using the THREADLIZE package [55]. In addition, CLUSTALX [56] was used to align the PsbQ sequence, and the profiles of the proposed structures derived from the alignments were deposited in the HSSP database [57]. The quality of each alignment was evaluated by the number and distribution of gaps, percentage of identity and distribution of hydropho- bic residues. Once a template was chosen, a full-atom 3D model, based on the threading alignment, was obtained using the Swiss-Model automated modelling server [58] and evaluated using the WHATCHECK [59], PROMODII [60] and VERIFY3D [61] programs, and the distribution of the conserved residues based on the Xd parameter [62]. This latter parameter measures the distribution of the distances between the conserved residues and all the residues, as the most conserved residues are those implicated in the structure and/or function and appear clustered in the structure [63].
Results
Isolation and purification of the PsbQ protein
Fluorescence emission spectra were recorded in a steady- state spectrofluorometer Model QM-2000-4 (Photon Technology International Inc., Lawrenceville, NJ, USA), equipped with a refrigerated circulator. Fluorescence emission spectra were recorded in 0.5-cm path quartz cells at 20 (cid:2)C. Both excitation and emission monochromators were set at 3-nm slit widths. Protein samples were excited at 280 or 295 nm. Fluorescence emission spectra were recorded from 300 to 500 nm with steps of 0.5 nm and an integration time of 2 s, averaged three times and corrected by subtracting the Raman band and the buffer signal. During measurement, stock solutions of PsbQ were diluted in 50 mM Tris/HCl, pH 8.0, and their concentration was maintained at 3.5–10 lM. A final concentration of 6 M Gdn/HCl was used when denaturing PsbQ. Polar un- charged acrylamide, and KI and CsCl salts, were used for performing collisional quenching of protein tryptophan fluorescence at 20 (cid:2)C. NaCl was added to maintain a constant ionic strength. The 4-M stock solution of KI – contained 1 mM Na2S2O3 to prevent the formation of I3 [44]. Fluorescence intensities were corrected when adding acrylamide [45]. The fluorescence quenching was analyzed following the classical and modified Stern–Volmer equa- tions [46,47]:
F0=F ¼ 1 þ KSV ½Q(cid:8)
or
F0=F ¼ ð1 þ KSV ½Q(cid:8)Þ (cid:9) eV½Q(cid:8); where F0 and F are the fluorescence intensities in the presence and absence of the quencher Q, Ksv is the collisional quenching constant, and V is the static constant, which is related to the probability of finding a quencher molecule close enough to a newly formed excited state to quench it immediately.
Bioinformatics methods
Multiple sequence alignment and secondary structure prediction of the PsbQ protein family have been reported previously [37]. The threading programs used to predict a fold for PsbQ were: FFAS [48]; THREADER2 [49]; 3D-PSSM [50]; FUGUE [51]; 123D+[52]; and BIOINBGU [53]. These programs propose a list of protein hits whose known 3D structure could be similar to the query protein based on features of the PsbQ sequence family, such as secondary structure, solvent accessibility, contact potentials, etc. These methods cover a vast range of available threading strategies, based on clearly different principles and libraries. The templates are scored by a reliability index, usually a Z-score, which measures the difference in score between the raw score of a query-template alignment and the
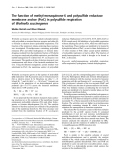
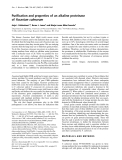
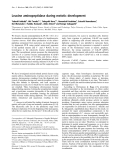
The use of 10 mM CuCl2 to release the extrinsic PsbQ protein from PSII-enriched membranes was based on the finding of Jegerscho¨ ld et al. [64]. When adding 6–7 mM CuSO4 to a PSII preparation to examine the effect of Cu2+ on PSII activity by EPR, Jegerscho¨ ld et al. reported a concomitant 90% loss of PsbQ, whereas the other two extrinsic proteins (PsbO and PsbP) remained largely bound. This observation gains interest if we also bear in mind that Cu2+ at (sub)millimolar concentrations inhibits a specific prolyl-endopeptidase for PsbQ, a protease that cleaves the N terminus at the carboxyl side of the fourth and 12th proline residues of PsbQ from spinach [65]. Standard protocols to release the extrinsic peptides of PSII include high-salt concentration washes [10]. However, the 1-M NaCl wash, frequently selected to release PsbP and PsbQ, also detaches the prolyl-endopeptidase. When removing NaCl by prolonged dialysis, this protease is activated and cleaves PsbQ at low salt concentrations. We circumvented the drawbacks of the 1-M NaCl wash by taking advantage of the Cu2+ effect. In this latter case, first, the prolyl- endopeptidase (if present in the supernatant) is expected to be largely inhibited by 10 mM CuCl2 and, second, prolonged dialysis is not required before chromatography, owing to the very low ionic strength of the 10 mM CuCl2 washing buffer. Incubation of the PSII-enriched membranes with this buffer yielded a supernatant containing PsbQ, but also some PsbO and a little PsbP (Fig. 1, lane c). The first chromatographic step in the cationic-exchange High-Trap SP column was very similar to the one described previously [37], except that larger volumes of the supernatant were loaded owing to its lower protein concentration, and also that the High-Trap SP column was thoroughly washed with
3D Structural analysis of PsbQ (Eur. J. Biochem. 270) 3919
(cid:1) FEBS 2003
the pre-equilibrating buffer (10–15 mL) to remove unbound materials and also traces of Cu2+. After the linear salt gradient, the PsbQ-enriched fractions were pooled, concen- trated and loaded onto the Superdex 200 HR 10/30 column. After filtration through this latter column, the fractions containing PsbQ (Fig. 1, lane d) were stored at 4 (cid:2)C until required for use.
Absorbance spectrum
Fig. 1. Purification steps of the native PsbQ protein from spinach. SDS/ PAGE shows (a) control photosystem II (PSII)-enriched membranes; (b) 10 mM CuCl2-washed PSII-enriched membranes; (c) supernatant of the 10 mM CuCl2-washed PSII-enriched membranes; and (d) puri- fied PsbQ protein after filtration through the Superdex 200 HR 10/30 column.
that become more polar
Fluorescence measurements
The single tryptophan amino acid present in PsbQ from spinach is fully conserved throughout the PsbQ sequence family [37]. This aromatic amino acid can specifically be excited at an excitation wavelength beyond 295 nm [47] Therefore, the intrinsic fluorescence emission spectrum of PsbQ depends only on the microenvironment that
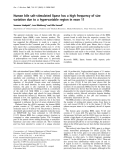
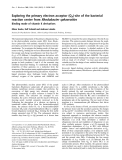
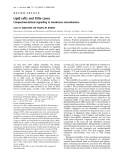
The aromatic amino acids (and also cystine if present) are responsible for the absorption band of proteins in the near-UV region. The sequence of the PsbQ protein from spinach contains one tryptophan, six tyrosines, and four phenylalanines. Figure 2A shows the overall contribution of these 11 aromatic amino acids to the absorption spectrum of PsbQ in the 260–310 nm region. In native conditions, a maximum at 277.5 nm and two shoulders at (cid:5)282 and (cid:5)292 nm are inferred from the absorption spectrum of PsbQ. A hypsochromic shift of 1–2 nm is observed in the absorption spectrum of this protein in denaturing conditions (6 M Gdn/HCl). This shift may be the result of changes in the microenvironment of tyrosine residues following protein denaturation [43]. According to the equation for a (Materials and methods), the degree of tyrosine exposure can be estimated from the second derivative of the absorbance spectra of PsbQ when determining the ratio a/b in native and denaturing conditions (Fig. 2A). The values for rn and ru were (cid:5)2.6 and (cid:5)3.6, respectively, and the value for ra was )0.58 [43]. The resulting value for a was 0.76, indicating that one or two tyrosine residues are not solvent exposed in PsbQ.
Fig. 2. Absorption and fluorescence emission spectra of the native PsbQ. (A) Absorption spectra (thick traces) and the second derivative of the absorption spectra (thin traces) of the PsbQ protein under native (solid lines) and denaturing (dashed lines) 6-M Gdn/HCl, conditions. The arrows indicate the peak–peak distances between maxima and minima that are required to determine the values for a and b, according to a previously published procedure [43]. (B) Intrinsic fluorescence emission spectra of PsbQ when exciting at 295 nm under both native (thick solid line) and denaturing (thin dashed line) 6-M Gdn/HCl conditions, and when exciting at 280 nm under native conditions (thick dashed line). The difference in fluorescence-emission spectrum between excitations at 280 and 295 nm, when normalizing at 400 nm, is shown (thin solid line).
3920 M. Balsera et al. (Eur. J. Biochem. 270)
(cid:1) FEBS 2003
surrounds the tryptophan residue, so it can indicate the extent to which this residue is exposed to the solvent [45]. The intrinsic fluorescence emission spectrum of PsbQ has a maximum at 327 nm and a full width at half maximum of 53 nm at 20 (cid:2)C in native conditions (Fig. 2B). However, quenching of the fluorescence intensity and a bathochromic fluorescence shift of the emission peak from 327 nm to 353 nm are observed in denaturing conditions (6 M Gdn/ HCl), suggesting that the microenvironment of the trypto- phan residue is exposed to the solvent in the denatured state. At 280 nm, tyrosine (and also tryptophan) residues are excited. Thus, the intrinsic fluorescence emission spectrum of PsbQ has a maximum at (cid:5)323 nm at 20 (cid:2)C. The normalization at 400 nm [66] of the two spectra of PsbQ, seen at 295 and 280 nm, shows that the fluorescence emission caused by tyrosine is weak. This suggests that there is an efficient singlet–singlet energy transfer from Tyr (to Tyr) to Trp. The difference between the two fluorescence emission spectra clearly shows a weak band centered at 304 nm. It corresponds to the fluorescence emission of Tyr residues in PsbQ [66] that did not transfer their excitation energy owing to either a long Tyr–Trp distance or an inefficient Tyr–Trp transition dipole orientation.
Quenching of tryptophan fluorescence by iodide, cesium ion and acrylamide
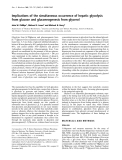
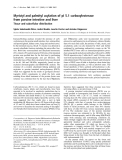
quencher concentration monitored at 320 nm when exciting at 295 nm. No bathochromic fluorescence shift was observed for any quencher when the concentration increased, indicating the absence of protein denaturation (data not shown). Whereas a linear dependence was inferred between the intrinsic fluorescence intensity of PsbQ and the concentration of Cs+ or I–, an upward curve was obtained with increasing concentrations of acrylamide, suggesting some static quenching [47,67]. The Cs+ and I– results were represented with the classical Stern–Volmer plot, but a modified plot was used for acrylamide to obtain both the collisional (Ksv) and static (V ) quenching constants. All fluorescence measurements for the three quenchers were carried out at the same ionic strength (0.2 M NaCl), although a second ionic strength (1 M NaCl) was used for I–. The collisional quenching constant is greater for the )1) than polar uncharged acrylamide (Ksv ¼ 3.2 ± 0.1 M the respective ones for the ionic quenchers, and likewise )1) greater for the anionic quencher I– (Ksv ¼ 1.2 ± 0.1 M )1). The modified than for the cationic Cs+ (Ksv ¼ 0.0 M Stern–Volmer equation gives a static quenching constant )1. KSV for acrylamide (V) for acrylamide of 0.11 ± 0.07 M did not change when the ionic strength of the solvent was increased, but the collisional quenching constant showed a )1). All decrease for I– at 1-M NaCl (Ksv ¼ 0.67 ± 0.04 M these results suggest that the tryptophan residue is, to some extent, buried in the PsbQ protein matrix, to where the polar uncharged acrylamide can diffuse but where the ionic compounds have little access. In addition, the effect of the ionic strength on the quenching of the tryptophan fluores- cence by I– [44], and the lack of quenching by Cs+, indicate that a positive charge barrier is shielding the tryptophan microenvironment.
PsbQ fold recognition
Aqueous fluorescence collision quenchers have been used extensively to measure the exposure of tryptophan residues to the aqueous environment [44,67]. The efficiencies of the indole fluorescence quenching for acrylamide and I– have been shown to be unity, which is five times higher than the efficiency for Cs+ [46]. Cs+ and I– are two quenchers that may collide with exposed indole groups, and also with groups located in a negative or positive environment, respectively. Acrylamide can quench both exposed and unexposed residues [67]. Figure 3 shows the dependence of the relative intrinsic fluorescence intensity of PsbQ with the
An exhaustive search, of all known public biological databases, for 3D known-structure homologous protein to PsbQ did not identify any protein on which to build models of the PsbQ. Therefore, a fold recognition approach by threading methods was carried out in the search for remotely related structures, using both the spinach PsbQ sequence and the PsbQ family alignment as references [37]. The three best hits of the threading methods are shown in Table 1. Most (14 out of 18) identified a-helix proteins as candidate models for PsbQ: the up/down and orthogonal bundles were the most frequent architectures. The threading programs did not identify candidate folds for the region of the sequence corresponding to the N-terminal domain (residues 1–45). As new threading runs excluded this domain, the selection of mainly a-helix templates became even clearer (13 out of 15) (Table 2). Among all the possibilities for PsbQ, the four a-helix up/down bundle appeared to be the dominant topology, judging by the proportion (33% of all the cases) and the confidence level of the hits. The hits 1vltB0 and 1aep00 had a confidence level of >80%. They correspond to different proteins of the same CATH [68] family (1.20.120.x, Tables 1 and 2). Although most of the scores of the other predictions were below these confidence levels, two other structures – 1cgo00 and 1jafA0 – were selected by two or more programs (THREADER2, 3D-PSSM, 123D+ and FUGUE, 3D-PSSM, respectively).
Fig. 3. Fluorescence quenching of the native PsbQ protein. Stern– Volmer analyses of the quenching of the single tryptophan-containing PsbQ protein by acrylamide (r), iodide (d, 0.2 M NaCl; s, 1 M NaCl) and cesium (j). The experimentally determined collisional and static quenching constants, KSV and V, are included in the text.
3D Structural analysis of PsbQ (Eur. J. Biochem. 270) 3921
(cid:1) FEBS 2003
Table 1. Templates proposed for the PsbQ protein by different threading methods: prediction for the complete sequence (residues 1–149). The PDB codes are presented according to the CATH nomenclature, which includes two more cases to specify the subunit and the domain (i.e. 1xxxA2 ¼ PBD file 1xxx, subunit A, domain 2). The score thresholds for each method with a certainty of >80% are: >3.5 for THREADER2; >8 for FFAS; >5.0 for FUGUE; >10 for BIOINBGU; <1.0 for 3D-PSSM; and >5.0 for 123D+.
THREADER2
FFAS
FUGUE
BIOINBGU
Score CATH or SCOP Structural classification Method PDB
3D-PSSM
123D+
1vltB0 1cgo00 256bA0 1dkg b 1sctG0 1dg4A0 1jafA0 1gsa02 1g59 1fzp b 1b0nA0 1qsdA0 1d7ma 1cgo00 1jafA0 1wdcB1 1cgo00 1zymA2 3.79 3.02 2.71 6.09 5.17 4.99 3.91 3.06 3.05 9.5 8.6 6.5 1.59 1.79 2.07 4.20 3.87 3.72 C 1.20.120.30 C 1.20.120.10 C 1.20.120.10 S C 1.10.490.10 C 2.60.34.10 C 1.20.120.10 C 3.30.470.20 S S C 1.10.260.10 C 1.20.1040.50 S C 1.20.120.10 C 1.20.120.10 C 1.10.238.10 C 1.20.120.10 C 1.10.274.10 Mainly a; up/down bundle; four helices Mainly a; up/down bundle; four helices Mainly a; up/down bundle; four helices Coiled-coil; parallel Mainly a; orthogonal bundle; globin like Mainly b; sandwich; complex Mainly a; up/down bundle; four helices a b; two-layer sandwich All a; multihelical two all-a domains All a; up/down bundle; three helices Mainly a; orthogonal bundle; repressor Mainly a; up/down bundle; spectrin Coiled-coil; parallel Mainly a; up/down bundle; four helices Mainly a; up/down bundle; four helices Mainly a; orthogonal bundle; recoverin Mainly a; up/down bundle; four helices Mainly a; orthogonal bundle; enzyme i
Table 2. Templates proposed for the PsbQ protein by different threading methods: prediction for the C-terminal domain (residues 46–149). The PDB codes are presented according to the CATH nomenclature, which includes two more cases to specify the subunit and the domain (i.e. 1xxxA2 ¼ PBD file 1xxx, subunit A, domain 2). The score thresholds for each method with a certainty of >80% are: >3.5 for THREADER2; >8 for FFAS; >5.0 for FUGUE; >10 for BIOINBGU; <1.0 for 3D-PSSM; and >5.0 for 123D+.
FFAS
FUGUE
BIOINBGU
Method PDB Score CATH or SCOP Structural classification
3D-PSSM
123D+
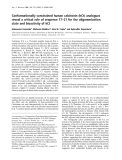
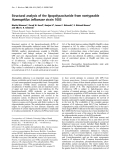
a orthogonal bundle. This architecture (CATH 1.10.x.x) appears in four out of 18 candidates when analysing the whole PsbQ sequence (Table 1) and in five out of 15 candidates when only the C-terminal domain was analysed (Table 2). However, the topology of these structures did not correspond to a unique topological family. Based on the predicted secondary structure [37], a clear distribution of amphipathic residues is shown, with the non-polar residues forming one of the faces of the helices (Fig. 4B). This distribution favours a parallel packing of the four a-helices, supporting the up/down bundle architecture
Furthermore, when the prediction was restricted to the second (C-terminal) domain, 1qsdA0 and 256bA0 were identified as templates by two methods (BIOINBGU, 3D-PSSM and 3D-PSSM, 123D+, respectively). All six potential targets have similar topology and structure (their FSSP database [54] classification of a-helical up/down bundle structures, Fig. 4A). The family includes proteins that are homogen- eous in structure but heterogenous in sequence and func- tion, e.g. 1vlt (aspartate receptor) and 256b (cytochrome b256) with 20% sequence identity. Other structural archi- tecture proposed by several threading methods was a mainly
1sctG0 1gcvA0 1dkg b 1aep00 1jafA0 1gln04 1qsdA0 1fzp b 2crxA1 1d7m a 256bA0 1qsdA0 256bA0 1abv00 1fxk c 5.62 5.27 5.15 5.12 4.30 3.67 9.5 9.4 7.5 1.75 2.28 3.1 4.08 3.62 3.40 C 1.10.490.10 C 1.10.490.10 S C 1.20.120.10 C 1.20.120.10 C 1.10.8.70 C 1.20.1040.50 S C 1.10.443.10 S C 1.20.120.10 C 1.20.1040.50 C 1.20.120.10 C 1.20.520.20 S Mainly a; orthogonal bundle; globin like Mainly a; orthogonal bundle; globin like Coiled-coil; parallel Mainly a; up/down bundle; four helices Mainly a; up/down bundle; four helices Mainly a; orthogonal bundle; helicase Mainly a; orthogonal bundle; spectrin All a; up/down bundle; three helices Mainly a; orthogonal bundle; integrase Coiled-coil; parallel Mainly a; up/down bundle; four helices Mainly a; up/down bundle; spectrin Mainly a; up/down bundle; four helices Mainly a; orthogonal bundle; peroxidase All a; up/down long a-hairpin; two helices
3922 M. Balsera et al. (Eur. J. Biochem. 270)
(cid:1) FEBS 2003
3D threading model for the C-terminal domain of PsbQ protein
rather than the orthogonal. The length of the connecting loops between helices also supports the up/down bundle topology.
Selection of the best PDB template for the C-terminal domain of PsbQ
conformation, )0.609;
energetic parameter of
A full-atom model for the C-terminal domain of PsbQ was obtained using the SWISS-MODEL [58] program based on the threading alignment between PsbQ and cytochrome b562 (Fig. 5C). The WHATCHECK [59] and PROMOD [60] programs were used to evaluate the models. The corresponding parameters obtained were: Ramachandran plot, )0.290; backbone chi-1/chi-2 rotamer normality, )0.945; bond lengths, 0.791; bond angles, 1.353 the model was and the E ¼ )3160 kJÆmol)1. Bond lengths and angles were close to the optimal value of 1. Ramachandran plot, backbone conformation and chi-1/chi-2 rotamer normality correspond to Z-scores and therefore a positive value indicates better than average and their maximum values are around 4. The values for all these parameters obtained for the PsbQ model were quite good and the programs did not mark any as poor or inappropriate. Another structural analysis, obtained by the VERIFY3D program [61], gave an average value of 0.21, which is greater than zero, the quality value indicated by the program. In addition, the distribution of distances between conserved residues and between all the residues was calcu- lated, as was the Xd parameter (Materials and methods) [62]. The value of Xd was greater than zero (Xd ¼ 9.5), which indicates that the conserved residues are close to each other in the structure, as is typical for known proteins. Moreover, visual inspection of the models revealed a correct distribu- tion of conserved residues in the hydrophobic core of the structure and also in the loops connecting helix2 and helix3.
In order to select the best template to construct a remote 3D model for the C-terminal domain (residues 46–149) of PsbQ, the structural alignments between the problem PsbQ protein and each of the threading hits (Tables 1 and 2) were manually inspected using the THREADLIZE package [55], bearing in mind the compatibility of the predicted [37] and known secondary structures. Also, the quality of the sequence alignment between the families (each threading hit family obtained from HSSP database), the number and distribution of gaps, the sequence homology and the hydropathy profile were analysed. After this manual process, the best fit between PsbQ and the chain A of 256b (256bA0) was selected. This protein is a periplasmic cytochrome b562 of Escherichia coli with a molecular mass of 11.78 kDa and unknown function [69]. The 256bA0 structure consists of four main a-helices (and a 310 helix at the end of the second helix) that fold as a helical up/down bundle. The 1D sequence alignment between the C-terminal domain of PsbQ and 256bA0 is shown in Fig. 5A. This alignment is compatible with the complete PsbQ family alignment (data not shown). In spite of the low sequence identity ((cid:5) 8%), a good match of the corresponding secondary structures and hydropathy profiles was obtained (data not shown).
Fig. 4. Fold recognition of the PsbQ family. (A) 3D Superposition of the templates 1aep, 1cgo, 1jaf, 1qsd, 1vls and 256b, as indicated in the FSSP database. (B) Helical wheel diagram for the four a-helices of PsbQ. The first residue of each wheel is numbered according to the spinach PsbQ sequence (T46, W71, S193 and T131); the hydrophobic residues of the internal faces are filled in grey. The single tryptophan is circled by a thick black line and the four tyrosines are surrounded by circular dotted lines.
3D Structural analysis of PsbQ (Eur. J. Biochem. 270) 3923
(cid:1) FEBS 2003
Fig. 5. Proposed structural model for PsbQ. (A) Sequence alignment of the template (cytochrome b562) and the C-terminal domain of PsbQ (residues 46–149). The ruler starts at position 46 (i.e. at the first residue of the mature PsbQ protein). (B) Sequence alignment of the N-terminal domain of PsbQ from spinach and Chlamydomonas reinhardtii, where the charged residues are indicated. (C) View of the 3D model for PsbQ, where the non-modelled N-terminal domain of PsbQ (residues 1–45) is shown as a string and the wireframe of the aromatic amino acids W71, Y84, Y87, Y133 and Y134 are outlined. The gap between residues 109 and 111 in the helix, numbered according to the PsbQ-256b alignment (A), is labeled, as is the helix 310 present in the template but not predicted in PsbQ.
Discussion
In a previous publication [37], a secondary structure analysis of the PsbQ spinach protein was carried out by using CD and FTIR spectroscopy and bioinformatics tools. It was concluded that PsbQ was mainly a-protein, with two different structural domains: a minor N-terminal domain, with a poorly defined secondary structure enriched in proline and glycine amino acids (residues 1–45), and a major C-terminal domain containing four a-helices (residues 46–
149). We have now extended the study on PsbQ by building a 3D model based on a fold recognition computational approach. The computational searches did not reveal any structural template for the N-terminal region of PsbQ, probably as a result of its apparent lack of stable structure. A search for disorder segments in the PsbQ sequence was performed using the PONDR program [70]. The result sugges- ted that the N-terminal segment (residues 4–27) is the longest and most disordered region of PsbQ (data not shown), in good agreement with our previous predictions [37]. For the
3924 M. Balsera et al. (Eur. J. Biochem. 270)
(cid:1) FEBS 2003
)1) than acrylamide (3.2 M
rest of the structure (i.e. the C-terminal domain) a four a-helical up/down bundle topology was proposed and the structure of cytochrome b256 was selected as template. However, significant differences were expected between this cytochrome structure and the structure of PsbQ. For example, PsbQ has no heme group, so a more compact structure was predicted. Moreover, the sequence alignment between 256b and PsbQ (Fig. 5A) requires the inclusion of a three-residue gap (109–111). Therefore, the region corres- ponding to the helix-3 in PsbQ (Fig. 5C) is expected to be continuous and one turn shorter. It is impossible to determine whether PsbQ possesses a 310 helix, as the template 256b has between helix-2 and helix-3 (residues PKL). In contrast to 256b, a short b-strand or a longer loop is suggested for this region of PsbQ [37]. The loops in the model are difficult to predict as a result of their flexibility, but they are foreseen to be highly charged and solvent exposed and so could be implicated in the electrostatic binding of PsbQ to PSII.
[72], the tryptophan residue is within class-2, where the edge of the benzene ring is exposed to the solvent. These two classifications, in which the tryptophan residue of PsbQ is proposed to be partially buried, are consistent with the results of fluorescence quenching. The fact that I– has a )1) smaller KSV constant (1.2 M indicates that there is little accessibility for I– to quench the singlet excited tryptophan. In addition, the lack of quench- ing by Cs+, and the decrease in the KSV for I– at higher ionic strength, suggest not only that the tryptophan residue is hidden from ionic quenchers, but also that its microenvi- ronment is shielded by a positively charged barrier that cannot be penetrated by cationic quenchers. The tryptophan residue in the model of PsbQ protein is at the start of helix-2, pointing towards the core of the protein (Fig. 5C). This position is in full agreement with position a for Trp in amphipathic helices, where they form a lid over the hydrophobic core of the protein [73]. In addition, Trp is surrounded by a positively charged cluster of residues, mainly located in the loop between helix-2 and -3 and that between helix-3 and -4. This microenvironment for the tryptophan residue, derived from the 3D model, is compati- ble with the fluorescence data. Regarding the exposure of the tyrosine residues to the solvent, the described changes in the absorption spectrum of PsbQ suggest that one or two out of six tyrosine residues are buried in the protein. The arrangement of four tyrosines is shown in Fig. 5C, while the other two in the Nt-domain are probably solvent exposed in the flexible structure of the domain. It is proposed that at least one is buried in the core of the protein (Y134) while the others seem to be solvent exposed. Tyr134 and Trp are very close, near one end of bundle, so they could seal the hydrophobic core of PsbQ.
The 3D model for the C-terminal domain presented here corresponds to PsbQ from spinach, but it would be equally valid for the rest of the PsbQ family. Indeed a similar fold- recognition approach performed with Chlamydomonas rein- hardtii sequence gave similar results (data not shown). The PsbQ family consists of higher-plant PsbQ proteins (>65% identity with respect to spinach) and of green algal PsbQ proteins, which are slightly divergent from the former (<30% identity with respect to spinach) [37]. This higher- plant green algae divergence is also observed when other parameters, such as the theoretical pI value of the PsbQ proteins, are determined i.e. the pI is 9.25 for spinach but 5.71 for Chlamydomonas. However, this difference in pI is less evident when the two domains of PsbQ are considered separately. In this case, the theoretical pI values are very similar when calculated for each domain: pI (N-t, residues 1–45) ¼ 4.47 and pI (C-t, residues 46–149) ¼ 9.49 for spinach; and pI (N-t, residues 1–43) ¼ 4.47 and pI (C-t, residues 44–149) ¼ 8.87 for Chlamydomonas. Moreover, the highest divergence between the higher plant and green algal PsbQ sequences is found in the N-terminal domain (residues 1–45) (Fig. 5B). A bipartite region is inferred in the higher-plant PsbQ that consists of a hydrophobic part, enriched in proline and glycine (residues 4–20), followed by a negatively charged part (residues 21–45). In contrast, the green algal PsbQ sequences have an accumulation of positively and negatively charged amino acids instead of the hydrophobic part. Based on the knowledge that the N-terminal region of PsbQ is essential for its binding to PSII [22], and that the binding properties between the higher- plant and algal PsbQs are different, i.e. the former requires PsbP but not the latter [15], the hydrophobic part (amino acids 4–20) may be responsible for the different behaviour of the higher plant and green algal PsbQ when binding to the lumenal side of PSII.
The presence of a single tryptophan in the sequence permits analysis of its environment by using fluorescence spectroscopy techniques. Based on the classification by Burstein et al. [71], the fluorescence emission maximum of PsbQ at 327 nm, and a full-width at half maximum value of 53 nm, suggest that the tryptophan residue, as a type-I, is located in the protein core, but still in a polar microenvi- ronment. According to the classification by Vivian et al.
Although PsbQ is proposed to have a role in maintaining an optimal concentration of Cl– in PSII, the 3D model for PsbQ adds little information about binding. Based on the difference in the pI of (cid:5)4.5–5 units between the N-terminal and C-terminal domains of PsbQ, we suggest that, when using extrinsic polypeptide-reconstituted PSII particles, the low requirement of NaCl is caused by the ability of the C-terminal region of PsbQ to electrostatically attract Cl– and keep it in the neighbourhood of the oxygen-evolving complex. In addition, PsbQ can also play a role in maintaining the overall stability of PSII. PsbQ has been reported to be thermostable, with a melting point of (cid:5) 65 (cid:2)C [74]. This is compatible with some of the features found in the PsbQ sequence. PsbQ favors Arg (5.4%), but avoids the thermolabile Cys and His in all its sequence and Pro (except Pro72) in its four a-helices. The respective frequency of these residues is related to the thermostability of the proteins [75], suggesting that PsbQ could fulfil these requisites. Moreover, salt bridges formed between residues that are relatively close to each other in the sequence are also known to stabilize proteins [76]. Particularly, PsbQ has several Arg and Lys residues sequentially close to Glu and Asp residues, which could form salt bridges (i.e. Arg27 and Glu28, Glu36 and Arg37, Glu47 and Arg51, Glu67 and Arg68, Lys102 and Glu106, Asp100 and Lys101, Asp130 and Lys131). This, again, favours the suggestion that PsbQ is a thermostable protein. PsbP has also been suggested to be thermostable [77] and, intriguingly, PsbU and PsbV are proposed to play a role in the thermoprotection of PSII proteins [11,12].
3D Structural analysis of PsbQ (Eur. J. Biochem. 270) 3925
(cid:1) FEBS 2003
All in all, PsbQ, in conjunction with PsbP, could play a functional role in keeping Ca2+ and Cl– bound to the oxygen-evolving complex, but also a structural role in maintaining the overall (thermo)stability of PSII.
13. Enami, I., Kikuchi, S., Fukuda, T., Ohta, H. & Shen, J.R. (1998) Binding and functional properties of four extrinsic proteins of photosystem II from a red alga, Cyanidium caldarium, as studied by release-reconstitution experiments. Biochemistry 37, 2787– 2793.
14. Enami, I., Yoshihara, S., Tohri, A., Okumura, A., Ohta, H. & Shen, J.R. (2000) Cross-reconstitution of various extrinsic proteins and photosystem II complexes from cyanobacteria, red algae and higher plants. Plant Cell Physiol. 41, 1354–1364.
In conclusion, the 3D model for PsbQ suggests that the C-terminal domain has a four-helical bundle folding. The N-terminal domain is predicted to be flexible without a defined 3D structure. The absorption and fluorescence analyses of PsbQ have revealed the microenvironment of tyrosine the tryptophan residue and the exposure of residues to the solvent. The experimental results support the 3D model proposed for PsbQ as an up/down four- helical bundle with the single Trp semiburied at the end of the bundle structure.
15. Suzuki, T., Minagawa, J., Tomo, T., Sonoike, K., Ohta, H. & Enami, I. (2003) Binding and functional properties of the extrinsic proteins in oxygen-evolving photosystem II particle from a green alga, Chlamydomonas reinhardtii having his-tagged CP47. Plant Cell Physiol. 44, 76–84.
A 3D coordinates file (1NZE.pdb) corresponding to native PsbQ protein from spinach has been released on the PDB database on 26 August 2003. Both the experimental and theoretical structures are in very good agreement, giving an average Root Mean Square Deviation value of 1.45 A˚ .
16. Tohri, A., Suzuki, T., Okuyama, S., Kamino, K., Motoki, A., Hirano, M., Ohta, H., Shen, J.R., Yamamoto, Y. & Enami, I. (2002) Comparison of the structure of the extrinsic 33 kDa protein from different organisms. Plant Cell Physiol. 43, 429–439.
17. Nield, J., Orlova, E.V., Morris, E.P., Gowen, B., van Heel, M. & Barber, J. (2000) 3D map of the plant photosystem II super- complex obtained by cryoelectron microscopy and single particle analysis. Nat. Struct. Biol. 7, 44–47.
Acknowledgements
18. Nield, J., Balsera, M., De Las Rivas, J. & Barber, J. (2002) Three- dimensional electron cryo-microscopy study of the extrinsic domains of the oxygen-evolving complex of spinach: assignment of the PsbO protein. J. Biol. Chem. 277, 15006–15012.
We thank members of the Protein Design Group (CNB-CSIC) for technical assistant and helpful comments. This study was supported by funds from the Spanish Ministry of Science and Technology (project PB1998-0480) and the V European Union Framework Programme. M. Balsera holds a fellowship from the Spanish Ministry of Science and Technology.
19. Henmi, T., Yamasaki, H., Sakuma, S., Tomakawa, Y., Tamura, N., Shen, J.R. & Yamamoto, Y. (2003) Dynamic interaction between the D1 protein, CP43 and OEC33 at the lumenal side of photosystem II in spinach chloroplasts: evidence from light- induced cross-linking of the proteins in the donor-side photo- inhibition. Plant Cell Physiol. 44, 451–456.
References
1. Barber, J. (2003) Photosystem II: the engine of life. Q. Rev. Bio- phys. 36, 71–89. 20. Boekema, E.J., Nield, J., Hankamer, B. & Barber, J. (1998) Localization of the 23-kDa subunit of the oxygen-evolving com- plex of photosystem II by electron microscopy. Eur. J. Biochem. 252, 268–276. 2. Barber, J. & Ku¨ hlbrandt, W. (1999) Photosystem II. Curr. Opin. Struct. Biol. 9, 469–475.
21. Miyao, M., Fujimara, Y. & Murata, N. (1988) Partial degradation of the extrinsic 23-kDa protein of the photosystem II complex of spinach. Biochim. Biophys. Acta 936, 465–474. 3. Hankamer, B., Barber, J. & Boekema, E.J. (1997) Structure and membrane organization of photosystem II in green plants. Annu. Rev. Plant Physiol. Plant Mol. Biol. 48, 641–671. 4. Rhee, K. (2001) Photosystem II: the solid structural era. Annu. Rev. Biophys. Biomol. Struct. 30, 307–328. 22. Kuwabara, T., Murata, T., Miyao, M. & Murata, N. (1986) Partial degradation of the 18-kDa protein of the photosynthetic oxygen-evolving complex: a study of a binding site. Biochim. Biophys. Acta 146, 146–155.
5. Zouni, A., Witt, H.T., Kern, J., Fromme, P., Krauß, N., Saenger, W. & Orth, P. (2001) Crystal structure of photosystem II from Synechococcus elongatus at 3.8 A˚ resolution. Nature 409, 739–743. 23. Shen, J.R., Ikeuchi, M. & Inoue, Y. (1997) Analysis of the psbU gene encoding the 12-kDa extrinsic protein of photosystem II and studies on its role by deletion mutagenesis in Synechocystis sp. PCC 6803. J. Biol. Chem. 272, 17821–17826. 24. Ghanotakis, D.F., Babcock, G.T. & Yocum, C.F. 6. Kamiya, N. & Shen, J.R. (2003) Crystal structure of oxygen- evolving photosystem II from Thermosynechococcus vulcanus at 3.7-A˚ resolution. Proc. Natl Acad. Sci. USA 100, 98–103. 7. Rutherford, A.W. (1989) Photosystem II, the water-splitting (1984) Calcium reconstitutes high rates of oxygen evolution in polypep- tide depleted photosystem II preparations. FEBS Lett. 167, 127–130. enzyme. Trends Biochem. Sci. 14, 227–232.
8. Goussias, C., Boussac, A. & Rutherford, A.W. (2002) Photo- system II and photosynthetic oxidation of water: an overview. Philos. Trans. R. Soc. Lond. B Biol. Sci. 357, 1369–1381. 9. Homann, P.H. (2002) Chloride and calcium in photosystem II: from effects to enigma. Photosynth. Res. 73, 169–175. 25. Ljungberg, U., Jansson, C., Andersson, B. & A˚ kerlund, H.E. (1983) Reconstitution of oxygen evolution in high-salt washed photosystem II particles. Biochim. Biophys. Acta 113, 738–744. 26. Hillier, W., Hendry, G., Burnap, R.L. & Wydrzynski, T. (2001) Substrate water exchange in photosystem II depends on the peri- pheral proteins. J. Biol. Chem. 50, 46917–46924. 10. Seidler, A. (1996) The extrinsic polypeptides of photosystem II. Biochim. Biophys. Acta 1277, 35–60.
27. Miyao, M. & Murata, N. (1985) The Cl– effect on photosynthetic oxygen evolution: interaction of Cl– with 18-kDa, 24-kDa and 33-kDa proteins. FEBS Lett. 180, 303–308.
11. Nishiyama, Y., Hayashi, H., Watanabe, T. & Murata, N. (1994) Photosynthetic oxygen evolution is stabilized by cytochrome c550 against heat inactivation in Synechococcus sp. PCC 7002. Plant Physiol. 105, 1313–1319.
28. Ifuku, K. & Sato, F. (2002) A truncated mutant of the extrinsic 23-kDa protein that absolutely requires the extrinsic 17-kDa protein for Ca2+ retention in photosystem II. Plant Cell Physiol. 43, 1244–1249. 29. Anderson, J.M. (2001) Does functional photosystem II complex have an oxygen channel? FEBS Lett. 488, 1–4. 12. Nishiyama, Y., Los, D.A., Hayashi, H. & Murata, N. (1997) Thermal protection of the oxygen-evolving machinery by PsbU, an extrinsic protein of photosystem II. Synechococcus species PCC 7002. Plant Physiol. 115, 1473–1480.
3926 M. Balsera et al. (Eur. J. Biochem. 270)
(cid:1) FEBS 2003
49. Jones, D.T., Taylor, W.R. & Thornton, J.M. (1992) A new approach to protein fold recognition. Nature 358, 86–89. 30. Vander Meulen, K.A., Hobson, A. & Yocum, C.F. (2002) Cal- cium depletion modifies the structure of the photosystem II O2-evolving complex. Biochemistry 41, 958–966.
50. Kelley, L.A., MacCallum, R.M. & Sternberg, M.J.E. (2000) Enhanced genome annotation using structural profiles in the program 3D-PSSM. J. Mol. Biol. 299, 499–520.
31. Vrettos, J.S., Stone, D.A. & Brudvig, G.W. (2001) Quantifying the ion selectivity of the Ca2+ site in photosytem II: evidence for direct involvement of Ca2+ in O2 formation. Biochemistry 40, 7937–7945.
51. Shi, J., Blundell, T.L. & Mizuguchi, K. (2001) FUGUE: sequence- structure homology recognition using environment-specific substitution tables and structure-dependent gap penalties. J. Mol. Biol. 310, 243–257.
32. Wincencjusz, H., Yocum, C.F. & van Gorkom, H.J. (1999) Activating anions that replace Cl– in the O2-evolving complex of photosystem II slow the kinetics of the terminal step in water oxidation and destabilize the S2 and S3 states. Biochemistry 38, 3719–3725.
52. Alexandrov, N.N., Nussinov, R. & Zimmer, R.M. (1995) Fast protein fold recognition via sequence to structure alignment and contact capacity potentials. In Pacific Symposium on Biocomputing 96 (Lawrence, H. & Teri, E.K., eds), pp. 53–72. World Scientific Publishing Co, Singapore.
33. Campbell, K.A., Gregor, W., Pham, D.P., Peloquin, J.M., Debus, R.J. & Britt, R.D. (1998) The 23 and 17 kDa extrinsic proteins of photosystem II modulate the magnetic properties of the S1-state manganese cluster. Biochemistry 37, 5039–5045.
53. Fischer, D. (2000) Hybrid fold recognition: Combining sequence derived properties with evolutionary information. In Pacific Symposium on Biocomputing (Altman, R.B., Dunker, A.K., Hunter, L., Lauderdale, K. & Klein, T.E., eds), pp. 119–130. World Scientific Publishing, Hawaii. 54. Holm, L. & Sander, C. (1996) Mapping the protein universe. 34. Pazos, F., Heredia, P., Valencia, A. & de las Rivas, J. (2001) Threading structural model of the manganese-stabilizing protein PsbO reveals the presence of two possible b-sandwich domains. Proteins 45, 372–381. Science 273, 595–602.
55. Pazos, F., Rost, B. & Valencia, A. (1999) A platform for integrating threading results with other information. Bioinfor- matics 15, 1062–1063. 35. Sawaya, M.R., Krogmann, D.W., Serag, A., Ho, K.K., Yeates, T.O. & Kerfeld, C.A. (2001) Structures of cytochrome c-549 and cytochrome c6 from the cyanobacterium Arthrospira maxima. Biochemistry 40, 9215–9225.
structure of
36. Frazao, C., Enguita, F.J., Coelho, R., Sheldrick, G.M., Navarro, J.A., Hervas, M., De la Rosa, M.A. & Carrondo, M.A. (2001) low-potential cytochrome c-549 from Crystal Synechocystis sp. PCC 6803 at 1.21 A˚ resolution. J. Biol. Inorg. Chem. 6, 324–332. 56. Higgins, D., Thompson, J., Gibson, T., Thompson, J.D., Higgins, D.G. & Gibson, T.J. (1994) CLUSTAL W: improving the sensitivity of progressive multiple sequence alignment through sequence weighting, position-specific gap penalties and weight matrix choice. Nucleic Acids Res. 22, 4673–4680.
57. Sander, C. & Schneider, R. (1991) Database of homology-derived structures and the structural meaning of sequence alignment. Proteins 9, 56–68. 58. Guex, N., Diemand, A. & Peitsch, M.C. (1999) Protein modelling 37. Balsera, M., Arellano, J.B., Gutie´ rrez, J.R., Heredia, P., Revuelta, J.L. & De Las Rivas, J. (2003) Structural analysis of the PsbQ protein of photosystem II by Fourier transform infrared and circular dichroic spectroscopy and by bioinformatic methods. Biochemistry 42, 1000–1007. for all. Trends Biochem. Sci. 24, 364–367. 59. Vriend, G. (1990) WHAT IF: a molecular modelling and drug design program. J. Mol. Graph. 8, 52–56. 38. Berthold, D.A., Babcock, G.T. & Yocum, C.F. (1981) A highly resolved oxygen-evolving photosystem II preparation from spi- nach thylakoid membranes. FEBS Lett. 134, 231–234.
60. Peitsch, M.C. (1996) ProMod and Swiss-Model: Internet-based tools for automated comparative protein modelling. Biochem. Soc. Trans. 24, 274–279.
39. Arellano, J.B., Schro¨ der, W.P., Sandmann, G., Chueca, A. & Baro´ n, M. (1994) Removal of nuclear contaminants and non- specifically photosystem II-bound copper from photosystem II preparations. Physiol. Plant. 91, 369–374. 61. Lu¨ thy, R., Bowie, J.U. & Eisenberg, D. (1992) Assessment of protein models with three-dimensional profiles. Nature 256, 83–85.
62. Pazos, F., Helmer-Citterich, M., Ausiello, G. & Valencia, A. (1997) Correlated mutations contain information about protein– protein interaction. J. Mol. Biol. 271, 511–523.
40. Arnon, D.I. (1949) Copper enzymes in isolated chloroplasts: polyphenol-oxidase in Beta vulgaris. Plant Physiol. 24, 1–15. 41. Laemmli, U.K. (1970) Cleavage of structural proteins during the assembly of the head of bacteriophage T4. Nature 227, 680–685. 42. Gill, S.C. & von Hippel, P.H. (1989) Calculation of protein extinction coefficients from amino acid sequence data. Anal. Biochem. 182, 319–326. 63. Olmea, O., Rost, B. & Valencia, A. (1999) Effective use of sequence correlation and conservation in fold recognition. J. Mol. Biol. 295, 1221–1239.
43. Ragone, R., Colonna, G., Balestrieri, C., Servillo, L. & Irace, G. (1984) Determination of tyrosine exposure in proteins by second- derivative spectroscopy. Biochemistry 23, 1871–1875. 64. Jegerscho¨ ld, C., Arellano, J.B., Schro¨ der, W.P., van Kan, P.J.M., Baro´ n, M. & Styring, S. (1995) Cu (II) inhibition of the electron transfer through photosystem II studied by EPR spectroscopy. Biochemistry 34, 12747–12754.
44. Lehrer, S.S. (1971) Solute perturbation of protein fluorescence. The quenching of the tryptophan fluorescence of model compounds and of lysozyme by iodide ion. Biochemistry 10, 3254– 3263. 65. Kuwabara, T. & Suzuki, K. (1994) A prolyl endoproteinase that acts specifically on the extrinsic 18-kDa protein of photosystem II: purification and further characterization. Plant Cell Physiol. 35, 665–675.
45. Eftink, M.R. & Ghiron, C.A. (1976) Exposure of tryptophanyl residues in proteins: quantitative determination by fluorescence quenching studies. Biochemistry 15, 672–680. 46. Eftink, M.R. & Ghiron, C.A. (1981) Fluorescence quenching studies with proteins. Anal. Biochem. 114, 199–227. 66. Pearce, S.F. & Hawrot, E. (1990) Intrinsic fluorescence of binding- site fragments of the nicotinic acetylcholine receptor: perturba- tions produced upon binding alpha-bungarotoxin. Biochemistry 29, 10649–10659. 47. Lacowicz, J.R. (1999) Principles of Fluorescence Spectroscopy, 2nd edn. Kluwer Academic/Plenum Publishers, New York. 67. Eftink, M.R. (1991) Fluorescence quenching. In Topics in Fluor- escence Spectroscopy, Vol. II (Lacowicz, J.R., ed.), pp. 53–85. Plenum Press, New York.
68. Pearl, F.M., Bennett, C.F., Bray, J.E., Harrison, A.P., Martin, N., Shepherd, A., Sillitoe, I., Thornton, J. & Orengo, C.A. (2003) The 48. Rychlewski, L., Jaroszewski, L., Li, W. & Godzik, A. (2000) Comparison of sequence profiles. Strategies for structural predic- tions using sequence information. Protein Sci. 9, 232–241.
3D Structural analysis of PsbQ (Eur. J. Biochem. 270) 3927
(cid:1) FEBS 2003
CATH database: an extended protein family resource for structural and functional genomics. Nucleic Acids Res. 31, 452–455.
Fourier transform infrared spectroscopy. J. Mol. Struct. 513, 127–132. 75. Kumar, S., Tsai, C.J. & Nussinov, R. (2000) Factors enhancing protein thermostability. Protein Eng. 13, 179–191. 69. Hamada, K., Bethge, P.H. & Mathews, F. (1995) Refined struc- ture of cytochrome b562 from Escherichia coli at 1.4 A˚ resolution. J. Mol. Biol. 247, 947–962. 76. Kumar, S. & Nussinov, R. (1999) Salt bridge stability in mono- meric proteins. J. Mol. Biol. 293, 1241–1255.
70. Li, X., Romero, P., Rani, M., Dunker, A.K. & Obradovic, Z. (1999) Predicting protein disorder for N-, C-, and internal regions. Genome Inform. 10, 30–40.
77. Zhang, H., Ishikawa, Y., Yamamoto, Y. & Carpentier, R. (1998) Secondary structure and thermal stability of the extrinsic 23-kDa protein of photosystem II studied by Fourier transform infrared spectroscopy. FEBS Lett. 426, 347–351. 71. Burstein, E.A., Vedenkina, N.S. & Ivkova, M.N. (1973) Fluores- cence and the location of tryptophan residues in protein molecules. Photochem. Photobiol. 18, 263–279. 72. Vivian, J.T. & Callis, P.R. (2001) Mechanisms of tryptophan
Supplementary material
fluorescence shifts in proteins. Biophys. J. 80, 2093–2109.
The following material is available from http://www. blackwellpublishing.com/products/journals/suppmat/EJB/ EJB3774/EJB3774sm.htm Table S1. PDB coordinates for the PsbQ model.
73. Paliakasis, C.D. & Kokkinidis, M. (1992) Relationships between sequence and structure for the four-alpha-helix bundle tertiary motif in proteins. Protein Eng. 5, 739–748.
74. Zhang, H., Yamamoto, Y., Ishikawa, Y. & Carpentier, R. (1999) Characterization of the secondary structure and thermostability of the extrinsic 16 kilodalton protein of spinach photosystem II by