Spectroscopic characterization of the isolated heme-bound PAS-B domain of neuronal PAS domain protein 2 associated with circadian rhythms Ryoji Koudo1, Hirofumi Kurokawa1, Emiko Sato1, Jotaro Igarashi1, Takeshi Uchida2, Ikuko Sagami1*, Teizo Kitagawa2 and Toru Shimizu1
1 Institute of Multidisciplinary Research for Advanced Materials, Tohoku University, Sendai, Japan 2 Okazaki Institute for Integrative Bioscience, National Institutes of Natural Sciences, Okazaki, Japan
Keywords circadian rhythms; heme-sensor protein; PAS domain; resonance Raman spectroscopy; transcription
Correspondence T. Shimizu, Institute of Multidisciplinary Research for Advanced Materials, Tohoku University, 2-1-1 Katahira, Aoba-ku, Sendai 980-8577, Japan Fax: +81 22 217 5604 ⁄ 5390 Tel: +81 22 217 5604 ⁄ 5605 E-mail: shimizu@tagen.tohoku.ac.jp
*Present address Graduate School of Agriculture, Kyoto Prefectural University, Nakaragi-cho 1-5, Shimogamo, Sakyo-ku, Kyoto 606-8522, Japan
(Received 24 March 2005, revised 15 June 2005, accepted 20 June 2005)
doi:10.1111/j.1742-4658.2005.04828.x
Neuronal PAS domain protein 2 (NPAS2) is an important transcription factor associated with circadian rhythms. This protein forms a heterodimer with BMAL1, which binds to the E-box sequence to mediate circadian rhythm-regulated transcription. NPAS2 has two PAS domains with heme- binding sites in the N-terminal portion. In this study, we overexpressed wild-type and His mutants of the PAS-B domain (residues 241–416) of mouse NPAS2 and then purified and characterized the isolated heme- bound proteins. Optical absorption spectra of the wild-type protein showed that the Fe(III), Fe(II) and Fe(II)–CO complexes are 6-co-ordinated low- spin complexes. On the other hand, resonance Raman spectra indicated that both the Fe(III) and Fe(II) complexes contain mixtures of 5-co-ordi- nated high-spin and 6-co-ordinated low-spin complexes. Based on inverse correlation between mFe-CO and mC-O of the resonance Raman spectra, it appeared that the axial ligand trans to CO of the heme-bound PAS-B is His. Six His mutants (His266Ala, His289Ala, His300Ala, His302Ala, His329Ala, and His335Ala) were generated, and their optical absorption spectra were compared. The spectrum of the His335Ala mutant indicated that its Fe(III) complex is the 5-co-ordinated high-spin complex, whereas, like the wild-type, the complexes for the five other His mutants were 6-co-ordinated low-spin complexes. Thus, our results suggest that one of the axial ligands of Fe(III) in PAS-B is His335. Also, binding kinetics sug- gest that heme binding to the PAS-B domain of NPAS2 is relatively weak compared with that of sperm whale myoglobin.
Circadian rhythms are composed of complicated feed- back loops [1–10]. In the suprachiasmatic nucleus, two proteins, CLOCK and BMAL1, form a heterodimer that binds to a specific DNA sequence named the E-box, which is located in the promoter region of genes associated with clock oscillation, for example Per and Cry. The binding of the CLOCK-BMAL1 het-
erodimer to the E-box initiates transcription, and the translated proteins, in turn, negatively regulate the ini- tial transcription, thus constituting a feedback loop. A very similar type of feedback regulation is thought to function in the forebrain [11], wherein a transcription protein named neuronal PAS protein 2 (NPAS2), in place of CLOCK, forms a heterodimer with BMAL1.
FEBS Journal 272 (2005) 4153–4162 ª 2005 FEBS
4153
Abbreviations BJ FixL, a heme-binding oxygen sensor kinase, FixL, from Bradyrhizobium japonicum; HIF2a, hypoxia-inducible factor 2a; NPAS2, neuronal PAS domain protein 2; PAS, acronym formed from the names of Drosophila-period clock protein (PER), vertebrate aryl hydrocarbon receptor nuclear translocator (ARNT) and Drosophila single-minded protein (SIM).
R. Koudo et al. Spectra of PAS-B of NPAS2
The NPAS2–BMAL1 heterodimer binds to the E-box and initiates transcription associated with circadian rhythms. A mouse knockout of NPAS2 adapts poorly to restricted feeding and becomes severely ill [12].
hemin. It was then treated with thrombin to eliminate the His tag. Undigested His-tagged protein was removed by Ni ⁄ nitrilotriacetate ⁄ agarose column chro- matography. The yield of PAS-B protein was 1.6 mgÆL)1 culture. Heme-free PAS-B was also expressed and purified in the absence of hemin. Titration experi- ments with hemin demonstrated that purified PAS-B has one binding site per protein with a heme to protein ratio of 1 : 0.91. We estimated the spectral dissociation constant using concentrations of free heme in the solu- tion to be (cid:1) 2 lm (Fig. S1 in Supplementary material). Quantification of heme by the pyridine hemochromo- gen method [16] confirmed that heme-saturated PAS-B contains 1.23 hemes per monomer.
Optical absorption spectra
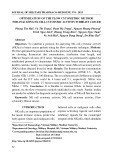
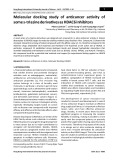
Figure 1A shows the optical absorption spectra of Fe(III), Fe(II), and Fe(II)–CO complexes of heme- bound wild-type PAS-B. Optical absorption spectra of a His335Ala mutant are also shown in Fig. 1B, which
transcription. Also,
NPAS2 is an 816-amino-acid protein composed of a basic–helix–loop–helix (bHLH) domain (residues 1–77), two heme-bound PAS domains, PAS-A (resi- dues 78–240) and PAS-B (residues 241–354), and a C-terminal nuclear receptor association region [resi- dues 665–680 for human NPAS2 (or MOP4)] [13]. Both the PAS-A and PAS-B domains contain heme- binding sites [13]. Transcription caused by binding of the NPAS2–BMAL1 heterodimer is hampered by CO, an axial heme ligand [13]. Therefore, it is likely that CO binding to the heme in NPAS2 may impair het- erodimer formation or its DNA binding. In addition, heme biosynthesis has been reported to correlate with the circadian clock system [15]. However, as NPAS2 has two heme-binding sites, it is unclear which heme contributes more to the binding of CO and the inhibi- tion of the heme environment, including the axial ligands and heme-binding proper- ties of the apo-NPAS2 protein, is not known.
A
B
In this study, we attempted to characterize the heme-binding environment of the isolated PAS-B domain of NPAS2. Four PAS-B domains with differ- ent sequences were expressed in Escherichia coli. The most stable PAS-B domain binds one molecule of heme per molecule of protein, but the domain appeared to form a large multimer (larger than a hexa- mer) in both the presence and absence of heme. Opti- cal absorption spectra of both Fe(III) and Fe(II) complexes indicate that both are 6-co-ordinated low- spin complexes. Based on Raman spectra, one of the axial ligands appeared to be His. Site-directed muta- genesis indicated that His335 is one of the axial ligands for heme in the isolated PAS-B protein.
Results
Protein expression and purification
We attempted to express four types of the PAS-B domain with different lengths corresponding to amino- acid residues 160–346, 218–416, 218–346, and 241–416. Only the PAS-B domain with residues 241–416 was properly overexpressed and folded in E. coli and dis- played sufficient heme-binding affinity. Therefore, we used the protein consisting of residues 241–416 for further studies on the structure and function of the PAS-B domain.
Fig. 1. Optical absorption spectra of Fe(III) (bold solid lines), Fe(II) (thin solid lines), and Fe(II)–CO (broken lines) complexes of the wild-type (A) and His335Ala mutant (B) proteins. Spectra were obtained in 100 mM Tris ⁄ HCl (pH 7.5). Spectra of the His266Ala, His289Ala, His300Ala, His329Ala mutants were essentially the same as that of the wild-type protein.
His-tagged PAS-B was expressed in E. coli cells and purified as a heme-bound protein in the presence of
FEBS Journal 272 (2005) 4153–4162 ª 2005 FEBS
4154
R. Koudo et al. Spectra of PAS-B of NPAS2
Table 1. Optical absorption spectra (nm) of the wild-type and His mutant proteins of the isolated heme-bound PAS-B domain of NPAS2. Cyt b5, Cytochrome b5; Cyt b562, cytochrome b562; Sw Mb, sperm whale metmyoglobin.
Fe(III) Fe(II) Fe(II)CO
Proteins Soret Visible Soret Visible Soret Visible Reference
424 529, 557
420 426 420 420 421 421 421 420 536, 571 530, 561 536, 561 535, 564 537, 564 538, 562 539, 568 542, 567 536 530, 561 539 538 534 536 534 536 533, 562 527, 556 530, 558 531, 559 530, 558 530, 559 559 525, 556 This work [14] This work This work This work This work This work This work [19] Wild-type Wild-type His266Ala His289Ala His300Ala His302Ala His329Ala His335Ala Cyt b5
230, 564 531, 562 [19] Cyt b562
Sw Mb 505, 635 [20] 423 542, 579 425 424 426 425 426 421 423 (His ⁄ His 6cLS) 427 (His ⁄ Met6 cLS) 434 (His 5cHS) 556 (His ⁄ CO 6cLS) 419 426 418 419 416 417 414 395 412 (His ⁄ His 6cLS) 418 (His ⁄ Met 6cLS) 410 (His ⁄ H2O 6cLS)
will be discussed in the last part of Results. Table 1 summarizes the spectral maxima of the wild-type and His mutant PAS-B complexes. The Soret peaks of the Fe(III) and Fe(II) complexes of wild-type PAS-B are located at 419 and 424 nm, respectively. Comparison with other 6-co-ordinated low-spin heme proteins sug- gested that Fe(III), Fe(II), and Fe(II)–CO wild-type PAS-B complexes are also 6-co-ordinated low-spin complexes. In addition, the results implied that His is probably one of the axial ligands of wild-type PAS-B.
Resonance Raman spectra
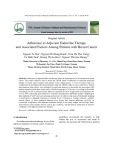
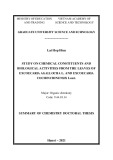
Fig. 2. Resonance Raman spectra (excited at 413 cm)1) of Fe(III) (bottom), Fe(II) (middle), and Fe(II)-CO (top) complexes of PAS-B.
To further understand the heme environment of PAS- B, resonance Raman spectra were obtained and com- pared with those of other hemoproteins. Resonance Raman spectra of wild-type PAS-B heme complexes in the high-frequency region are shown in Fig. 2 and sum- marized in Table 2. Bands at 1373 and 1359 cm)1 for the Fe(III) and Fe(II) complexes of PAS-B, respectively, were assigned to redox-sensitive m4. In the Fe(III) PAS- B complex, the spin-state and co-ordination-state mar- ker band, m3, was located at 1468 and 1502 cm)1, suggesting the presence of 6-co-ordinated high-spin and low-spin complexes, respectively [21]. Two m3 bands observed at 1470 and 1492 cm)1 for the Fe(II) PAS-B complex represent 5-co-ordinated high-spin and 6-co- ordinated low-spin complexes, respectively. Upon bind- ing of CO to the Fe(II) complex, the m3 band shifted to 1498 cm)1, and the presence of a band at 1467 cm)1 indicated partial photodissociation of CO from heme.
13C18O-PAS-B,
The CO-isotope dependences of
the
are shown in Fig. 3. The lower and middle spectra in the 300–700 cm)1 region in the left panel and the 1700–2000 cm)1 region in the right panel represent 12CO16O-PAS-B and respectively, whereas the upper spectra in both panels show the
resonance Raman spectra of the Fe(II)–CO complex of PAS-B
FEBS Journal 272 (2005) 4153–4162 ª 2005 FEBS
4155
R. Koudo et al. Spectra of PAS-B of NPAS2
Table 2. Resonance Raman spectra of Fe(III) and Fe(II) complexes of PAS-B.
Proteins State m4 m3
Fe(III) Fe(II) Fe(II)–CO 1373 1359 1372 1468 ⁄ 1502 1470 ⁄ 1492 1467 ⁄ 1498 6cHS ⁄ 6cLS 5cHS ⁄ 6cLS 5cHS ⁄ 6cLS
to apo-PAS-B. The spectral change monitored at 420 nm was composed of fast (73%) and slow (27%) phases (Fig. 5B). The rate constant of the fast phase for the heme association was dependent on the apo- protein concentration (Fig. 5C), and the rate constant of even the fast phase, 7.7 · 105 m)1Æs)1, was lower than those of other heme-binding proteins (Table 3). Note that SOUL and p22HBP are tentatively consid- ered to be heme-transporting proteins, but their phy- siological roles are not yet certain.
We also determined the dissociation rate of heme from Fe(III) PAS-B by adding an excess of the His64- Tyr ⁄ Val68Phe apomyoglobin mutant [18]. The forma- tion of Fe(III)-bound myoglobin was monitored by following the increase in A410 (Fig. 6). The spectral change was also composed of fast (32%) and slow (68%) phases. The rate of the major slow change, 3.0 · 10)4 s)1, is one order of magnitude lower than those of other hemoproteins (Table 3).
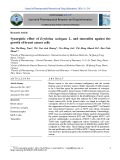
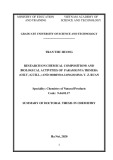
isotope difference. It is clear from the difference spec- tra that the 497-cm)1 and 1961-cm)1 bands of 12C16O- PAS-B are shifted to 489 and 1864 cm)1, respectively, upon binding of 13C18O. Accordingly, we assigned the 497-cm)1 and 1961-cm)1 bands to the mFe-CO and mC-O modes, respectively. In Fig. 3 (left panel), the Fe-C-O bending mode, mFe-C-O, was also identified at 577 cm)1. Figure 4 shows inverse correlations between mFe-C and mC-O observed in the resonance Raman spectra. The plot for PAS-B falls on the line of the histidine- co-ordinated heme proteins, indicating a His-Fe-CO 6-co-ordinated adduct with PAS-B.
Site-directed mutagenesis
Heme association and dissociation
As shown in Fig. 5A, we obtained the association rate constant for binding of the Fe(II)–CO heme complex
His is probably the ligand trans to CO in the PAS-B Fe(II)–CO complex. To identify which His is the axial ligand, we examined the conserved His residues in sequence alignments of PAS-B and PAS-A of NPAS2,
FEBS Journal 272 (2005) 4153–4162 ª 2005 FEBS
4156
Fig. 3. Resonance Raman spectra (excited at 413 cm)1) of the Fe(II)–CO complex of isolated PAS-B in the low (left) and high (right) fre- quency regions. The lower spectra are of the Fe(II)–12C16O complexes, the middle spectra are of the Fe(II)–13C18O complexes, and the upper spectra are difference spectra between those of the 12C16O and 13C18O complexes.
R. Koudo et al. Spectra of PAS-B of NPAS2
A
Inverse correlations between mFe-C vs. mC-O in resonance
B
Fig. 4. Raman spectra.
C
spectrum of
the
PAS-B of hypoxia-inducible factor 2a (HIF2a), and the heme-binding PAS domains of BJ FixL and Ec DOS (Fig. S2 in Supplementary material). However, the sequence alignments indicated that, except for His302 in PAS-B of NPAS2, the His residues are not well conserved in the heme-binding PAS domains. Optical absorption and resonance Raman spectral ana- lyses suggested that PAS-B Fe(III) is a 6-co-ordinated complex similar to PAS-A. In PAS-A NPAS2, His119 and Cys170 should be the axial ligands of the Fe(III) complex, whereas His119 and His171 should be the axial ligands for the Fe(II) complex [31]. We examined the effects of mutating six His residues in PAS-A cor- responding to those between His119 and His171 and those spanning the Hb-sheet. Thus, we generated the following mutants: His335Ala, His266Ala, His289Ala, His300Ala, His302Ala, and His329Ala. As summarized in Table 1, only the His335Ala mutant had an optical absorption spectrum different from the wild-type. For example, the Fe(III) His302Ala mutant (data not shown) was essentially the same as that of the Fe(III) wild-type (Fig. 1A), whereas that of the Fe(III) His335Ala mutant (Fig. 1B) was distinct and indicated a 5-co-ordinated high-spin Fe(III) com- plex. Therefore, the results suggest that His335 is one of the axial ligands of heme for both the Fe(III) and Fe(II) PAS-B proteins.
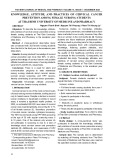
Fig. 5. Changes in the optical absorption spectra accompanying the association of CO-heme (0.5 lM) with heme-free PAS-B (3 lM) upon mixing in a stopped-flow spectrometer (A). The spectral chan- ges at 420 nm are shown in (B), and the correlation between kobs and the concentration of isolated heme-free PAS-B is shown in (C). The spectral change was composed of fast (73%) and slow (27%) phases, and the kobs values were taken from the fast phase.
Discussion
In this study, we characterized the isolated heme- bound PAS-B domain of NPAS2 and identified His335 as one of the axial ligands. We found that the isolated PAS-B domain from NPAS2 forms a large multimer (larger than a hexamer; see Experimental procedures), even though SDS ⁄ PAGE indicates that the protein is shown). more than 95% homogeneous
(data not
Although the PAS-B domain of the intact NPAS2 pro- tein may play a critical role in heterodimer formation with BMALl, the multimer found in this study appears to be an artifact due to the truncation. Nevertheless, optical absorption spectra of the isolated PAS-B domain indicate one species for the Fe(III), Fe(II), and Fe(II)–CO complexes. Resonance Raman spectra indi- cate an apparent mixture of 5-co-ordinated high-spin
FEBS Journal 272 (2005) 4153–4162 ª 2005 FEBS
4157
R. Koudo et al. Spectra of PAS-B of NPAS2
Table 3. Association and dissociation rate constants for heme bind- ing to the isolated PAS-B domain and other heme proteins. Note that kon values were obtained for the Fe(II)–CO complex, whereas koff values were obtained for the Fe(III) complex. SOUL, a hexa- meric heme-binding protein expressed in the retina and pineal gland; p22HBP, a heme-binding protein isolated from mammalian liver; Sw Mb, sperm whale metmyoglobin.
)1Æs)1)
Proteins Reference kon (M koff (s)1)
PAS-B This work
Fig. 7. Constructs of PAS-B domains generated in this study. The PAS-B construct containing residues 241–416 had appropriate heme-binding affinity, whereas the PAS-B constructs consisting of amino acids 160–346, 218–416, and 218–346 had low heme-binding affinity and were much less stable than PAS-B containing residues 241–416. SOUL p22HBP Sw Mb [21] [21] [17, 18] 7.7 · 105 (fast: 73%) < 105 (slow: 27%) 1.9 · 106 1.0 · 108 7.6 · 107 3.2 · 10)3 (fast: 32%) 3.0 · 10)4 (slow: 68%)) 6.1 · 10)3 4.4 · 10)3 8.4 · 10)7
A
B
Fig. 6. Changes in the optical absorption spectra accompanying the dissociation of heme from isolated PAS-B and association with the H64Y ⁄ V68F apomyoglobin mutant (A). The formation of Fe(II)–myo- globin was monitored by measuring the increase in A410 in the mix- ture of Fe(III)–PAS-B and H64Y ⁄ V68F apomyoglobin (B).
found that bHLH-PAS-A-PAS-B domains. They absorption peaks of Fe(III) PAS-B are located at 426, 530 and 561 nm, and those of Fe(II)–CO PAS-B are located at 426, 530 and 561 nm. These spectral max- ima are different from those that we found (Table 1). This discrepancy may be due, in part, to differences in the method used to prepare the isolated domains. Dioum et al. prepared the isolated domains by dena- turation of an insoluble suspension of E. coli cells overexpressing the protein and then subsequently refolding the protein in the presence of heme. In con- trast, our method does not use denaturation–refolding procedures. Furthermore, our PAS-B protein contains amino acids 241–416, whereas that of Dioum et al. is composed of residues 160–346, which contain part of the PAS-A domain and lack part of the C-terminus of PAS-B (Fig. 7). These differences in protein prepar- ation and domain architecture may result in differences in spectroscopic parameters. We also attempted to overexpress and isolate PAS-B with different amino- acid residues (i.e. residues 160–346, 218–416, or 218– 346; Fig. 7), but we found that they had very low heme-binding affinities, were much less stable, and had lower expression than the PAS-B protein containing amino acids 241–416 (our unpublished observations). Recent crystal and solution structures of PAS proteins and analysis sequence homologies have shown that residues between amino acids 347 and 354 of mouse NPAS2, which were absent in the studies by Dioum et al. make up part of the core of the PAS-B domain [27,28]. Therefore, the lack of these residues in the study by Dioum et al. may have led to instability of their protein [14].
and 6-co-ordinated low-spin complexes in the Fe(III) and Fe(II) states. Two phases were found for heme association and dissociation processes, which may reflect heterogeneity of the oligomeric states.
Dioum et al.
[14] first reported heme-binding and spectroscopic characteristics of the isolated PAS-B domain as well as those of the bHLH-PAS-A and
Dioum et al. [14] also examined heme dissociation from the bHLH-PAS-A-PAS-B domain. However, because the protein they examined has two heme-bind- ing sites, it is difficult to obtain independent values for
FEBS Journal 272 (2005) 4153–4162 ª 2005 FEBS
4158
R. Koudo et al. Spectra of PAS-B of NPAS2
heme binding to each PAS domain. The present study is the first report of heme binding and dissociation kinetic values of the isolated PAS-B domain.
the Hb and Ib sheets [33]. NMR analysis of PAS-B of HIF2a has also suggested that the Hb-sheets and Ib-sheets interact with ARNT in heterodimer forma- tion [28]. Therefore, the turn between Hb-sheets and Ib-sheets appears to play a critical role in various func- tions of PAS proteins, including the interaction of NPAS2 with BMAL1.
Recent structural studies of heme-bound PAS pro- teins suggest that ligand binding or a change in the heme redox state causes profound structural changes in the heme environment [22,23]. These structural changes in the heme-bound PAS domain are trans- mitted to the functional domain to regulate catalysis or DNA binding for transcription. Structural changes in the PAS domain of phototropins induced by light have also been reported [24,25]. PAS domains are probably very flexible in solution and change their conformation in response to external signals, allowing them to transmit the signal to downstream transducer proteins [26].
Interestingly,
The PAS domain is critical for the ability of PAS proteins to bind other proteins [27,28]. The small chemical compound-binding sites and the flexibility of the PAS domain have been examined by NMR spectr- oscopy [29,30]. However, the specific role of the PAS-B domain of NPAS2 remains elusive. In separate studies, we have found that the heme-binding affinity of the isolated PAS-A domain is much higher than that of the isolated PAS-B domain (our unpublished results). We speculate therefore that the heme in the PAS-A domain plays a more important role than the PAS-B domain in the regulation of transcription by CO. In addition, the possible redox-dependent ligand switch- ing of the PAS-B domain could modulate heterodimer formation with BMAL1, leading to altered transcrip- tion.
Although CO binding to the NPAS2–BMAL1 hetero- dimer abolishes its ability to promote transcription, the binding of CN, NO, or O2 to the heterodimer could promote heme-dependent transcription, but whe- ther PAS-B is involved in the regulation of transcrip- tion by these ligands remains to be determined.
it has been suggested that PAS-A, a heme-binding PAS domain in NPAS2, has His119 and Cys170 as axial ligands in the Fe(III) complex and that ligand switching occurs from Cys170 to His171 upon the reduction of heme [31]. Therefore, it is possible that axial ligand switching of the heme in PAS-B also occurs upon a change in redox state [23] because the His335 mutation affected the Fe(III) form but not the Fe(II) form. Because Fe(II)–CO heme was used to evaluate heme binding and Fe(III) heme was used to study heme dissociation, the large discrepancy between the heme-binding rate constant ((cid:1) 3 s)1) and the heme dissociation rate constant (3 · 10)4 s)1; Table 3) sug- ligand switching may occur upon a gest that axial change in redox state. Also, His residues that we did not examine by site-directed mutagenesis could be additional axial ligands for heme in PAS-B.
Further studies are needed to address the specific role of the hemes in PAS-B and PAS-B in heterodimer formation with BMAL1, DNA binding, and transcrip- tional inhibition by CO [14].
Experimental procedures
Materials
His300 of PAS-B in NPAS2 is conserved in the PAS proteins examined (Fig. S2, Supplementary material). However, the corresponding His of Ec DOS, His83, is not the axial ligand; rather, the axial ligand is His77. Therefore, it is possible that co-ordination of heme by PAS-B and PAS-A of NPAS2 is different from that in Ec DOS.
Mouse brain was obtained from C57BL ⁄ 6 mice. An mRNA purification kit was purchased from Amersham Biosciences (Uppsala, Sweden), and an RT-PCR kit was purchased from Roche Diagostics Japan (Tokyo, Japan). Oligonucleo- tides were synthesized at the Nihon Gene Research Labor- atory (Sendai, Japan). The cloning vector, pBluescript SK II(+), was purchased from Toyobo (Osaka, Japan), and the expression vector, pET28a(+), was from Novagen (Darmstadt, Germany). E. coli competent cells XL1-blue for cloning were purchased from Novagen, and BL21- CodonPlus(DE3)-RIL cells for protein expression were from Stratagene (La Jolla, CA, USA). Restriction and modifying enzymes for DNA recombination were pur- chased from Takara Shuzo Co. (Otsu, Japan), Toyobo, New England Biolabs (Beverly, MA, USA), and Roche
Based on amino-acid alignments (Fig. S2, Supple- mentary material), it appears that His335 of PAS-B in NPAS2 is located at a turn between the Hb- and Ib-sheets. This His is not conserved in the heme-bind- ing PAS proteins. If the PAS-B domain functions only in the heme binding, then it can be speculated that the regulation of transcription by NPAS2 may be modula- ted not only by CO binding but also by the redox state of the heme iron. In this regard, structural changes dependent on oxygen binding were observed at the same turn between the Hb-sheets and Ib-sheets of Ec DOS [32]. For BJ FixL, it has been suggested that CO binding regulates intermolecular interactions through
FEBS Journal 272 (2005) 4153–4162 ª 2005 FEBS
4159
Diagnostics Japan. All other chemicals were purchased from Wako Pure Chemicals (Osaka, Japan).
R. Koudo et al. Spectra of PAS-B of NPAS2
Construction of NPAS2 PAS-B expression plasmid
The His-tagged NPAS2 PAS-B expression plasmid was cre- ated by subcloning into the pET28a(+) expression vector. The cDNAs encoding the full-length mouse NPAS2 PAS-B domain (residues 241–416) was generated by RT-PCR using mouse brain RNA. The primers for RT-PCR were 5¢- CGGGATCCCATATGTGTGTTAGCTGACG-3¢ and 5¢- ACGCGTCGACTTAGTGGGAACTCCTTGAG-3¢. The sequences of the products were confirmed using a DSQ- 2000 L automatic sequencer (Shimadzu Co., Kyoto, Japan) and subcloned into the NdeI and SalI sites of the E. coli expression vector, pET28a(+), which introduces a His6 tag at the N-terminus of expressed proteins.
To
create
for 2 min (three times with a 2-min interval between each pulse) on ice using a UD-201 ultrasonic disruptor (Tomy Seiko, Tokyo, Japan). Apo-PAS-B in crushed cells was reconstituted with heme by incubating it with buffer A con- taining 100 lm heme. After centrifugation at 142 000 g for 35 min at 4 (cid:1)C, ammonium sulfate was added to the result- ing supernatant up to 50% saturation. Precipitates were collected and then dissolved in buffer A. The solution was passed through a Sephadex G-25 column (4 · 20 cm) pre- equilibrated with buffer A. The eluted solution was applied to a Ni ⁄ nitrilotriacetate ⁄ agarose column pre-equilibrated with buffer B (50 mm sodium phosphate, pH 7.8, 50 mm NaCl, and 2 mm 2-mercaptoethanol). The column was washed with sequential steps of buffer B containing 20 and 50 mm imidazole. The NPAS2 PAS-B protein was then eluted with buffer A containing 100 mm imidazole. The protein fractions were pooled and concentrated. The buffer in the collected protein was exchanged with 100 mm Tris ⁄ HCl (pH 8.0) using a HiTrap desalting column (Amer- sham Biosciences). The purified protein was quickly frozen in liquid nitrogen and stored at )80 (cid:1)C. Protein concen- trations were determined using the CBB dye binding method (Nacalai Tesque, Kyoto, Japan), and heme content was determined by the pyridine hemochromogen method [16].
the His266Ala, His289Ala, His300Ala, His302Ala, His329Ala, and His335Ala mutants of NPAS2 PAS-B, PCR-based mutagenesis was performed using the from Stratagene using QuikChange mutagenesis kit pET28a(+) containing wild-type NPAS2 PAS-B cDNA as a template. The primers used for mutations were as fol- lows:
Removal of His tag by digestion with thrombin
His-tagged NPAS2 PAS-B was incubated with 2 eq heme for 3 h at 0 (cid:1)C in 100 mm Tris ⁄ HCl buffer (pH 8.0). Excess heme was then removed using a Bio-Gel P-6 column (Bio-Rad, Hercules, CA, USA) under the same buffer con- ditions. Thrombin protease [10 UÆ(mg NPAS2 PAS-B protein))1] was added to the heme-saturated His-tagged NPAS2 PAS-B and incubated for 4 h at 16 (cid:1)C. The solu- tion was then applied to a Ni ⁄ nitrilotriacetate column pre-equilibrated with 100 mm Tris ⁄ HCl (pH 8.0). The flow- through fractions were collected as purified NPAS2 PAS-B lacking the His tag.
5¢-ATTTCTGGATGCCAGAGCTCCTCCAATC-3¢ and for 5¢-GATTGGAGGAGCTCTGGCATCCAGAAAT-3¢ the His266Ala mutant, 5¢-GGCTACGACTACTACGC CATTGATGACC-3¢ and 5¢-GGTCATCAATGGCGTAG TAGTCGTAGCC-3¢ for the His289Ala mutant, 5¢-CTGG CCAGGTGCGCCCAGCATCTGATG-3¢ and 5¢-CATCA GATGCTGGGCGCACCTGGCCAG-3¢ for the His300Ala mutant, 5¢-GTGCCACCAGGCTCTGATGCAGTTTGG-3¢ and 5¢-CCAAACTGCATCAGAGCCTGGTGGCAC-3¢ for the His302Ala mutant, 5¢-GGTTGCAAACCGCCTACTA CATCACCTAC-3¢ and 5¢-GTAGGTGATGTAGTAGGC GGTTTGCAACC-3¢ for the His329Ala mutant, and 5¢- CTACATCACCTACGCCCAATGGAACTCC-3¢ and 5¢- GGAGTTCCATTGGGCGTAGGTGATGTAG-3¢ for the His335Ala mutant.
The insertion of
these mutations was confirmed by
Size exclusion column chromatography
sequencing.
Protein expression and purification
We used size-exclusion chromatography, Superdex 75, for evaluation of the oligomeric state of the purified protein. Apparent molecular masses determined for both heme-bound and heme-free PAS-B proteins were higher than 120 kDa.
Optical absorption spectra
Optical absorption spectra were collected under aerobic conditions using a Shimadzu UV-2500 and a Shimadzu Multi Spec 1500 spectrophotometer maintained at 25 (cid:1)C. To ensure that the temperature of the solution was appro- the reaction mixture was incubated for 10 min priate,
His-tagged NPAS2 PAS-B was expressed in E. coli BL21- CodonPlus(DE3)-RIL cells. When the A600 reached 0.6, protein expression was induced by adjusting the culture to 0.05 mm isopropyl b-d-thiogalactopyranoside and incuba- ting for 20–24 h. The E. coil cells expressing NPAS2 PAS-B were suspended in buffer A (50 mm sodium phosphate, pH 7.8, 50 mm NaCl, 1 mm EDTA, 1 mm dithiothreitol, 1 mm phenylmethanesulfonyl fluoride, 2 lgÆmL)1 aprotinin, 2 lgÆmL)1 leupeptin, 2 lgÆmL)1 pepstatin, and 2 mm 2-mercaptoethanol) and were crushed by pulsed sonication
FEBS Journal 272 (2005) 4153–4162 ª 2005 FEBS
4160
before spectroscopic measurements. Experiments were per- formed at least three times for each complex.
reactions were carried out, absorbance time course data were collected at a single wavelength (410 nm) as des- cribed previously [18].
R. Koudo et al. Spectra of PAS-B of NPAS2
Heme quantification
Acknowledgements
To quantify heme, 10 lm protein was treated with 30% (v ⁄ v) pyridine in 0.1 m NaOH, after which a few grains of sodium dithionite were added. The heme concentration was calculated from the difference in A556 and A540 and using an absorption coefficient of 22.1 mm)1Æcm)1 [16].
This work was supported in part by Grants-in-Aid from the Ministry of Education, Culture, Sports, Sci- ence and Technology of Japan (to T. S. and H. K.). We thank Dr John S. Olson (Rice University) for kindly providing the expression plasmid for His64- Tyr ⁄ Val64Phe apomyoglobin.
Resonance Raman measurements
References
1 Hogenesch JB, Gu YZ, Jain S & Brandfield CA (1998) The basic-helix-loop-helix-PAS orphan MOPs forms transcriptionally active complexes with circadian and hypoxia factors. Proc Natl Acad Sci USA 95, 5474– 5479.
2 Rutter J, Reick M, Wu LC & McKnight SL (2001) Regulation of Clock and NPAS2 DNA Binding by the Redox State of NAD Cofactors. Science 293, 510–514.
3 Reppert SM & Weaver DR (2002) Coordination of cir-
cadian timing in mammals. Nature 418, 935–941. 4 Isojima Y, Okumura N & Nagai K (2003) Molecular mechanism of mammalian circadian clock. J Biochem (Tokyo) 134, 777–784.
The Fe(III)–PAS-B complex (25 lm in 100 mm Tris ⁄ HCl, pH 8.0) was placed in an airtight spinning cell with a rubber septum and reduced by the addition of sodium dithionite (10 mm final concentration). 12C16O or 13C18O (Cambridge Isotope Laboratories, Andover, MA, USA) gas was introduced into the Raman cell with an airtight syr- inge. Raman scattering was excited at 413.1 nm with a Kr ion laser (BeamLok 2060; Spectra-Physics, Mountain View, CA, USA). The excitation light was focused into the cell at a laser power of 5 mW for the Fe(III) and Fe(II) com- plexes. For the Fe(II)–CO complexes, to avoid photolysis, the laser power was 0.1–0.2 mW. Raman spectra were detected with a N2-cooled CCD camera (Spec10: 400BLN; Roper Scientific, Inc., Trenton, NJ, USA) attached to a sin- gle polychromator (SPEX750M; Jobin Yvon, Longjumeau, France). Raman shifts were calibrated with indene, acetone, CCl4, and an aqueous solution of ferrocyanide.
5 Green CB & Menaker M (2003) Clock on the brain.
Science 301, 319–320.
6 Van Gelder RN, Herzog ED, Schwartz WJ & Taghert
Stopped-flow measurements
PH (2003) Circadian rhythms: in the loop at last. Science 300, 1534–1535.
7 Schibler U (2003) Liver regeneration clocks on. Science
302, 234–235.
Stopped-flow absorbance measurements for obtaining heme association rate constants were conducted using an RSP- 1000 stopped-flow apparatus (Unisoku, Osaka, Japan) maintained at 25 (cid:1)C. Association of CO-heme with heme- free PAS-B was monitored at 420 nm. The reaction was ini- tiated by mixing with excess apoprotein. Data were fitted using the data analysis program Igor-Pro (Wavemetrics, Inc., Oswego, OR, USA) [17].
8 Oishi K, Miyazaki K, Kadota K, Kikuno R, Nagase T, Atsumi G, Ohkura N, Azama T, Mesaki M, Yokimasa S, et al. (2003) Genome-wide expression analysis of mouse liver reveals CLOCK-regulated circadian output genes. J Biol Chem 278, 41519–41527.
Heme dissociation experiments
cuvettes
9 Hirayama J, Namura H, Ishikawa T, Kobayashi Y & Todo T (2003) Functional and structural analyses of cryptochrome: vertebrate Cry regions responsible for interaction with the Clock:BMAL heterodimer and its nuclear locations. J Biol Chem 278, 35620–35628. 10 Brandstaetter R (2004) Circadian lessons from peri-
pheral clocks: is the time of the mammalian pacemaker up? Proc Natl Acad Sci USA 101, 5699–5700.
11 Reick M, Garcia JA, Dudley C & McKnight SL (2001) NPAS2: an analog of Clock operative in the mamma- lian forebrain. Science 293, 506–509.
12 Dudley CA, Erbal-Sieler C, Estill SJ, Reick M, Franken P, Pitts S & McKnight SL (2003) Altered patterns of
in All heme dissociation experiments were carried out 1-cm path length, 1-mL volume containing 800 lL of reaction mixture at 25 (cid:1)C. For most experi- ments, this mixture consisted of 0.15 m potassium phos- (pH 7.0), 0.45 m sucrose, 30 lm apomyoglobin phate His64Tyr ⁄ Val68Phe, and 3.0 lm stock PAS-B holoprotein solution. The pH values of these reaction mixtures never deviated more than 0.02 pH unit from that of the original solution. The reactions were initiated by adding holopro- tein to the buffer ⁄ apomyoglobin mixture. When multiple
FEBS Journal 272 (2005) 4153–4162 ª 2005 FEBS
4161
sleep and behavioral adaptability in NPAS2-deficient mice. Science 301, 379–383.
mon structural and common flexibility. J Biol Chem 278, 18434–18439.
13 McNamara P, Seo SP, Rudic RD, Sehgal A,
Chakravarti D & FitzGerald GA (2001) Regulation of CLOCK and MOP4 by nuclear hormone receptors in the vasculature: a humoral mechanism to reset a peri- pheral clock. Cell 105, 877–889.
27 Yildiz O¨ , Doi M, Yujnovsky I, Cardone L, Berndt A, Henning S, Schulze S, Urbanke C, Sassone-Corsi P & Wolf E (2005) Crystal structure and interactions of the PAS repeat region of the Drosophila clock protein, PERIOD. Mol Cell 17, 69–82.
14 Dioum EM, Rutter J, Tuckerman JR, Gonzalez G,
Gilles-Gonzalez MA & McKnight SL (2002) NPAS2: a gas-responsive transcription factor. Science 298, 2385– 2339.
15 Kaasik K & Lee CC (2004) Reciprocal regulation of
28 Erbel PJA, Card PB, Karakuzu O, Bruick RK & Gard- ner KH (2003) Structural basis for PAS domain hetero- dimerization in the basic-helix-loop-helix-PAS transcription factor hypoxia-inducible factor. Proc Natl Acad Sci USA 100, 15504–15509.
29 Amezcua CA, Harper SM, Rutter J & Gardner KH
haem biosynthesis and the circadian clock in mammals. Nature 430, 467–471.
16 Klatt P, Schmidt K, Werner ER & Mayer B (1996)
(2002) Structure and interactions of PAS kinase N-term- inal PAS domain: model for intramolecular kinase regu- lation. Structure 10, 1349–1361.
Determination of nitric oxide synthase cofactors: heme, FAD, FMN, and tetrahydrobiopterin. Methods Enzymol 268, 358–365.
17 Hargrove MS, Barrick D & Olson JS (1996) The asso-
30 Holdeman TC & Gardner KH (2001) 1H, 13C and 15N chemical shift assignment of the N-terminal PAS domain of mNPAS2. J Biomol NMR 21, 383–384.
31 Uchida T, Sato E, Sato A, Sagami I, Shimizu T & Kita-
ciation rate constant for heme binding to globin is inde- pendent of protein structure. Biochemistry 35, 11293– 11299.
18 Hagrove MS, Singleton EW, Quillin ML, Qrtiz LA,
gawa T (2005) CO-dependent activity controlling mechanism of heme-containing CO-sensor protein, NPAS2. J Biol Chem 280, 21358–21368.
32 Park H, Suquet C, Satterlee JD & Kang CH (2004)
Phillips GN, Jr Mathews AJ & Olson JS (1994) His64 (E7)–Tyr apomyoglobin as a reagent for measuring rates of hemin dissociation. J Biol Chem 269, 4207–4214. 19 Mathews FS (2001) b-Type cytochrome electron car-
Insights into signal transduction involving PAS domain oxygen-sensing heme proteins from the X-ray crystal structure of Escherichia coli Dos heme domain (Ec DosH). Biochemistry 43, 2738–2746.
33 Key J & Moffat K (2005) Crystal structures of deoxy
riers: cytochromes b562 and b5, and Flavocytochrome b2. In Handbook of Metalloproteins (Messer-Schmidt A, Huber R, Poulos T & Wieghardt K, eds), vol. 1, pp. 159–171. John Wiley & Sons, Chichester.
and CO-bound bjFixLH reveal details of ligand recogni- tion and signaling. Biochemistry 44, 4627–4635. 34 Yoshimura T, Sagami I, Sasakura Y & Shimizu T
20 Antonini E & Brunori M (1971) Hemoglobin and Myo- globin in Their Reactions with Ligands. Elsevier ⁄ North- Holland Biomedical Press, Amsterdam.
21 Sato E, Sagami I, Uchida T, Sato A, Kitagawa T,
(2003) Relationships between heme incorporation, tetra- mer formation, and catalysis of a heme-regulated phos- phodiesterase from Escherichia coli: a study of deletion and site-directed mutants. J Biol Chem 278, 53105– 53111.
R. Koudo et al. Spectra of PAS-B of NPAS2
Supplementary material
Igarashi J & Shimizu T (2004) SOUL in mouse eye is a new hexameric heme-bound protein with characteristic optical absorption, resonance Raman spectral, and heme-binding properties. Biochemistry 43, 14189–14198. 22 Jain R & Chan MK (2003) Mechanisms of ligand discri- mination by heme proteins. J Biol Inorg Chem 8, 1–11.
23 Kurokawa H, Lee DS, Watanabe M, Sagami I, Mikami B, Raman CS & Shimizu T (2004) A redox-controlled molecular switch revealed by the crystal structure of a bacterial heme PAS sensor. J Biol Chem 279, 20189– 20193.
24 Harper SM, Neil LC & Gardner KH (2003) Structural basis of a phototropin light switch. Science 301, 1541– 1544.
25 Crosson S & Moffat K (2001) Structure of flavin-bind- ing plant photoreceptor domain: insights into light- mediated signal transduction. Proc Natl Acad Sci USA 98, 2995–3000.
The following material is available online. Fig. S1. Spectral changes caused by adding heme to apo-PAS-B. The spectral change was composed of two phases. It is difficult to estimate the exact dissociation constants from the two phases. We tentatively estima- ted the apparent spectral dissociation constant to be (cid:1) 2 lm. Fig. S2. Sequence alignments of PAS-B and PAS-A of NPAS2, PAS-B of HIF2a, a heme-binding PAS domain of BJ FixL and PAS-A of Ec DOS. Amino acids at 266, 289, 300, 302, 329, and 335 with bold H of PAS-B of NPAS2 were mutated to Ala in this study. The secondary structure is based on the solution structure of HIF2a PAS-B domain [28].
26 Vreede J, van der Horst MA, Hellingwerf KJ, Crielaard W & and van Aalten DMF (2003) PAS domains: com-
FEBS Journal 272 (2005) 4153–4162 ª 2005 FEBS
4162