
281
International Journal of Innovative Research and Scientific Studies, 5(4) 2022, pages: 281-288
ISSN: 2617-6548
URL: www.ijirss.com
Static Analysis and Machine Learning-based Malware Detection System using PE Header
Feature Values
Chang Keun Yuk1, Chang Jin Seo2*
1Department of Electronic Information System Engineering, Sangmyung University, South Korea.
2Department of Information Security Engineering, Sangmyung University, South Korea.
*Corresponding author: Chang Jin Seo (Email: cjseo@smu.ac.kr)
Abstract
Advances in information and communications technology (ICT) are improving daily convenience and productivity, but new
malware threats continue to surge. This paper proposes a malware detection system using various machine learning
algorithms and portable executable (PE) Header file static analysis method for malware code, which has recently changed in
various forms. Methods/Statistical analysis: This paper proposes a malware detection method that quickly and accurately
detects new malware using static file analysis and stacking methods. Furthermore, using information from PE headers
extracted through static analysis can detect malware without executing real malware. The features of the pe_packer used in
the proposed research method were most efficient in experiments because the extracted data were processed in various ways
and applied to machine learning models. So, we chose pe_packer information as the shape data to be used for the stacking
model. Detection models are implemented based on additive techniques rather than single models to detect with high
accuracy. Findings: The proposed detection system can quickly and accurately classify malware or ordinary files. Moreover,
experiments showed that the proposed method has a 95.2% malware detection rate and outperforms existing single model-
based detection systems. Improvements/Applications: The proposed research method applies to detecting large new strains
of malware.
Keywords: Benign, Machine learning, Malware detection, PE header, Staking method, Static analysis.
DOI: 10.53894/ijirss.v5i4.690
Funding: This study received no specific financial support.
History: Received: 29 June 2022/Revised: 9 September 2022/Accepted: 26 September 2022/Published: 5 October 2022
Copyright: © 2022 by the authors. This article is an open access article distributed under the terms and conditions of the Creative
Commons Attribution (CC BY) license (https://creativecommons.org/licenses/by/4.0/).
Authors’ Contributions: Both authors contributed equally to the conception and design of the study.
Competing Interests: The authors declare that they have no competing interests.
Transparency: The authors confirm that the manuscript is an honest, accurate, and transparent account of the study; that no vital
features of the study have been omitted; and that any discrepancies from the study as planned have been explained.
Ethical: This study followed all ethical practices during writing.
Publisher: Innovative Research Publishing
1. Introduction
With the development of information industry technology, daily convenience and productivity in the industrial field have
been obtained, but security threats have simultaneously increased. As information technology, such as big data and the

International Journal of Innovative Research and Scientific Studies, 5(4) 2022, pages: 281-288
282
Internet of Things (IoT), advances rapidly, the use of the Internet is indispensable. Thus, cyber-attack and security are not
just an issue in a personal computer, but expanded to a network and even the entire infrastructure, they can have a significant
effect on our daily living. Malicious code is at the heart of this problem. Malicious code accesses user's devices to cause
various problems such as personal information leakage, unauthorized remote control, network traffic generation, degradation
of system performance and financial loss. According to the AV-TEST statistics, the total number of threats by new malware
was 137.47 million as of 2018 for Microsoft Windows OS, which meant 4.4 threats per second. In the recent three years, the
total number of malware threats was 719.15 million in 2017, 856.62 million in 2018, and 1,001.52 million in 2019, which
verified the increasing trend [1]. To detect malware, signature-based or heuristic-based methods are most widely used [2].
The signature-based method detects malware by analyzing signatures made from malware behavior rules or unique binary
forms by the analysis personnel. The heuristic-based method detects malware by comparing the similarity of the code. The
heuristic-based method has been used to overcome the drawback of the signature-based method, but it is vulnerable to the
increase in false-positive rate. In addition, since the heuristic-based method detects malware from data extracted from the set
of collected malware, it is difficult to respond to variant malware or a zero-day attack immediately. To overcome this
limitation, a method to detect malware using artificial intelligence (AI) has been studied. The AI area has been spotlighted in
recent years in many applications, including AlphaGo, autonomous driving, and chatbot, etc. Samsung SDS (Samsung Data
System) tested the detection rates of signature-based and AI-based anti-virus methods. The result showed that the false
positive rate of signature-based anti-virus was 93.8%, whereas AI-based anti-virus was 0% in the variant malware area. In
addition, the AI-based anti-virus also recorded around 1% of the false-positive rate in execution files and ransomware other
than document-type files [3]. As such, studies on AI-based malware detection technology have been actively conducted to
overcome the limitation of existing malware detection methods. There are three types of feature data extraction methods of
malware. Automation analysis uses an automation platform such as a sandbox, dynamic analysis that focuses on actual
running code and behavior while executing malware, and static analysis that obtains information by analyzing malware binary
files without executing them. The static analysis method is relatively more straightforward and faster than other methods to
get general information about the characteristics of malicious programs. In particular, it has little risk of infection because it
does not execute programs directly. Thus, this study proposes a method to learn, analyze, and detect malware files by applying
the portable executable (PE) header feature values to the stacking method after data pre-processing using the static analysis
method targeting malicious and normal files.
2. Related Work
The study by Ha, et al. [4] statically analyzed imported dynamic link libraries (DLLs) inside the PE headers and
application programming interface (API) features and employed the analysis results to detect malware. To check the feature
performance, a deep neural network (DNN) model was used. Features that were rapid and lighted while detecting malware
were selected after identifying the emergence ratio between malware and normal files by extracting the DLL/API information.
The machine learning results were comparatively analyzed, which exhibited that by only using the static analysis the accuracy
was over 91% in API and 86% in DLL. Their study did not use all PE header information, but only employed DLL and API
features. Furthermore, machine learning was used not to improve malware detection accuracy but to find useful features to
detect malware from the DLL/API information and verify the features. Ahmadi, et al. [5] studied the malware challenge data
provided by Microsoft using the XGBoost model and then classified them into families according to malware features. It
employed five byte-based features and eight disassembly-based features extracted from the PE headers through data static
analysis. The experiment was conducted with cross-validation. It showed more than 95% accuracy in most training features,
and when all features were composed of training data, it showed 99% accuracy, which showed the best performance.
However, their study employed only 13 features extracted from PE headers. It proposed a method to classify distinguished
characteristics according to malware into families based on the grouping of the characteristics rather than detecting malware
files. The study by Lee, et al. [6] analyzed the multi-classification performance of ensemble models after configuring the
API/DLL features of training data for the family classification of malware. The PE import address table (IAT) was analyzed
to extract API/DLL information, and pre-processing was conducted by analyzing assembly code. Tree-based algorithms such
as XGBoost and random forest were used as a model to train malware. Binary classification experiments of normal and
malware and multi-classification investigation of malware families were conducted. The experiment was conducted with
cross-validation. In the performance comparison, the malware detection rate was 93% when using random forest. The
classification accuracy of malware families was 92% when using XGBoost, and the test’s false positive rate that included
benign code was 3.5%. Their study should define the list of APIs in advance to employ the features of the APIs, and feature
values became scarce regardless of classes if the name in the list would be different due to Windows operating systems update
or function name change. Thus, detection models based on API features are not appropriate to be used for a long time. These
study trends show that features are extracted based on various information that can be statically extracted, and machine
learning is used to detect malware. However, classification models were implemented using only part of the information
obtained from PE files or employing only machine single learning models. In the present study PE headers and opcode feature
data, which can be obtained using the static analysis method to rapidly detect a large amount of generated malware with less
consuming resources, are extracted and employed as feature data. In addition, this study employs the stacking method that
mixes and uses a single model, which is different from other ensemble methods, to raise the accuracy of malware file detection
and reduce the false-positive rate.
3. Proposed Method
The malware detection system proposed in this study consists of the following steps: data preprocessing, feature

International Journal of Innovative Research and Scientific Studies, 5(4) 2022, pages: 281-288
283
extraction, model learning, and model evaluation. Figure 1 shows the flow of the malware detection system used in the
experiment.
Figure 1.
System configuration diagram of the proposed method.
3.1. Data Preprocessing and Feature Extraction
PE files refer to execution files, DLLs, font files, and object code. etc., which are used in the Windows operating systems.
Information needed in PE files is mostly present in the header section in the PE structure. To extract the features of the PE
header, a script provided by the open-source project of Classification of Malware with PE headers (ClaMP) was used [7].
Using this script, a total of 60 raw features were extracted as follows: six from Disk Operating System (DOS) headers, 17
from file headers, 37 from optional headers and seven derived features. The derived features refer to features where
meaningful information is extracted by processing PE header values one more time. In this study, extracted PE headers were
processed using three methods and tested to find the optimal performance features:
1. Since the packer_type column in the extracted PE header contains the categorical data, pe_header features were
generated by removing the column.
2. Pe_packer features were generated by the one-hot encoding of the same column. Figure 2 shows the one-hot encoding
of typical four data types in the packer_type column.
3. Pe_top features were generated using Pearson's correlation coefficient.
Figure 3 shows the overall pe_header features by visualizing the correlation coefficients. Here, only 45 columns,
including e_cblp, which have a range of correlation coefficients from 0.0 to 0.3 with the class, were separately extracted and
used as the pe_top features.
Figure 2.
Example of one-hot encoding method used to process pe_packer features.
Features from the PE header and the actual code in the data area were extracted. After locating the code portion, opcode
data, which is a byte, was converted to assembly code. The converted code's feature was extracted using the N-gram analysis.
N-gram is a natural language processing method that extracts a continuous sequence of N elements from a given set of strings.
It ties N continuous opcodes and recognizes it as a single pattern, thereby counting the same patterns. The data scarcity
problem may occur when N is more significant and the size of the pattern is more significant, resulting in a decrease in the
probability of counting. Thus, this study tested the case only when N is three or four. The patterns of opcode 3-gram or 4-
gram were extracted, and only the patterns whose pattern count was one of the top 100 from a single file were separately
extracted to be used as feature values.
To evaluate the optimal combination from the extracted features, the extracted features were put into many classification
algorithms and tested. The classification algorithms used in the test were logistic regression, support vector machine (SVM),

International Journal of Innovative Research and Scientific Studies, 5(4) 2022, pages: 281-288
284
random forest, and XGBoost. The data for feature extraction were 15,000 learning data files provided by the 2018 information
protection research and development (R&D) Data Challenge AI-based malware detection track. Of the total, 80% of them
were used in learning, while 20% were used in testing.
Table 1.
Learning results of the extracted features using the classification algorithms.
Model data
LR
SVM
RF
XGB
AVG
pe_header
0.709
0.710
0.940
0.934
0.823
pe_packer
0.709
0.710
0.944
0.935
0.825
pe_top
0.708
0.710
0.928
0.920
0.817
4gram
0.744
0.736
0.805
0.812
0.774
3gram
0.774
0.731
0.824
0.820
0.787
pe_4gram
0.691
0.697
0.910
0.932
0.808
pe_3gram
0.692
0.697
0.909
0.924
0.805
Figure 3.
Visualizing correlation coefficients for pe_top features.
The features of pe_3gram and pe_4gram are features of single data by combining pe_packer and N-gram features by
column. As presented in the learning results of Table 1, the average accuracy of the PE header processed features was higher
than that of single N-gram features. In addition, the accuracy of the pe_packer feature created by adding packer information,
which was made by the one-hot encoding of the packer_type column, was higher than that of the pe_header feature. The
highest accuracy was found when the pe_packer feature was applied to the XGBoost model in terms of the best accuracy
International Journal of Innovative Research and Scientific Studies, 5(4) 2022, pages: 281-288
285
criterion. In contrast with the N-gram feature, which had a case that cannot be extracted depending on files, all Windows
programs had PE headers because PE headers provided information about the program overall. Thus, the pe_packer features,
which can be extracted from all files had higher accuracy than other features, were selected as the final feature used in the
modeling.
3.2. Model Learning
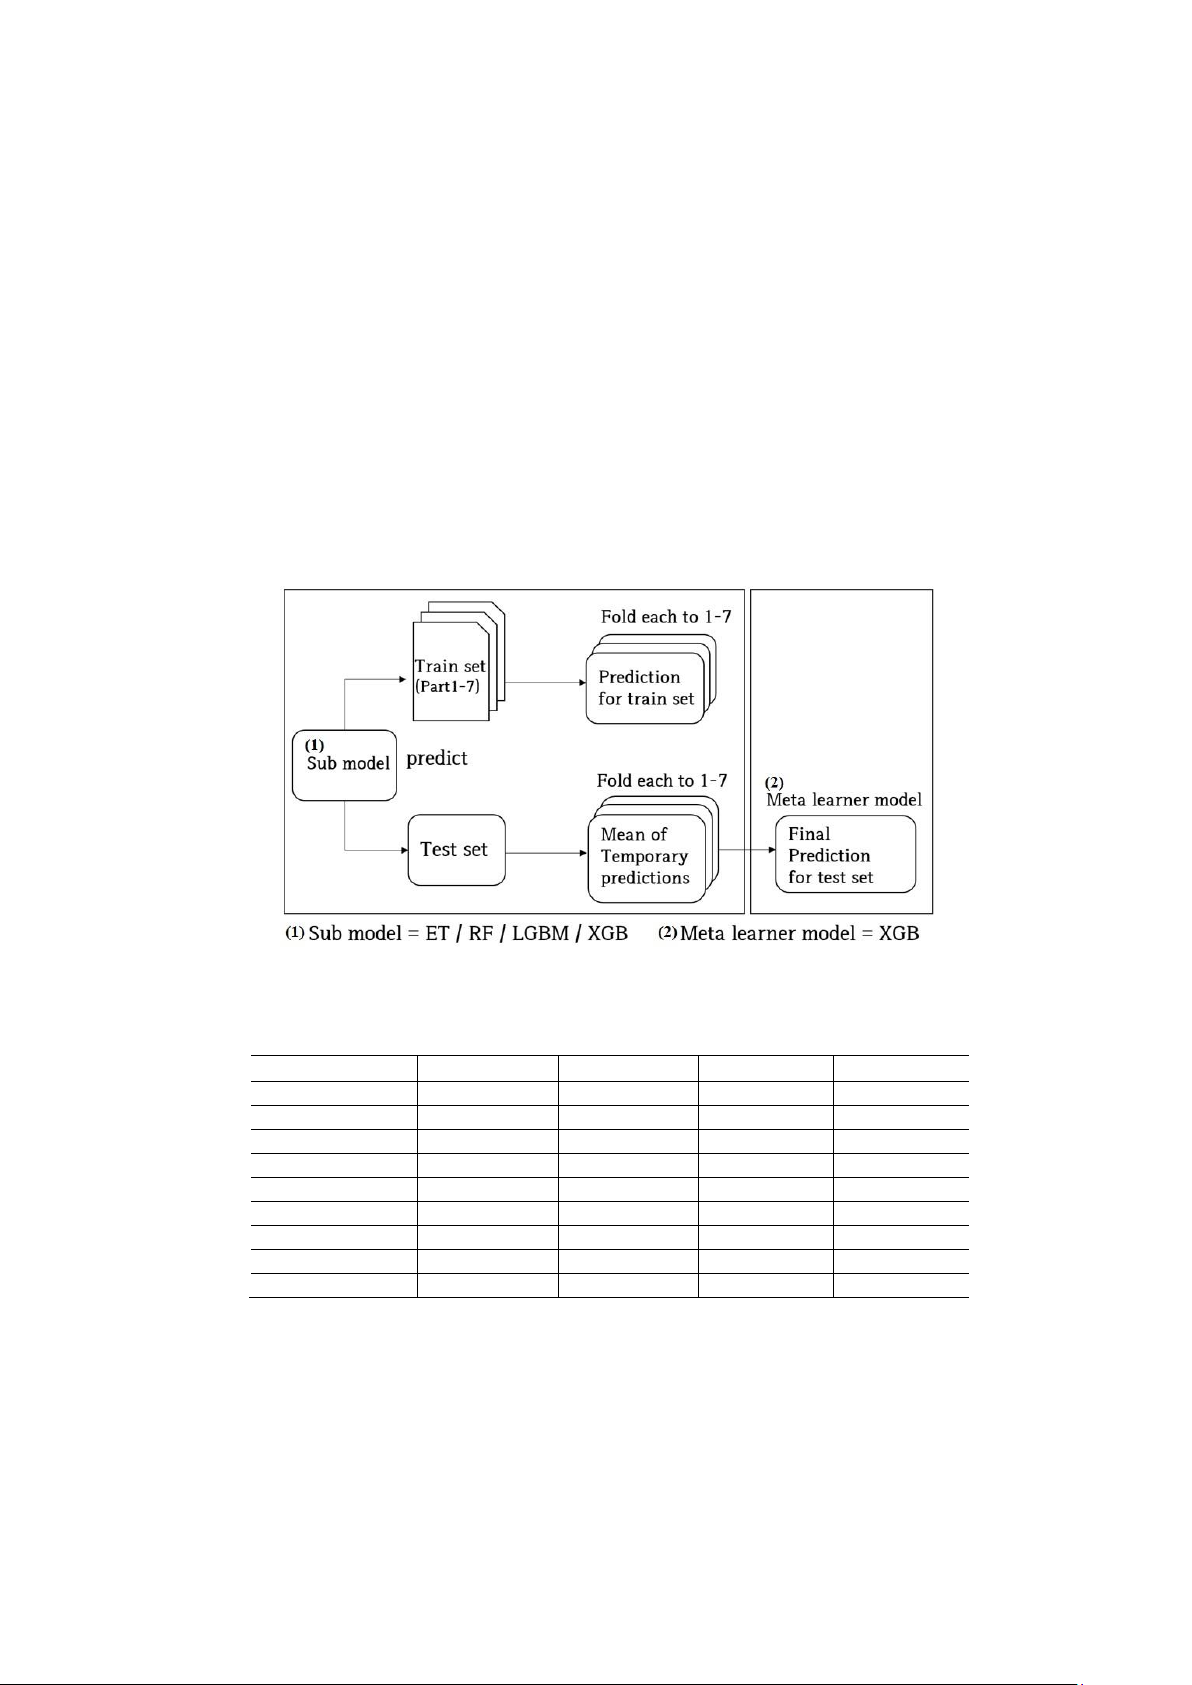
The stacking (stacked generalization) method, called metamodeling, was used for malware learning [8]. The stacking
method is a technique to produce the best performance by mixing and using different single models instead of using other
machine learning ensemble techniques. The prediction results of the sub-model were produced using the training dataset, and
these results were used again as training data for the meta learner. It is an algorithm to make the final prediction value by the
meta learner with the prediction values of the sub-model as the input values. Because the overfitting problem occurs if the
same data are repetitively trained, the cross validation (CV)-based stacking method was used [9].
The CV-based stacking method employs the K-fold cross-validation method, in which a training dataset of each sub-
model is divided into K datasets, and tests are conducted K times. After defining each sub-model, the sub-model is trained
with the training data set divided by the fold. The prediction of the validation data set is conducted to perform the K-fold
averaging prediction that produces the prediction result. After each model is predicted K times, the average of the prediction
value is designated as the resultant prediction value (mean of temporary predictions). The generated resulting prediction
value is used as the training data of the meta learner to conduct the model training. After this, the prediction is finally
performed using x_test, which is then compared using y_test to evaluate the final model.
Figure 4.
Configuration diagram of the stacking model.
Table 2.
Predicted result of stacking sub-model.
K-fold
ET
RF
LGB
XGB
Fold 0
0.951
0.958
0.952
0.956
Fold 1
0.956
0.961
0.954
0.961
Fold 2
0.954
0.961
0.953
0.956
Fold 3
0.954
0.958
0.956
0.953
Fold 4
0.952
0.952
0.953
0.957
Fold 5
0.954
0.964
0.955
0.963
Fold 6
0.953
0.960
0.953
0.957
Mean
0.953+0.001
0.960+0.001
0.953+0.002
0.958+0.002
Full
0.953
0.960
0.953
0.958
This study used Extra Tree (ET), Random Forest (RF), Light XGBoost (LGB), and XGBoost (XGB) in the sub-model,
and XGBoost was used in the meta learner, which was the final classifier. To implement the stacking model, vecstack [10]
and Sklearn packages were used. The data for model learning were 15,000 learning data files provided by the 2018
information protection R&D Data Challenge AI-based malware detection track and collected 18,389 data files. Out of 33,389
files, 23,657 files were malware, and 9,732 files were benign. Out of the extracted total data of 33,389 files, 80% were used
as the training dataset, and 20% were used as the validation dataset. K value in the K-fold cross-validation was set to seven
to conduct the learning. Once the 7-fold averaging prediction was conducted, S_train and S_test, which were the prediction
result of the training and validation datasets, were generated. These result values were trained with the final classifier,
XGBoost [11], to produce the final prediction result. The configuration diagram of the stacking model is shown in Figure 4.
The prediction values of each model extracted by entering the dataset to the sub-model are presented in Table 2. The final


![Pure Spam là gì? 10+ ví dụ Pure Spam từ Google [Cập nhật 2024]](https://cdn.tailieu.vn/images/document/thumbnail/2013/20130831/lilinn/135x160/8051377918232.jpg)


![Sổ tay Kỹ năng nhận diện & phòng chống lừa đảo trực tuyến [Mới nhất]](https://cdn.tailieu.vn/images/document/thumbnail/2025/20251017/kimphuong1001/135x160/8271760665726.jpg)
