Suppressed catalytic efficiency of plasmin in the presence of long-chain fatty acids
Identification of kinetic parameters from continuous enzymatic assay with Monte Carlo simulation Anna Tanka-Salamon1, Kiril Tenekedjiev2, Raymund Machovich1 and Krasimir Kolev1
OnlineOpen: This article is available free online at www.blackwell-synergy.com
1 Department of Medical Biochemistry, Semmelweis University, Budapest, Hungary 2 Department of Economics and Management, Technical University, Varna, Bulgaria
Keywords arachidonate; Monte Carlo simulation; oleate; progress curves; stearate
Correspondence K. Kolev, Department of Medical Biochemistry, Semmelweis University, Puskin u. 9, Budapest 1088, Hungary Fax: +36 1 2670031 Tel: +36 1 2661030 E-mail: kale@puskin.sote.hu Website: http://www.biokemia.sote.hu
Re-use of this article is permitted in accordance with the Creative Commons Deed, Attribution 2.5, which does not permit commercial exploitation
(Received 5 October 2007, revised 9 Janu- ary 2008, accepted 14 January 2008)
Thrombi, which are dissolved primarily by plasmin (EC 3.4.21.7.), contain up to millimolar concentrations of fatty acids and these are known to affect the action of the protease. In the present study the modulation of plasmin activity was characterized quantitatively in a continuous amidolytic assay based on synthetic plasmin substrate (Spectrozyme-PL). A novel numerical procedure was applied for identification of kinetic parameters and their confidence intervals, with Monte Carlo simulation of the reaction progress curves, providing adequate grounds for discrimination of different models of the enzyme action. All three fatty acids caused a 10–20-fold increase in the Michaelis constant on Spectrozyme-PL (baseline value 5.9 lm). The catalytic constant decreased from 5.8Æs)1 to 2.4–2.8Æs)1 in the presence of arachidonate and oleate, but increased to 14.8Æs)1 in the pres- ence of stearate, implying enhancement of plasmin activity at saturating substrate concentrations. However, based on the ratio of the catalytic and Michaelis constants, all three fatty acids acted as inhibitors of plasmin with various degrees of potency, showing concentration dependence in the range of 10–65 lm for oleate and arachidonate, and 115–230 lm for stearate. The reported effects of the three fatty acids require the presence of kringle 5 in the structure of the protease; miniplasmin (des-kringle 1-4 plasmin) is as sensitive to fatty acids as plasmin, whereas the activity of microplasmin (des-kringle 1-5 plasmin) is not affected.
The dissolution of intravascular thrombi is performed their fibrin through the hydrolytic degradation of matrix, a process catalyzed by the serine protease plas- min (EC 3.4.21.7.) [1]. Arterial thrombi contain milli- molar concentrations of phospholipids [2] and free fatty acids [3], which presumably originate from the highly compacted platelet content of the thrombi [4]. These lipid constituents of thrombi profoundly modu- late the fibrinolytic process [2,3,5–7]. In the few studies long-chain fatty acids on evaluating the effect of
plasmin activity, both stimulation [5,7] and inhibition [3,6,7] have been reported, but the exact kinetic char- acteristics of plasmin in the presence of different fatty acids are still unexplored. It was therefore of interest to examine the effects of various potentially relevant fatty acids on plasmin. The three most abundant fatty acids in the structure of platelet membranes are arachi- donic acid, stearic acid and oleic acid, representing 22.0, 19.5 and 18.8%, respectively, of the total fatty [8]. acid content of platelet phosphoglycerolipids
doi:10.1111/j.1742-4658.2008.06288.x
FEBS Journal 275 (2008) 1274–1282 ª 2008 The Authors Journal compilation ª 2008 FEBS
1274
Abbreviation ODE, ordinary differential equation.
of the fatty acids, the turbidity effects of which are smaller compared with the free acid and are not influ- enced by the plasmin substrate.
Accordingly, the present study was undertaken with these three fatty acids, expanding on our recent report [3] in which oleic acid was used to model the modula- tory effects on the fibrinolytic system.
Analytical models of plasmin inhibition
A. Tanka-Salamon et al. Fatty acids as plasmin inhibitors
Results and Discussion
Influence of fatty acids on the plasmin amidolytic assay
the reactions
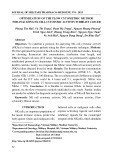
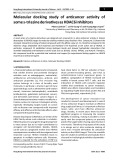
For determining the exact kinetic parameters of plas- min we chose a simple amidolytic assay based on a synthetic plasmin substrate (Spectrozyme-PL). When the plasmin amidolytic activity assay was performed in the presence of free oleic acid, some spurious effects were observed (Fig. 1). The optical phenomenon illus- trated in Fig. 1A was not wavelength specific (because the same absorbance changes were seen at 340 nm; data not shown) and was not related to substrate breakdown (because plasmin released all the expected amount of p-nitroaniline after the incubation, as shown in the figure). Thus, these optical changes can be attributed to the formation of fatty acid micelles and their re-arrangement effected by Spectrozyme-PL. The results presented in Fig. 1B were observed if rela- tively weak plasmin activity (e.g. 1 nm plasmin) was superimposed on the initial phase of the optical changes in Fig. 1A and these can be misinterpreted as an activating effect of oleic acid. Therefore, in the present study we chose to work with higher plasmin concentrations (20 nm) and water-soluble sodium salts
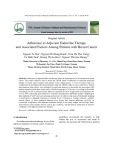
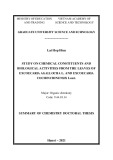
Because, in most cases, the change in product concen- tration is not linear in the amidolytic assay performed with the required concentrations of plasmin and sub- strate, the initial reaction rate cannot be approximated reliably with a linear function, and the differential rate equation of the classic Michaelis–Menten framework cannot be applied directly for evaluating the experi- mental data. Accordingly, the progress curves of prod- uct generation in the course of the continuously monitored reactions were analysed as described in the in the Materials and methods. For absence of fatty acids, or in the presence of oleate and arachidonate, the experimental data were compatible with the simplest scheme of Model I (reversible sub- strate–enzyme interaction followed by irreversible breakdown of the enzyme–substrate complex to prod- uct and enzyme, as illustrated in Fig. 2A for oleate). In the presence of stearate, however, the discrepancy between the experimental and model curves was unacceptably large (Fig. 2B), suggesting a decrease in the enzyme activity during the assay. Consequently, the potential effects of the equilibrium between the product and the enzyme–product complex (Model II), as well as enzyme instability (Model III), are also considered, resulting in a decrease of the global-fit v2
FEBS Journal 275 (2008) 1274–1282 ª 2008 The Authors Journal compilation ª 2008 FEBS
1275
Fig. 1. Light attenuation of oleic acid micelles in the presence of synthetic plasmin substrate. (A) Twenty microlitres of 1 mM Spectrozyme-PL was added to 180 lL of various concentrations of oleic acid (the numbers next to the lines indicate the concentration in lM) and the absor- bance at 405 nm was measured. (B) Twenty microlitres of 1 mM Spectrozyme-PL was added to 180 lL of 1 nM plasmin solution containing oleic acid, at concentrations (in lM) indicated by the numbers, and the absorbance at 405 nm was measured. The mean and standard deviation (dotted lines) of five measurements are shown for both panels.
A. Tanka-Salamon et al. Fatty acids as plasmin inhibitors
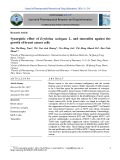
values (Fig. 3). Inspection of the residual plots [9] that were generated with the best estimates according to the three models evaluated, found systematic anomalies in
Models I and II, which disappeared in Model III (Fig. 4). Selwyn’s test [10] is a simple functional probe for enzyme stability in the course of activity assays. As illustrated in Fig. 5, this test indicated minimal loss of plasmin activity in the absence of fatty acids (Fig. 5A) compared with the markedly lower levels of end-stage product in the presence of stearate (Fig. 5B). In line with earlier observations [6], no autocleavage of plasmin was seen during the activity assay in the presence of enzyme substrate (Fig. 5, insets) preclud- ing a proteolytic mechanism of the inhibition. The improved global v2 value (Fig. 3), the homogeneous residual plot (Fig. 4) and the results of Selwyn’s test (Fig. 5), justify the application of Model III as being the the most adequate for the final evaluation of kinetic parameters in the presence of stearate.
Evaluation of kinetic parameters
Fig. 2. Amidolytic activity of plasmin in the presence of oleate and stearate. The hydrolysis of Spectrozyme-PL (the concentrations, in lM, are indicated at the end of the curves) by 20 nM plasmin was monitored in reaction mixtures containing 10 lM oleate (A) or 115 lM stearate (B). The p-nitroaniline (P) generated is presented as the mean (symbols) and standard deviation (cross-lines) of four measurements. Lines represent the best global fit of the data set to the equation of Model I described in the Materials and methods. The measure for goodness- of-fit ( N, where N is the total number of measurement points) is presented by the numbers in boxes. ffiffiffiffiffiv2p .
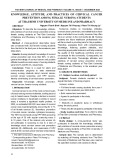
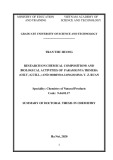
Following preliminary estimates of the Michaelis con- stant Km, a specific range of Spectrozyme-PL concen- trations was assigned for each concentration of each fatty acid (lower limit below the estimated Km value and upper limit at least 5-fold higher than the Km esti- mate). The final best estimates of the catalytic constant (kp) and the Km, and their confidence intervals, are presented in Fig. 6. The optimization according to Model III yielded three additional fitted parameters [the product–enzyme association equilibrium constant (Ki), the decay rate constants for the enzyme-substrate
FEBS Journal 275 (2008) 1274–1282 ª 2008 The Authors Journal compilation ª 2008 FEBS
1276
ffiffiffiffiffiv2p . Fig. 3. Comparison of three models for the catalytic action of plas- min in the presence of stearate. The p-nitroaniline (P) released in the course of hydrolysis of 40 lM Spectrozyme-PL by 20 nM plas- min in the presence of 115 lM stearate is shown by symbols (mean ± standard deviation of four measurements). Lines represent the curve for the 40 lM substrate concentration from the best glo- bal fit of the data in Fig. 2B to the equation of Model I (dotted line), Model II (dashed line) and Model III (solid line), as described in the Materials and methods. The numbers next to the curves indicate the goodness-of-fit ( N) for the parameter optimization proce- dure, according to the respective model.
A. Tanka-Salamon et al. Fatty acids as plasmin inhibitors
A
B
C
Fig. 6. Kinetic parameters of plasmin in the presence of fatty acids. The values of kp and Km were determined from the amidolytic assay of plasmin activity, according to Model I, in the presence of oleate (OA) and arachidonate (AA), or, according to Model III, in the presence of stearate (SA). Using the Monte Carlo procedure described in the Materials and methods, 1000 synthetic sample sets were generated for each experimental setting and the esti- mated synthetic parameters are shown by green symbols (for pairs within the 95% confidence region; the exact numerical values are presented in Table 1) or blue symbols (for pairs out of the 95% confidence region). The best estimate from the experiment is indi- cated by a red asterisk, whereas the best estimate from the Monte-Carlo simulation is indicated by a red circle. Numbers follow- ing the abbreviation of the respective fatty acid name indicate its concentration (in lM). The ‘0 ’ indicates the set of parameters in the fatty acids. Shaded ellipses combine parameters absence of belonging to the same type of fatty acid (data for oleate and the absence of fatty acids are found in the unshaded area). Fig. 4. Residual plots for the discrimination of three models of plasmin action in the presence of stearate. Residual values Pmean;i;j (cid:2)P M were calculated using the measured Pmean,i,j values and i;j P M std;j ðPmean;i;j Þ their model standard deviation P M std;j ðPmean;i;j Þ from the experiment shown in Fig. 2B and the P M i;j values predicted with kinetic parame- ters optimized according to Model I (A), Model II (B) and Model III (C). Shaded areas indicate systematic trend in the residual plot. Symbols show residuals for reactions with different initial substrate concentrations (in lM): 40 (circles), 60 (squares), 80 (dots), 100 (crosses), 200 (asterisks), 300 (diamonds), 600 (triangles).
A
B
FEBS Journal 275 (2008) 1274–1282 ª 2008 The Authors Journal compilation ª 2008 FEBS
1277
Fig. 5. Selwyn’s test of plasmin activity. The hydrolysis of Spectrozyme-PL (40 lM) by plasmin (at final concentrations, in nM, indicated by the numbers next to the curves) was monitored in reaction mixtures containing no other additive (A) or 115 lM stearate (B). The p-nitro- aniline (P) generated is shown as the mean (lines) and standard deviation (cross-bars) of four measurements. Insets show silver-stained samples of plasmin (0.3 lM) incubated without (A) or with (B) 115 lM stearate at 37 (cid:2)C for the indicated time in the presence of 70 lM Spec- trozyme-PL and subjected to electrophoresis on a 10–15% polyacrylamide gel under nonreducing denaturing conditions.
changed. The
experiments
the amidolytic
course of
A. Tanka-Salamon et al. Fatty acids as plasmin inhibitors
the reaction started at
is an indispensable tool in identification of the kp and Km values because it is able to eliminate the super- imposed assay-dependent effects (on the Km and kp), which is not a trivial problem.
complex (J2) and the enzyme product complex (J3)], which accounted for the progressive decrease of plas- min activity in the course of the assay in the presence of stearate (Table 1). The good fit of Model III pro- gress curves to the experimental data supports the concept that in the presence of stearate the catalytic mechanism of plasmin is enzyme acquires higher affinity for some of the reaction prod- ucts and, in addition, is less stable in complex with the product (the values of J2 assigned by the optimization procedure approach zero, thus ruling out potential the enzyme–substrate complex). Addi- instability of identified p-nitroaniline as the tional factor responsible for the premature decline of the enzyme activity in the course of the assay. The amido- lytic assay was performed with plasmin pre-incubated with stearate and reaction products. If the pre-incuba- tion was carried out with lysine, e-aminocaproic acid or fibrinogen degradation products (mimicking the release of C-terminal lysine from Spectrozyme-PL) the time reaction was not affected, but if p-nitroaniline was used in the pre-incu- bation, the suppressed rate observed in the later stages of the amidolytic assay with stearate (Fig. 7). Thus, we concluded that the product inhibition was related only to the experimental setting of the amidolytic assay. Under such conditions the mathematical procedure operating with Ki and J3
Fig. 7. Effect of p-nitroaniline (pNA) on the amidolytic activity of plasmin in the presence of fatty acids. The absorbance at 405 nm was measured for reaction mixtures containing 20 nM plasmin, 80 lM Spectrozyme-PL and 115 lM stearate (dashed line), 45 lM oleate (dotted line), 45 lM arachidonate (dashed-and-dotted line) or no additive (solid line), in the absence or presence of pNA. The mean values of four measurements are presented.
)1)
Table 1. Kinetic parameters of plasmin in the presence of fatty acids. Numerical values of the best estimates (BE) and their 95% confidence intervals (CI) are presented. Values for the Michaelis constant (Km), (kp), the product–enzyme association equilibrium constant (Ki) and the decay rate constant (J3) of the enzyme–product complex are presented, according to Model I, for no additive, oleate and arachidonate (NA indicates that the respective constant is not applicable in the used model) or according to Model III for stearate (decay rate constants of the enzyme–substrate complex are not shown because in all cases the optimization assigns them values of less than 10)12Æs)1).
Km (lM) kp (s)1) Ki (lM J3 (s)1)
BE CI BE CI BE CI BE CI Concentration of added fatty acid (lM)
5.89 5.43–6.38 5.81 5.70–5.93 NA NA NA NA
12.58 20.09 27.49 131.09 11.68–13.41 18.76–21.26 26.43–28.57 115.33–146.13 4.54 3.65 2.63 2.75 NA NA NA NA NA NA NA NA 4.48–4.60 3.56–3.73 2.58–2.68 2.57–2.95 NA NA NA NA NA NA NA NA None Oleate 10 25 45 65 Arachidonate
23.71 42.65 57.51 59.85 22.91–24.58 38.28–47.66 55.24–59.60 56.76–62.73 6.10 3.57 3.68 2.40 NA NA NA NA NA NA NA NA 6.06–6.15 3.43–3.71 3.62–3.73 2.35–2.44 NA NA NA NA NA NA NA NA
FEBS Journal 275 (2008) 1274–1282 ª 2008 The Authors Journal compilation ª 2008 FEBS
1278
8.17 11.33 23.37 72.96 7.35–9.10 9.42–13.41 20.98–26.88 69.86–75.86 7.03 7.48 12.39 14.77 6.93–7.12 7.37–7.61 11.92–12.73 13.94–23.85 0.025 0.012 0.007 0.002 0.011–0.053 0.008–0.402 0.005–0.009 0.001–0.003 0.026 0.056 0.062 0.074 0.018–0.038 0.001–0.158 0.052–0.069 0.001–0.356 10 25 45 65 Stearate 65 115 175 230
fatty acids and support the notion that interaction with kringle 5 is sufficient for their action. This finding is in agreement with an earlier report that oleic acid binds to kringle 5 with an affinity that is an order of magnitude higher than found for binding to the other kringles [7]. Remarkably, the same authors show that oleic acid affects plasmin activity measured on a mac- romolecular substrate (prostromelysin-1) when applied in the same concentration range as reported in the present study for oleate and arachidonate (10–65 lm).
Concluding remarks: advantages of progress curve analysis combined with Monte Carlo simulation
Our findings illustrate the general possibility for a modulator to change the kinetic parameters of an enzyme in an independent and controversial manner, so that the overall catalytic outcome may vary with the concentration of the substrate.
All three fatty acids examined caused a 10–20-fold increase in the Km of plasmin: oleate and arachidonate were efficient in the 10–65 lm concentration range, whereas stearate needed to be present at concentra- tions higher than 65 lm to achieve significant effects (Fig. 6). The two unsaturated fatty acids (oleate and arachidonate) resulted in a decrease, of up to two-fold, in the kp of plasmin. Considering the recently des- cribed reversible nature of the plasmin inhibition by oleic acid [3] and the changes of the kinetic parameters reported in the present study, oleate and arachidonate can be defined as mixed-type inhibitors of plasmin. The effect of stearate is rather unusual; the increase in the Km is coupled to higher values of the kp. At satu- rating concentrations of the substrate this effect is seen as apparent activation of plasmin in the amidolytic assay. However, if we use the kp ⁄ Km ratio as a mea- sure of the overall impact of stearate, it should be clas- sified as an inhibitor of plasmin, the potency of which is the lowest among the three fatty acids studied (Table 2).
Structure–function relationships
In an attempt to identify the site of action of the fatty acids in the plasmin molecule, the amidolytic activity of two truncated plasmin variants was examined (Fig. 8). Miniplasmin (des-kringle 1-4 plasmin) con- tains the kringle 5 and the catalytic domain of plas- min, whereas microplasmin (des-kringle 1-5 plasmin) is composed of the catalytic domain only [11]. At a satu- rating concentration of Spectrozyme-PL, all three fatty acids affected the activity of miniplasmin in the same manner as that of plasmin; apparent activation was seen with stearate and inhibition was seen with oleate and arachidonate (Fig. 8A). Microplasmin was not sensitive to the presence of fatty acids (Fig. 8B). These results preclude the catalytic domain as a target of the
estimates
A. Tanka-Salamon et al. Fatty acids as plasmin inhibitors
Table 2. Catalytic efficiency [the catalytic constant ⁄ Michaelis con- stant (kp ⁄ Km) ratio] of plasmin in the presence of various fatty )1Æs)1) ratio was calculated from the best esti- acids. The kp ⁄ Km (lM mates of the kinetic parameters for the amidolytic activity of plas- min presented in Fig. 6.
The approach used for the identification of kinetic parameters in this study exploited the advantages of progress curve evaluation in enzyme assays (a single reaction mixture yields 60 experimentally measured points for exactly the same enzyme and modulator concentrations) and further expanded the ideas for computer-intensive procedures in time-course simula- tions [12–14]. The global fit of the inverse functions for the integrated rate equations (Models I and II), or of the numerical solutions for the ordinary differential equations (Model III), was based on 420 experimental points (the means of 60 measured points for seven substrate concentrations) and its best estimates were the further analyzed for better implementation of experimental error. The application of error models Pk i;j in the Monte Carlo simulations has the advantage over the real error in that it reflects the trend in the error as a function of the product concentration generated and filters the random effects in individual samples. The the kinetic parameters differed best estimates of slightly from the (Fig. 6) experimental because they are actually corrected for the effect of random outliers. The probability distribution of the parameters estimated using this robust evaluation procedure was essential for the identification of the statistical significance of the described effects. In con- clusion, our study is an example of a careful kinetic analysis that can be a valuable tool in the coherent interpretation of apparently controversial modulator effects on enzyme activity.
Stearate Oleate Arachidonate Fatty acid concentration (lM)
Our present results were gained in a homogeneous plasmin assay system and thus their pathophysiological implications are not straightforward with respect to
FEBS Journal 275 (2008) 1274–1282 ª 2008 The Authors Journal compilation ª 2008 FEBS
1279
0 10 25 45 65 115 175 230 0.99 – – – 0.86 0.66 0.53 0.20 0.99 0.36 0.18 0.10 0.02 – – – 0.99 0.26 0.08 0.06 0.04 – – –
A. Tanka-Salamon et al. Fatty acids as plasmin inhibitors
performed in this buffer system, the butylated hydroxy- toluene after the final dilution in the reaction mixtures had no effect on the plasmin activity on its own). Miniplasmin and microplasmin were prepared and titrated according to our previously published procedures [11].
Amidolytic assay of plasmin activity
external, therapeutic fibrinolysis [1], when plasmin is generated by plasminogen activators on preformed fibrin and is exposed to a constant substrate concentra- tion in a narrow lysis front on the surface of fibrin. Even if intravascular events initiate blood clotting and fibrin dissolution simultaneously in a process called intrinsic or internal fibrinolysis [15], plasmin is gener- ated directly on the surface of fibrin fibers and so it is partially protected against inhibitors [16]. Thus, the effects of fatty acids are restricted to a probably small fraction of plasmin molecules, which are detached from the fiber matrix. Despite this limitation, acting as mixed-type inhibitors, unsaturated fatty acids are still able to stabilize fibrin against plasmin, as previously reported for oleic acid [3], whereas through its discor- dant effects on the kp and Km values, stearate may promote fibrinogen depletion (as a result of higher plasmin activity at saturating substrate concentrations) and consequently shorten the life span of newly formed clots. The extrapolation of the reported in vitro effects to the in vivo setting of fibrin(ogen)olysis should await similarly rigorous characterization of plasmin activity on its natural substrates.
Fig. 8. Amidolytic activity of des-kringle plasmin derivatives in the presence of fatty acids. The activity of 20 nM miniplasmin (A) and micro- plasmin (B) on 120 lM Spectrozyme-PL in the absence of additives (none) or in the presence of 45 lM oleate (OA), 45 lM arachidonate (AA) or 175 lM stearate (SA), was measured. The mean and standard deviation values of four measurements are presented.
Materials and methods
Materials
k ) and Pstd,i,j (standard deviation of Pi,j
std;jðPmeanÞ ¼ bjðPmeanÞaj , where PM
Plasmin (20 nm) was incubated with the sodium salts of fatty acids for 15 min at 37 (cid:2)C. Then, 180 lL of this mix- ture was added to 20 lL of Spectrozyme-PL (H-D-nor- leucyl-hexahydrotyrosyl-lysine-p-nitroanilide; American Diagnostica, Stamford, CT, USA) at seven different con- centrations ranging from 0.05 to 6 mm, yielding a final con- centration S0j (j = 1,2,...,7) in the volume of the reaction mixtures. The light absorbance at 405 nm (A405), which reflects the release of p-nitroaniline, was measured continu- ously at ti (i = 1,2,...,60) time points in the course of 10 min at 37 (cid:2)C; four parallel measurements were carried out for each S0j. The delay time between the initiation of the reaction and the first measurement was estimated with linear extrapolation from the initial six measured A405 val- ues back to baseline absorbance, and an extinction coeffi- cient for p-nitroaniline of 12.6 mm)1Æcm)1 (determined from calibration in our assay system) was used to convert the measured absorbance values to product concentration Pk i;j (the notation indicates the p-nitroaniline concentration at time ti for the kth replica with S0j). Using Pmean,i,j (mean of k ) three different Pi,j approaches to model the behaviour of the experimental error along the progress curves were tested (uniform error, linear regression in logarithmic scale and regression accord- ing to a truncated square root function). Among them, the best fit was achieved with the linearized logarithmic model equation PM std;j is the model error for the experiments with S0j. The parameters aj and bj
Sodium salt and free acid forms of oleic, stearic and arachi- donic acids were purchased from Sigma-Aldrich Kft (Buda- pest, Hungary) and stock solutions (10 mm) were prepared in water (prewarmed to 70 (cid:2)C) containing 50 lm butylated hydroxytoluene; these stock solutions were further diluted to the desired concentrations in 10 mm HEPES buffer (pH 7.4) containing 150 mm NaCl reactions were
(all
FEBS Journal 275 (2008) 1274–1282 ª 2008 The Authors Journal compilation ª 2008 FEBS
1280
were estimated by the ordinary least square method, and the experimental error models were used in evaluation of the kinetic parameters described below.
maximal rate possible for given enzyme concentration, whereas kp has the properties of a first-order rate constant defining the capacity of the enzyme–substrate complex to form product [12]. The integrated form of Eqn (3) is:
:
ln
ð4Þ
t ¼
P þ
Estimation of the kinetic parameters of plasmin according to different model mechanisms
1 (cid:2) Km(cid:3)Ki kp(cid:3)Et0
Kmð1 þ S0(cid:3)KiÞ kp(cid:3)Et0
S0 S0 (cid:2) P
Three different models were tested for the reaction cata- lyzed by plasmin in the aforementioned assay. In the sim-
plest case (Model I)
ES
the scheme E þ S
k2 ! E þ P is
k1 ! k(cid:2)1
It can be proved that t in Eqn (4) is a strictly increasing function of P for any combination of Km, kp and Ki and therefore it has an inverse function P = PM(t, Km, kp, Ki, S0, Et0), which can be estimated numerically using the table look-up procedure described for Model I.
Because the product
inhibition could not model
assumed, where E is plasmin, S is Spectrozyme-PL, P is p-nitroaniline, and k1, k2 and k-1 are the respective reaction rate constants. With the quasi-steady-state assumption the differential rate equation for this scheme is:
the progress curve of the reaction in a satisfactory manner, the instability of the enzyme in the assay system was also consid- ered according to the scheme suggested by Duggleby [13,14]
;
¼
ð1Þ
dP dt
kp(cid:3)Et0(cid:3)ðS0 (cid:2) PÞ Km þ S0 (cid:2) P
k1
where Et0 and S0 are the initial concentrations of plasmin and its substrate, the Michaelis constant Km ¼ k(cid:2)1þk2 and the cata- lytic constant kp = k2 [12]. Following integration it gives:
:
ln
t ¼
P þ
ð2Þ
Km kp(cid:3)Et0
1 kp(cid:3)Et0
S0 S0 (cid:2) P
in which E ¢ indicates the inactive form of the enzyme, and J1, J2 and J3 are the rate constants for inactivation of the respective forms of the enzyme. In independent measure- ments with fatty acids we showed that the inactivation of free plasmin for the duration of the amidolytic assay was negligi- ble (data not shown) and consequently the differential equa- tion for the changes in enzyme concentration was derived only for J2 ¼ 0, yielding the following system of ordinary differential equations (ODE):
¼
kp(cid:3)Et(cid:3)ðS0 (cid:2) PÞ Km(cid:3)ð1 þ Ki(cid:3)PÞ þ S0 (cid:2) P
ð5Þ
:
¼ (cid:2)
dP dt dEt dt
J2(cid:3)EtðS0 (cid:2) PÞ=KM þ J3(cid:3)Et(cid:3)Ki(cid:3)P 1 þ Ki(cid:3)P þ ðS0 (cid:2) PÞ=Km
It is obvious that t in Eqn (2) is a strictly increasing func- tion of P for any combination of Km and kp and therefore function P = PM(t, Km, kp, S0, Et0), it has an inverse which can be numerically estimated for all measured time points by a table look-up procedure. Thus, the linearized (according to the parameters) version of the integrated kinetic Eqn (2) was not used for regression purposes. With our approach we numerically built up the table of the inverse function for Eqn (2), which has no analytical form for P and in which t is the independent variable. Such mul- tiple tables for different sets of parameters are used in the iterations, when the parameters are identified.
ES
Because in the course of certain experiments the reaction rate declined faster than predicted by Model I, the more k2 ! EP
E þ P; was also tested
general scheme, E þ S
k1 ! k(cid:2)1
k3 ! k(cid:2)3
family
(Model II), which accounts for the accumulation of the product and its complex with the enzyme. Assuming steady-state for both ES and EP complexes, the differential rate-equation is:
;
¼
ð3Þ
dP dt
kp(cid:3)Et0(cid:3)ðS0 (cid:2) PÞ Km(cid:3)ð1 þ Ki(cid:3)PÞ þ S0 (cid:2) P
ð
ð
The ODE system (5) was solved with initial conditions P(t=0) = 0 and E(t=0) = Et0. The first component of the solution P = PM(t, Km, kp, Ki, J2, J3, S0, Et0) represented the values for P in Model III. The integration of the ODE system (5) was performed by quasi-constant step-size imple- mentation in terms of backward differences of the Klopfen- of Numerical Differentiation stein–Shampine Formulas of orders 1–5 and the initial steps were deter- mined so that the solution would stay in its domain (0 £ P £ S0, 0 £ Et £ Et0) during the whole integration [17]. The model equations were fitted to the Pmean;i;j values with minimization of the square residues. The best experi- mental estimate of the model parameters was defined as the
(cid:4)2
(cid:3)
was
Pmean;i;j(cid:2)PM i;j PM std;jðPmean;i;jÞ
7 set of parameters for which the v2 ¼ P j¼1
60 P i¼1
rendered the minimal value ðPM is the value at ti and S0j of i;j the functions with different sets of kinetic parameters as
Þ:k3 where Km ¼ k(cid:2)1þk2 Þ , kp ¼ k2:k3 and the equilibrium associa- k1 k2þk3 k2þk3 tion constant for the product Ki ¼ k(cid:2)3 . Although the Km k3 and the kp derived for Model I and Model II have different algebraic form, their meaning within the context of the spe- cific catalytic mechanism is identical; the Km is the substrate concentration at which the initial reaction rate is half of the
FEBS Journal 275 (2008) 1274–1282 ª 2008 The Authors Journal compilation ª 2008 FEBS
1281
A. Tanka-Salamon et al. Fatty acids as plasmin inhibitors
7 Huet E, Cauchard JH, Berton A, Robinet A, Decarme M, Hornebeck W & Bellon G (2004) Inhibition of plas- min-mediated prostromelysin-1 activation by interaction of long chain unsaturated fatty acids with kringle 5. Biochem Pharmacol 67, 643–654.
8 Marcus AJ, Ullman HL & Safier LB (1969) Lipid com- position of subcellular particles of human blood plate- lets. J Lip Res 10, 108–114.
9 Cornish-Bowden A (2001) Detection of errors of inter- pretation in experiments in enzyme kinetics. Methods 24, 181–190.
defined for Models I, II or III above and an identical Et0 value for all experiments). The minimization was performed using the Nelder–Mead simplex direct search method [18]. Monte Carlo simulations [19] over the parameter loga- rithms were used to identify the confidence intervals of the parameters and their best estimates, as described previously [20]. Each value for the simulated data points in the syn- thetic sample set was generated as a random entry, chosen from the normal distribution with mean Pmean,i,j and vari- std;jðPmean;i;jÞ(cid:4)2. All model simulation and optimiza- ance ½PM tion programs described above run under matlab 7.4 (The MathWorks Inc., Natick, MA, USA).
10 Selwyn MJ (1965) A simple test for inactivation of an enzyme during assay. Biochim Biophys Acta 105, 193– 195.
A. Tanka-Salamon et al. Fatty acids as plasmin inhibitors
Acknowledgements
11 Komorowicz E, Kolev K & Machovich R (1998) Fibri- nolysis with des-kringle derivatives of plasmin and its modulation by plasma protease inhibitors. Biochemistry 37, 9112–9118.
12 Cornish-Bowden A (2004) Fundamentals of Enzyme
Kinetics, 3rd edn. Portland Press, London.
13 Duggleby RG (1995) Analysis of enzyme progress
The technical assistance of Gyo¨ rgyi Oravecz is highly appreciated. The authors are grateful to Dr Colin Longstaff for helpful suggestions and critical review of the manuscript. This work was supported by the Well- come Trust (083174 ⁄ B ⁄ 07 ⁄ Z); Hungarian Scientific Research Fund (OTKA T031891), (OTKA K60123); Health Sciences Council (ETT 385 ⁄ 2006).
curves by nonlinear regression. Methods Enzymol 249, 61–90.
References
14 Duggleby RG (2001) Quantitative analysis of the time courses of enzyme-catalyzed reactions. Methods 24, 168–174.
1 Kolev K, Longstaff C & Machovich R (2005) Fibrino- lysis at the fluid-solid interface of thrombi. Curr Medic Chem Cardiovasc Hematol Agents 3, 341–355.
15 Collet JP, Lesty C, Montalescot G & Weisel JW (2003) Dynamic changes of fibrin architecture during fibrin formation and intrinsic fibrinolysis of fibrin-rich clots. J Biol Chem 278, 21331–21335.
2 Va´ radi B, Kolev K, Tenekedjiev K, Me´ sza´ ros G, Kov- alszky I, Longstaff C & Machovich R (2004) Phospho- lipid-barrier to fibrinolysis: role for the anionic polar head charge and the gel-phase crystalline structure. J Biol Chem 279, 39863–39871.
16 Schneider M & Nesheim M (2004) A study of the pro- tection of plasmin from antiplasmin inhibition within an intact fibrin clot during the course of clot lysis. J Biol Chem 279, 13333–13339.
17 Shampine LF, Gladwell I & Thompson S (2003) Solving ODEs with Matlab. Cambridge University Press, Cam- bridge.
3 Ra´ bai G, Va´ radi B, Longstaff C, So´ tonyi P, Kristo´ f V, Tima´ r F, Machovich R & Kolev K (2007) Fibrinolysis in a lipid environment: modulation through release of free fatty acids. J Thromb Haemost 5, 1265–1273. 4 McBane RD, Ford MAP, Karnicki K, Stewart M &
18 Lagarias J, Reeds J, Wright M & Wright P (1998) Con- vergence properties of the Nelder-Mead simplex method in low dimensions. SIAM J Optimiz 9, 112–147.
19 Politis DN (1998) Computer-intensive methods in statis-
tical analysis. IEEE Signal Proc Mag 15, 39–55.
Owen WG (2000) Fibrinogen fibrin and crosslinking in aging arterial thrombi. Thromb Haemost 84, 83–87. 5 Higazi AAR, Finci-Yeheskel Z, Samara AAR, Aziza R & Mayer M (1992) Stimulation of plasmin activity by oleic acid. Biochem J 282, 863–866.
6 Higazi AAR, Aziza R, Samara AAR & Mayer M
20 Tenekedjiev K & Kolev K (2002) Introduction to inter- pretation of stochastic parameters: computer-intensive procedures for evaluation of data in enzyme kinetics. Biochem Mol Biol Education 30, 414–418.
(1994) Regulation of fibrinolysis by non-esterified fatty acids. Biochem J 330, 251–255.
FEBS Journal 275 (2008) 1274–1282 ª 2008 The Authors Journal compilation ª 2008 FEBS
1282