
Hindawi Publishing Corporation
EURASIP Journal on Wireless Communications and Networking
Volume 2011, Article ID 983915, 7pages
doi:10.1155/2011/983915
Research Article
Amplitude PDF Analysis of OFDM Signal Using Probabilistic
PAPR Reduction Method
Hyunseuk Yoo, Fr´
ed´
eric Guilloud, and Ramesh Pyndiah
Department of Signal and Communications, Telecom Bretagne, Technopole Brest Iroise, CS 83818, 29238 Brest cedex 3, France
Correspondence should be addressed to Hyunseuk Yoo, hyunseuki@gmail.com
Received 24 June 2010; Revised 2 December 2010; Accepted 19 January 2011
Academic Editor: Marc Moonen
Copyright © 2011 Hyunseuk Yoo et al. This is an open access article distributed under the Creative Commons Attribution License,
which permits unrestricted use, distribution, and reproduction in any medium, provided the original work is properly cited.
To reduce the peak-to-average power ratio (PAPR) of an orthogonal frequency division multiplexing (OFDM) modulation
scheme, one class of methods is to generate several OFDM symbols (candidates) carrying the same information and to select
for transmission the one having the lowest PAPR. We derive a theoretical amplitude probability density function (PDF) of the
selected OFDM symbol using order statistics. This amplitude PDF enables one to derive the signal-to-noise-plus-distortion ratio
(SNDR) as a function of the number of candidates. Based on the SNDR derivation, theoretical error performance and statistical
channel capacity are provided for this class of methods. The results match the simulations and make the system design easier.
1. Introduction
Orthogonal frequency division multiplexing (OFDM) is a
multicarrier multiplexing technique, where data is transmit-
ted through several parallel frequency subchannels at a lower
rate. It has been popularly standardized in many wireless
applications such as Digital Video Broadcasting (DVB), Dig-
ital Audio Broadcasting (DAB), High Performance Wireless
Local Area Network (HIPERLAN), IEEE 802.11 (WiFi), and
IEEE 802.16 (WiMAX). It has also been employed for wired
applications as in the Asynchronous Digital Subscriber Line
(ADSL) and power-line communications.
A significant drawback of the OFDM-based system is its
high Peak-to-Average Power Ratio (PAPR) at the transmitter,
requiring the use of a highly linear amplifier which leads to
low power efficiency [1].Moreover,whenanOFDMsignal
level works on the nonlinear area of amplifier, the OFDM
signals go through nonlinear distortions and degrade the
error performance.
The various approaches to alleviate this problem in
OFDM-based systems can be classified into five categories:
clip effect transformation [2], coding [3], frame superposi-
tion using reserved tones [4], expansible constellation point:
tone injection [4] and active constellation extension [5], and
probabilistic solutions [6–13].
The principle of probabilistic methods is to reduce the
probability of high PAPR by generating several OFDM
symbols (multiple candidates) carrying the same informa-
tion and by selecting the one having the lowest PAPR.
The probabilistic method can also be classified into two
strategies: subblock partitioning strategy and entire block
strategy. The subblock partitioning strategy, such as partial
transmit sequence (PTS) [6–8], divides frequency domain
signals into several subblocks. On the other hand, the
entire block strategy, such as selected mapping (SLM) [8–
10] and interleaving [11–13], considers the entire block for
generating multiple candidates.
In this paper, we consider the entire block strategy of
the probabilistic methods to generate multiple candidates.
First, the probability density function (PDF) for the multiple
candidate system is analyzed. When the candidate having
the lowest PAPR is selected, the PDF of the amplitude of a
selected OFDM symbol becomes the function of the number
of candidates n. We apply the analyzed PDF (as a function of
n) to Ochiai’s method [13] for obtaining the signal-to-noise-
plus-distortion ratio (SNDR) as a function of n. Then, the
SNDR (as a function of n)canbeusedforanalyticalerror
performance. Note that in [13], the authors used the Rayleigh
PDF (single candidate) for obtaining the error performance
of multiple candidate cases. However, we suggest using our

2 EURASIP Journal on Wireless Communications and Networking
PDF (multiple candidates) to obtain the theoretical error
performance and also the statistical channel capacity for the
multiple candidate system.
The paper is organized as follows: in Section 2,we
describe the multiple candidate OFDM system, and analyze
the PDF for the system. In Section 3, we derive the theoretical
performance, such as the SNDR (as a function of n), and
error rate, and also statistical channel capacity. In Section 4,
an extension of the results to an oversampled SLM model,
implementing the “clipping and filtering” technique [14], is
tackled. Finally, we conclude this paper in Section 5.
2. Multiple Candidate System
2.1. Description. In this section, we describe the multiple
candidate solution for reduction of PAPR. Figure 1describes
the multiple candidate system and our PDF notation for
several variables. ncandidates (frequency domain signal) are
generated by the candidate generator, where this candidate
generator represents a class of probabilistic methods such as
the SLM method [8–10] or the interleaving method [11–
13]. After the N-point Inverse Discrete Fourier Transform
(IDFT), we get the nOFDM candidates (time domain
signal), xi={xi,1,xi,2,...,xi,N},i∈{1, ...,n}. When we
define ri,j|xi,j|, then
|x1|=r1=r1,1,r1,2,...,r1,N−1,r1,N,
|x2|=r2=r2,1,r2,2,...,r2,N−1,r2,N,
.
.
..
.
.
xi0
=ri0=ri0,1,ri0,2,...,ri0,N−1,ri0,N,
.
.
..
.
.
|xn|=rn=rn,1,rn,2,...,rn,N−1,rn,N,
(1)
and the peak detector selects the i0th candidate, where i0=
argmini(maxj{ri,j})fori∈{1, ...,n}and j∈{1, ...,N}.
Then, the selected (i0th) OFDM signal candidate is clipped
by a nonlinear amplifier, where we consider the soft clipping
model [13] as follows:
xi0,j=gxi0,j⎧
⎪
⎪
⎪
⎨
⎪
⎪
⎪
⎩
xi0,j,for
xi0,j
≤A,
A·xi0,j
xi0,j
,for
xi0,j
> A,(2)
where Ais the maximum permissible amplitude for the
clipping model.
The clipped i0th candidate is transmitted to the receiver
with its side information, where the side information
contains the information of i0and it is used for recovering the
original data. The side information protection depends on
the various protection strategies, such as no side information
method [9,10] or coded side information method [12].
However, in this paper, for analyzing the pure effect of
increasing nfor the multiple candidate system, we assume
that the side information is sent without errors.
Throughout this paper, the following are also assumed:
according to the central limit theorem, the complex OFDM
signal, which consists of a number of independent orthog-
onal subcarriers, is modeled as a complex Gaussian process
with Rayleigh envelope distribution. In addition, since the
OFDM modulation is strictly band limited, we consider only
in-band distortion.
2.2. PDF Analysis. Based on the assumption that the OFDM
signal xi,jfor i∈{1, ...,n}and j∈{1, ...,N}is
complex Gaussian distributed with mean 0 and variance 1,
the envelope ri,j=|xi,j|is Rayleigh distributed with PDF fr
given by
fr(r)=⎧
⎨
⎩
2r·exp−r2,forr≥0,
0, for r<0.(3)
According to the largest order statistics [15], the distribu-
tion of the maximum of the amplitude values maxj{ri,j}∼
frmax is given by
frmax (r)=Nf
r(r)r
−∞ fr(x)dxN−1
=Nf
r(r)1−exp−r2N−1.
(4)
When we select the candidate having a minimum peak
amplitude among ncandidates, according to the smallest
order statistics [15], we obtain the PDF of the peak amplitude
of the selected candidate mini[maxj{|xi,j|}]∼frmax∗(r),
using frmax (r):
frmax∗(r)=n·frmax (r)·∞
rfrmax (x)dxn−1
=2nNrS(r)N−1−S(r)N·1−S(r)Nn−1,
(5)
where ∞
rfrmax (x)dx =1−(1 −exp(−r2))Nand S(r)=1−
exp(−r2).
We now want to know the PDF of amplitude of the
selected candidate ri0∼fr∗.In(5), we have obtained frmax∗(r)
from frmax (r) using the smallest order statistics. Furthermore,
since maxj{ri0,j}=mini[maxj{ri,j}]∼frmax∗(r), we can also
express frmax∗(r) as a function of fr∗(r) using the largest order
statistics. Then,
frmax∗(r)=N·fr∗(r)·r
0fr∗(x)dxN−1
=dFr∗(r)N
dr ,
(6)
where Fr∗(r)=r
0fr∗(x)dx.From(6), we can obtain
Fr∗(r)=r
0frmax∗(x)dx1/N
.(7)

EURASIP Journal on Wireless Communications and Networking 3
Original
binary
data
Multi candidate
generator
+
modulation
IDFT
IDFT
IDFT
IDFT
Peak
detector
...
...
Select
i0
Soft
clipping
Side information
xi={xi,1,··· ,xi,N}
x1
x2
x3
xnx∗=xi0
|xi,j|∼ fr
|xi0,j|∼ fr∗
i0=argimin{maxj|xi,j|}
mini[maxj{|xi,j|}]∼frmax∗
maxj{| xi,j|} ∼ frmax
maxj{|xi0, j|}
Figure 1: Multiple candidate system and its PDF notation for several variables. We define ri,j|xi,j|, and the peak detector selects the i0th
candidate, where i0=argmini(maxj{ri,j})fori∈{1, ...,n}and j∈{1, ...,N}.
So, the PDF of the amplitude of the selected candidate is
given by
fr∗(r)=Fr∗(r)
=1
Nr
0frmax∗(x)dx1/N−1
·frmax∗(r)
=nf
r(r)·1−1−S(r)Nn1/N−1
·S(r)N−1·1−S(r)Nn−1,
(8)
where S(r)=1−exp(−r2).
Figure 2gives a comparison between the analytical and
the simulation PDF in logarithm scale. Notice that the
analytical line fits the simulation points.
3. Theoretical Performance
3.1. SNDR(n)for Multiple Candidate System. Now, we apply
(8) to obtaining the signal-to-noise-plus-distortion ratio
(SNDR) as a function of n, by using Ochiai’s method [13].
The authors in [13] used the Rayleigh PDF, fr, to obtain the
SNDR of a multiple candidate system. However, as shown
in Figure 2, the PDF of amplitude of the selected candidate
is not Rayleigh PDF anymore, being the function of n.
Therefore, we use the PDF of (8), fr∗, to obtain the SNDR of
multiple candidate system, and hereafter we will use SNDR(n)
as a function of n, instead of SNDR.
For that, the PAPR threshold for clipping λis defined
as λ(A(n))2/P(n)
in , where the input power P(n)
in =∞
0r2·
fr∗(r)dr and A(n)is the maximum permissible amplitude for
the multiple candidate system.
Then, based on fr∗in (8), the total output power for the
multiple candidate solution after clipping is obtained as
P(n)
out =A(n)
0r2fr∗(r)dr +∞
A(n)A(n)2fr∗(r)dr,(9)
and the signal distortion rate, α(n),isgivenby
α(n)=A(n)
0r2fr∗(r)dr +∞
A(n)A(n)rf
r∗(r)dr
P(n)
in
.(10)
Then, K(n)
γ, total attenuation factor, is the following:
K(n)
γ=S(n)
P(n)
out =α(n)2P(n)
in
P(n)
out
.(11)
Finally, SNDR(n)for the multiple candidate technique is
given by
SNDR(n)=K(n)
γEs/N0
1−K(n)
γEs/N0+1.(12)
3.2. Error Rate. Since we assume that the side informa-
tion is transmitted without errors, the BER of QPSK-
modulated signal over the AWGN channel is given by PB=
Q(SNDR(n)). Furthermore, QPSK symbol error rates (SER)
areasfollows:PS=1−(1 −PB)2.
For the frequency-nonselective slowly (constant attenu-
ation during one OFDM symbol) Rayleigh-fading channel
[16], the BER is given by
PB=∞
0Q⎛
⎜
⎝
κ2K(n)
γEs/N0
κ21−K(n)
γEs/N0+1
⎞
⎟
⎠fr(κ)dκ,(13)
where κis the channel attenuation which is Rayleigh
distributed with E[κ2]=1.
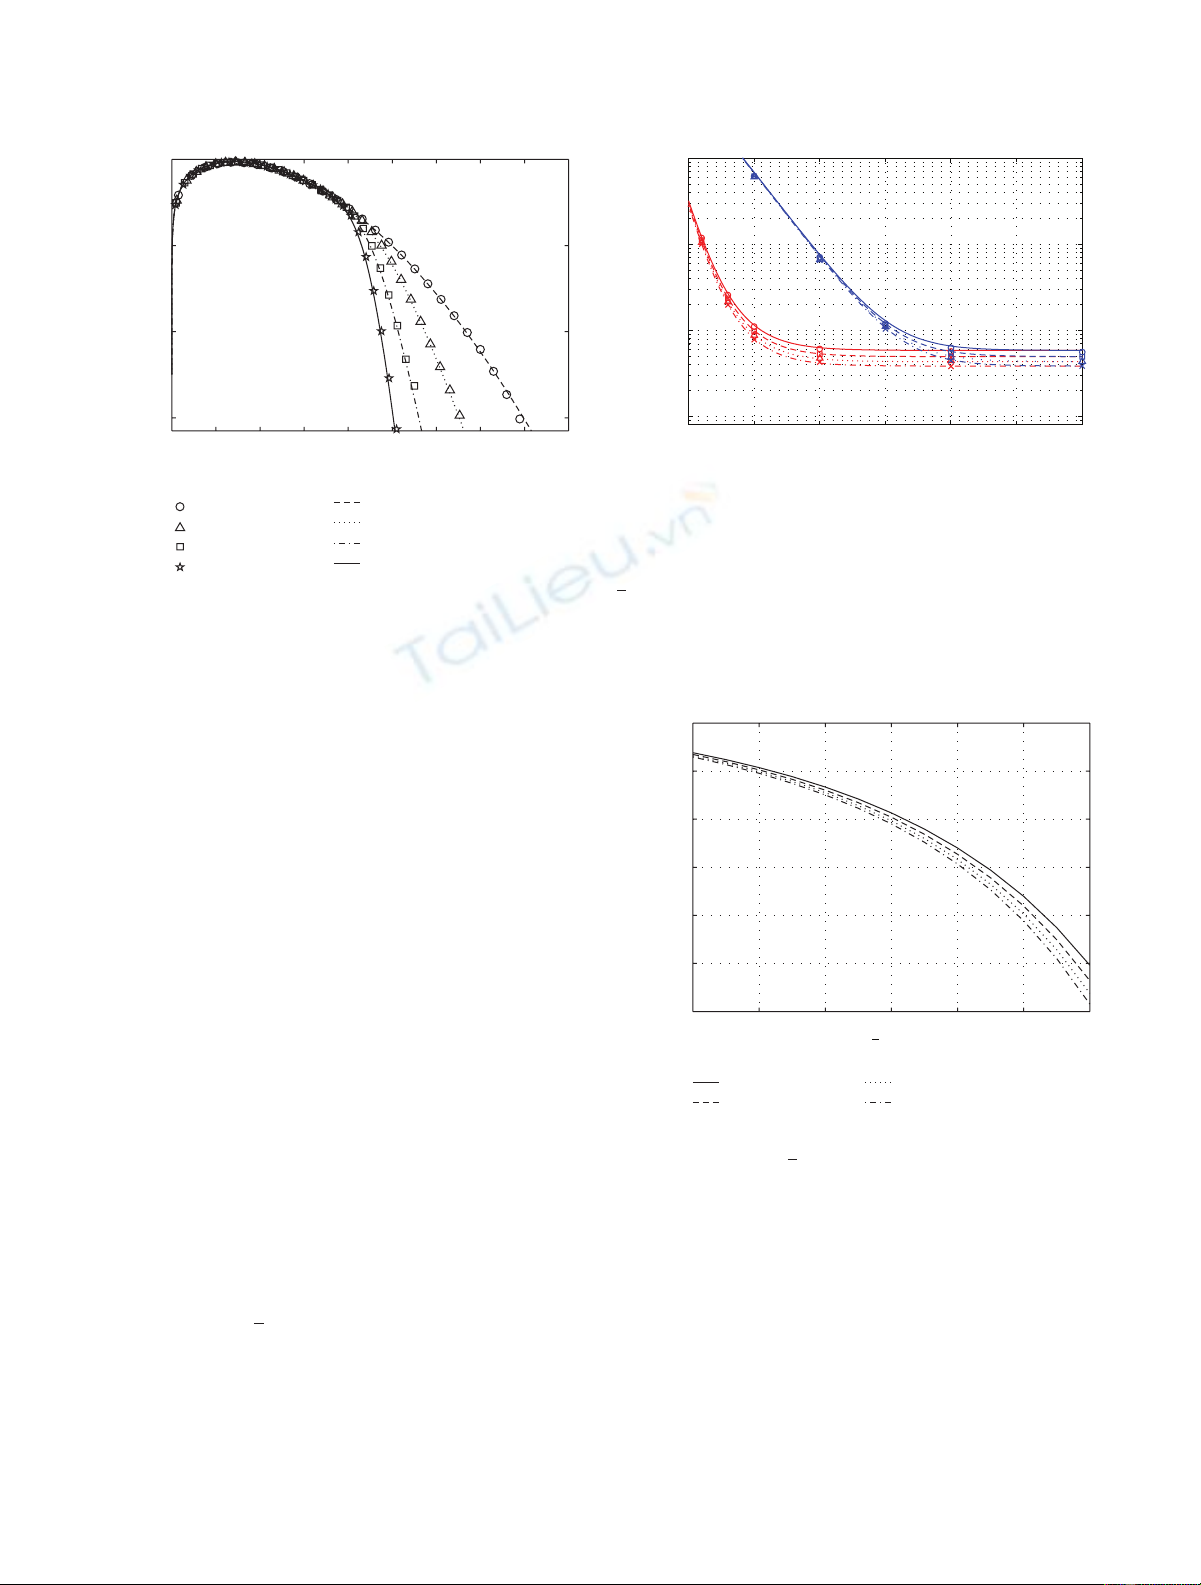
Figure 3shows the error performance comparison over
AWGN channel and frequency-nonselective slowly fading
channel, where the analytical approach and the simulation
results are compared. For the simulations, 1024-point FFT
pairs are considered and the signals are modulated by QPSK.
At the transmitter, the OFDM signals are clipped at λ=0dB.
In the figure, we can see that the simulated SER is well
matched on the analytical line, and an error floor appears at
large SNR because of the clipping noise. In addition, we can
see better error performance, when nincreases.
Since our theoretical analysis matches well the simula-
tions, we can estimate the analytical frame error floor as a
function of the PAPR threshold λ(see Figure 4). We can see
that the error floor level can decrease, by increasing nand/or
λ. Our analytical approach makes it possible to foresee the
expected level of the error rate without a time-consuming
simulation.
4 EURASIP Journal on Wireless Communications and Networking
0 0.5 1 1.5 2 2.5 3 3.5 4 4.5
100
10−2
10−4
10−6
n=1, simulated
n=2, simulated
n=4, simulated
n=8, simulated
n=1, analytical
n=2, analytical
n=4, analytical
n=8, analytical
fr∗in logarithmic domain
Amplitude, |x|
Figure 2: Analytical and simulated logarithmic PDF for fr∗(x)
corresponding to N=128.
3.3. Channel Capacity. We consider the channel capacity of
selected and clipped OFDM symbols for a multiple candidate
system. For this, we take into consideration the M-ary
Input AWGN channel models [17]. Suppose that the receiver
knows the exact information about which candidate has
been transmitted. Then, the channel capacity of transmitted
symbols is CM-ary =h(yi0)−h(yi0|xi0), where yi0is the
received symbol, and from which we may write
CM-ary =−
+∞
−∞p(I,Q)log2p(I,Q)dI dQ
−log22πeσ2,
(14)
where p(I,Q) is the two-dimensional PDF of received
symbol with the Gaussian noise variance σ2=0.5/SNDR(n)
in each dimension.
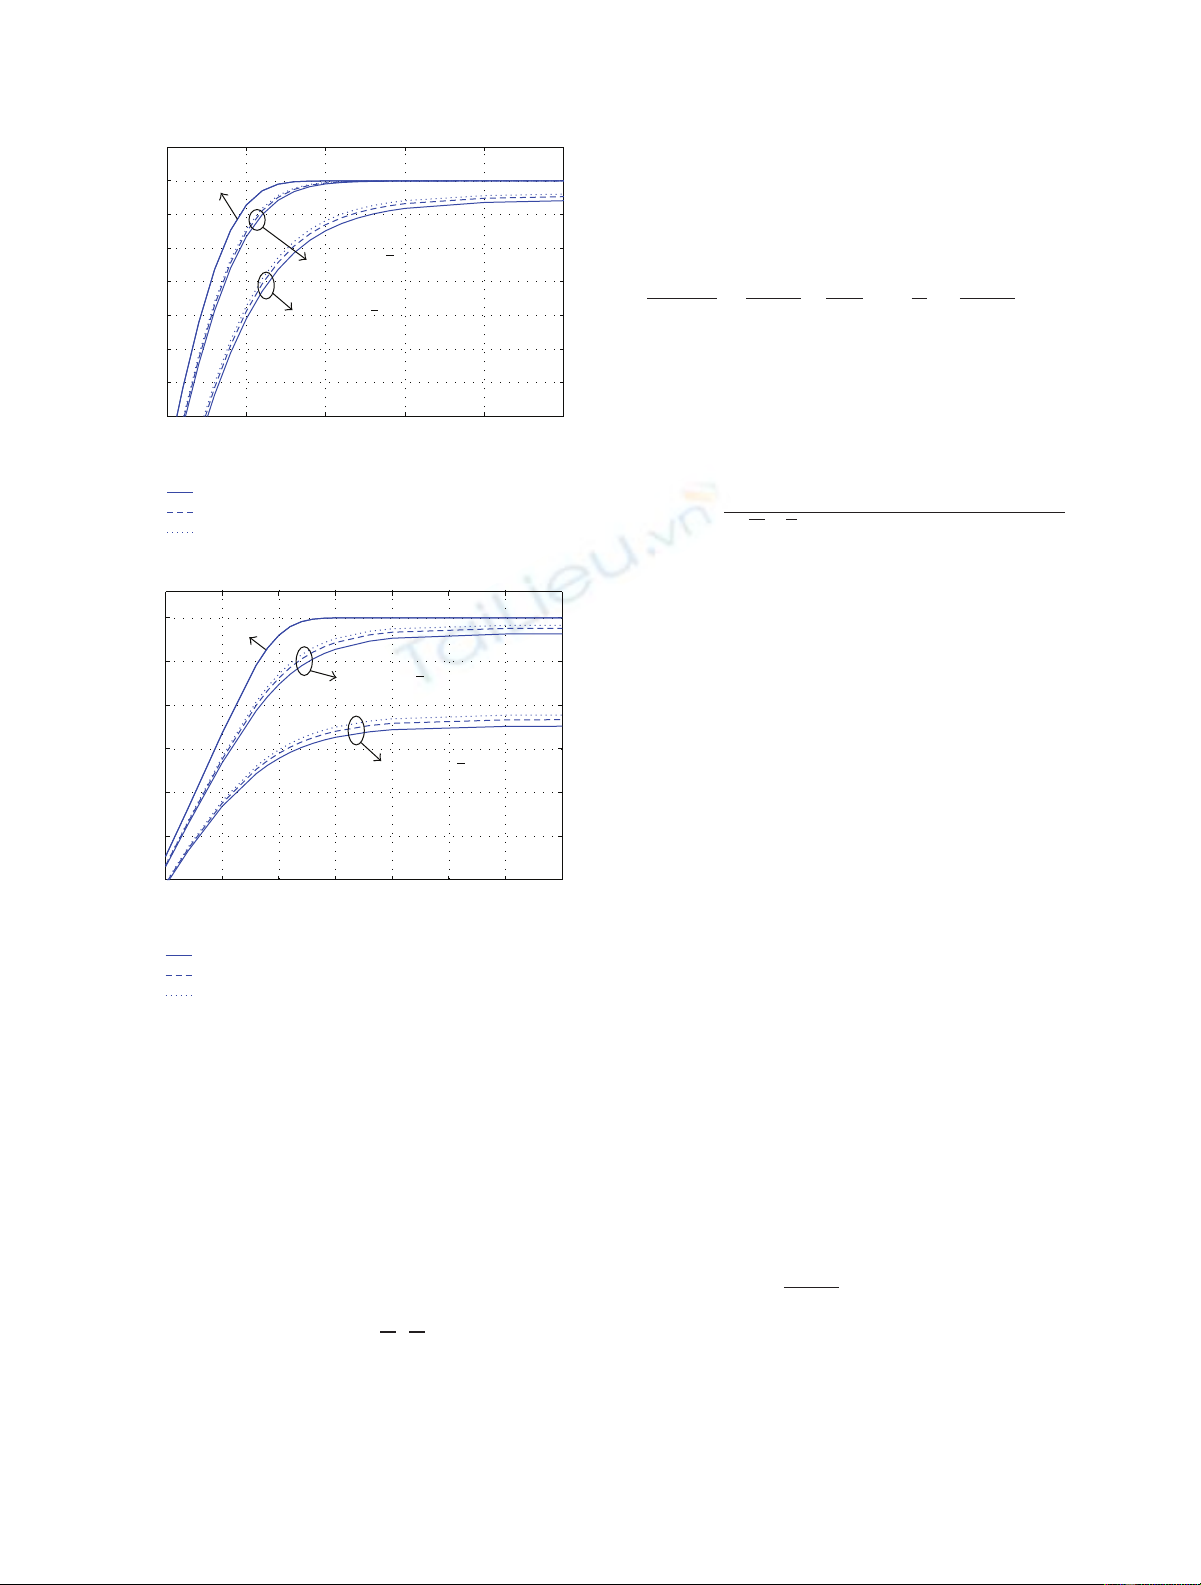
Figure 5illustrates the channel capacity for 16-QAM case
(up) and 64-QAM case (down) over M-ary Input AWGN
channel. The figure implies that, due to the clipped symbol,
it is impossible to achieve error-free performance. However,
as the number of candidate increases, we can obtain
theoretical capacity gains as long as SNDR(n)increases. In
particular, the channel symbols of M-QAM, where M
16, are so sensitive to the clipping noise that the multiple
candidate system can attain additional channel capacity gains
effectively. When SNR =45 dB, the measured capacity gain
is 0.1284 bits/channel symbol with 16 candidates (64-QAM
symbols clipped at λ=2dB).
4. Application: Oversampling and Filtering
We present an extension of the multiple candidate system:
combination with an oversampling and filtering technique
[14]. For the single-candidate system, an OFDM symbol
10 20 30 40 50 60 70
10−2
10−3
10−4
10−5
Eb/N0(dB)
SER
Figure 3: Symbol Error Rate (SER) comparison between the
analytical approach (line) and the simulation results (marker) over
AWGN channel (red) and frequency-nonselective slowly fading
channel (blue), where the data is QPSK modulated, and 1024-
point FFT pairs are considered. The OFDM symbols are clipped at
λ=0 dB. In the figure, the lines represent our analytical approach,
such as solid line (n=1), dash line (n=2), dot line (n=4), and
dash-dot line (n=8). The markers represent the simulation results,
such as ◦(n=1), (n=2), (n=4), ×(n=8).
0 0.5 1 1.5 2 2.5 3
100
10−2
10−4
10−6
10−8
10−10
10−12
λ(dB)
N=1024, n=1
N=1024, n=2
N=1024, n=4
N=1024, n=8
Analytical frame error floor
Figure 4: Analytical Frame Error Rate at the error floor level for
the clipping threshold λ. In the case, N=1024 and the QPSK
modulation is considered.
with a large Nis usually assumed to have a Gaussian PDF
in the real and imaginary parts. However, for the multiple
candidate system, this Gaussian assumption no longer holds.
In this section, we show mathematical non-Gaussian PDF for
the multiple candidate system.
4.1. Presentation of Extended Model. The multiple candidate
system in the presence of the soft limiter can be extended to
the oversampling and filtering technique [14]. In this case,
nfrequency domain OFDM symbols Xi={Xi,1,...,Xi,N}
EURASIP Journal on Wireless Communications and Networking 5
10 15 20 25 30 35
3.3
3.4
3.5
3.6
3.7
3.8
3.9
4
SNR (dB)
Capacity (bits/channel symbol)
Clipped at λ=4dB
Unclipped
Clipped at λ=2dB
n=1
n=4
n=16
(a)
n=1
n=4
n=16
10 15 20 25 30 35 40 45
3
3.5
4
4.5
5
5.5
6
SNR (dB)
Capacity (bits/channel symbol)
Unclipped
Clipped at λ=4dB
Clipped at λ=2dB
(b)
Figure 5: Channel capacity for 16-QAM case (a) and 64-QAM case
(b), where N=1024 and M-ary Input AWGN channel (MI-AWGN)
is considered.
are zero-padded, and L-times oversampled IDFT processes
are performed, generating ncandidates xi={xi,1,...,xi,LN }
in the time domain, where the L-times oversampled IDFT
operation is denoted as
xi=IDFT⎛
⎜
⎜
⎝L,⎧
⎪
⎪
⎨
⎪
⎪
⎩Xi,0,...,0
!" #
(L−1)N
⎫
⎪
⎪
⎬
⎪
⎪
⎭
⎞
⎟
⎟
⎠.(15)
Then, the candidate xi0={xi0,1,...,xi0,LN }with the
minimum PAPR is selected, and clipped by the soft limiter,
where |xi0,k|∼fr∗,k∈{1, ...,LN},asin(8). The clipped
signal xi0={xi0,1,...,xi0,LN }goes through a band pass filter
(BPS) which removes out-of-band frequency components,
yielding a filtered signal 'xi0={'xi0,1,...,'xi0,N}which will be
converted into an analog signal 'xi0(t).
Let SNDR(n)
kbe the SNDR of the kth subcarrier for n
candidate system, then its inverse can be expressed as [14]
1
SNDR(n)
k=1
SDR(n)
k
+1
SNR ⎛
⎝1+ 1
N
N−1
(
k=0
1
SDR(n)
k
⎞
⎠, (16)
where SNR denotes the signal-to-noise ratio for the channel,
and SDR(n)
kdenotes the signal-to-distortion ratio of the kth
subcarrier for ncandidate system.
In (16), SDR(n)
kcan be expressed as [14]
SDR(n)
k=K(n)
γ
√N/√LDFTL,)Rxi0[m]/P(n)
out*k−K(n)
γ
,
(17)
where P(n)
out is given in (9)andRxi0[m] is the autocorrelation
function of the clipped signal.
Let xi0,ka1+jb1and xi0,k+ma2+jb2, then the clipped
signals are given by xi0,kg(a1+jb1)andxi0,k+mg(a2+
jb2), and the autocorrelation function Rxi0[m]isgivenby
Rxi0[m]=R)E
x∗
i0,k·xi0,k+m*
=E+g∗a1+jb1ga2+jb2,
=D(a1,b1,a2,b2)g∗a1+jb1ga2+jb2
·f(a1,a2,b1,b2)da1db1da2db2,
(18)
where E[·] denotes the expectation operation.
4.2. Inaccuracy of Gaussian Assumption. For the single can-
didate case, since {a1,a2,b1,b2}are assumed to be Gaussian
distributed, f(a1,a2,b1,b2) is expressed as a joint Gaussian
PDF [14,18]. However, for the multiple candidate case
(n>1), since the amplitude of the selected candidate is not
Rayleigh distributed, such as (8), this Gaussian assumption
no longer holds. In the rest of this paper, we consider the
PDF of {a1,b1,a2,b2}∼fafor the multiple candidate case.
Without loss of generality, we consider a=a1and b=b1,
where aand bare assumed to be independent and identically
distributed. Then, the amplitude is defined as
h-a2+b2∼fh(r)=fr∗(r),(19)
where fr∗(r)isgivenby(8).
Defining a power variable yh2≥0, its characteristic
function [15]isgivenby
ϕy(ω)=∞
0expjωr2fh(r)dr, (20)


![Báo cáo seminar chuyên ngành Công nghệ hóa học và thực phẩm [Mới nhất]](https://cdn.tailieu.vn/images/document/thumbnail/2025/20250711/hienkelvinzoi@gmail.com/135x160/47051752458701.jpg)


