
P. Rozenberg et al.Clonal reaction to water deficit
Original article
Clonal variation of wood density record of cambium reaction
to water deficit in Picea abies (L.) Karst
Philippe Rozenberg*, Julien Van Loo, Bjorn Hannrup and Michael Grabner
INRA Orléans, Unité d’Amélioration, Génétique et Physiologie Forestières, BP 20619, Ardon 45166 Olivet Cedex, France
(Received 16 August 2001; accepted 6 February 2002)
Abstract – Water deficit during the growing season affects cambium activity; a water deficit during the first part of the growing season results in
the formation of latewood-like cells. If this event is followed by a return to favourable water conditions, a microdensity profile drawn radially
through the ring will reveal a density peak in the earlywood. This study proves that some characteristics of the peak formed in the earlywood of
the ring 1993 in the trees of a Swedish Norway spruce clonal test (2 sites, 20 clones) are genetically controlled. The peak position in the ring is the
most genetically controlled peak characteristic. The observed variability for the peak position in the ring can be related with an hypothesis
concerning the presence of some degree of genetic control of the kinetic of the cambium reaction to environmental variation.
genetics / microdensity / water deficit / Norway spruce
Résumé – Variabilité clonale de la réaction du cambium à un déficit en eau chez Picea abies (L.) Karst. Un déficit en eau en cours de saison
de végétation affecte l’activité du cambium ; si le déficit se produit en première partie de saison de végétation, on observe dans le bois initial du
cerne formé cette année-là des cellules de type « bois final ». Si le déficit en eau est suivi d’un retour à des conditions favorables, un profil micro-
densitométrique tracé dans ce cerne révèle alors un pic de densité dans le bois initial. Cette étude met en évidence l’existence d’un contrôle géné-
tique des caractères de ce pic de densité pour le cerne formé en 1993 chez les arbres d’un test clonal suédois (2 sites, 20 clones). Le caractère du
pic le plus fortement contrôlé génétiquement est la position du pic dans le cerne. La variabilité ainsi observée de la position du pic dans le cerne
peut s’expliquer grâce à l’hypothèse de l’existence d’un certain contrôle génétique de la cinétique de la réaction du cambium aux variations de
l’environnement.
génétique / microdensité / déficit en eau / épicéa commun
1. INTRODUCTION
Breeding for adaptation is generally the first and most im-
portant goal of forest tree improvement programs. Adapted
trees are trees that are physiologically suited for high sur-
vival, good growth and resistance to pests and adverse envi-
ronments [35]. In order to select for adapted trees, it is
necessary for the tree breeder to be able to estimate genetic
variability of the tree response to pest and unfavourable con-
ditions.
In case of adverse environment, survival and growth are
affected. The product of tree growth is wood. Wood forma-
tion is a complex process initiated in the cambium. Under
temperate climates, this process is periodic. Cells originating
from the cambium during one growing season design a ring.
The cell anatomical characteristics are very different accord-
ing to their date of formation: for softwoods, wood produced
at the beginning of the growing season (earlywood) is made
of cells with thin walls and large lumen. Wood produced at
the end of the growing season (latewood) is made of
thick-wall, small lumen cells [15]. These differences have
been shown to be a direct consequence of the global environ-
mental change during the growing season [28]. Photoperiod
[5, 14, 16] and climate [18, 19] influence cambium activity,
and thus wood formation and wood basic properties. Nature
of the soil also influences wood formation [1, 9, 32].
Ann. For. Sci. 59 (2002) 533–540 533
© INRA, EDP Sciences, 2002
DOI: 10.1051/forest:2002038
* Correspondence and reprints
Tel.: 02 38 41 78 73; fax: 02 38 41 78 79; e-mail: philippe.rozenberg@orleans.inra.fr

Water availability during the growing season is one of the
main constraints for tree growth [4, 32]. It can influence the
characteristics of the ring formed during the same growing
season, and during the next growing season [32]. Earlywood
is wider for trees well irrigated, while it is narrower for trees
submitted to drought (experiments on Pinus resinosa, [31],
and Pinus sylvestris, [22]. For different softwood species, a
water deficit during the first part of the growing season re-
sults in the formation of latewood-like cells. If this event is
followed by a return to favourable water conditions, the cam-
bium will form again earlywood-like cells [30]. A
microdensity profile [20] drawn radially through this ring
will reveal a density peak in the earlywood [6]. If the maxi-
mum density of this peak is close to the maximum density of
the latewood, this feature is known as a “false ring” [11, 17,
24]. The density peak in the earlywood can thus be under-
stood as a record of the cambium reaction to a water deficit
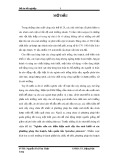
[6, 31]. Such a density peak was observed in the earlywood of
most Norway spruce trees from a two-sites clonal test in
southern Sweden (figure 1). At the same time, a close exami-
nation of the rainfall during year 1985 to year 1997 revealed a
rainfall deficit during late 1992 and early 1993 (figure 2).
Hence it seems reasonable to relate the density peak in the
earlywood of ring 1993 to the water deficit in 1992–1993.
The objectives of this study are:
– to study the influence of the water deficit in 1992 and 1993
on some anatomy and microdensity characteristics of the
Norway spruce wood samples;
– to study the site and the clonal variation of some variables
describing the characteristics of the density peak in the
earlywood of ring 1993;
– to discuss the consequences of the study results on the Nor-
way spruce breeding program, and especially on the selec-
tion for adaptation to water deficit.
2. MATERIALS AND METHODS
2.1. Plant material
The samples of the study were collected on felled trees in 1998 in
a single-tree plot clonal test established at two sites (Hermanstorp
and Knutstorp) with very similar climates in southern Sweden in
1978, in the frame of European Union Research Project Geniality
(FAIR CT95 0909). At Hermanstorp 182 cuttings from 43 clones
were selected, and 125 cuttings from 30 clones were selected at
Knutstorp; 20 clones were common to both tests. The 307 trees were
19-year-old at the time of the sampling. Detailed information about
the tests and the sampling is available in [2].
The samples (discs cut at 1.5 m in the stem) were distributed
among the partners of the European project Geniality [2].
2.2. Variables and data analysis
– Partner BOKU, Austria, observed wood anatomy. Discs were
sanded and crossdated. The anatomy of the wood was observed mi-
croscopically. Among the wood anatomy traits observed, number
and density of resin ducts in each ring, and number of cracks within
rings were used in this study [8].
534 P. Rozenberg et al.
1993 1993
Pith
Bark
Bark
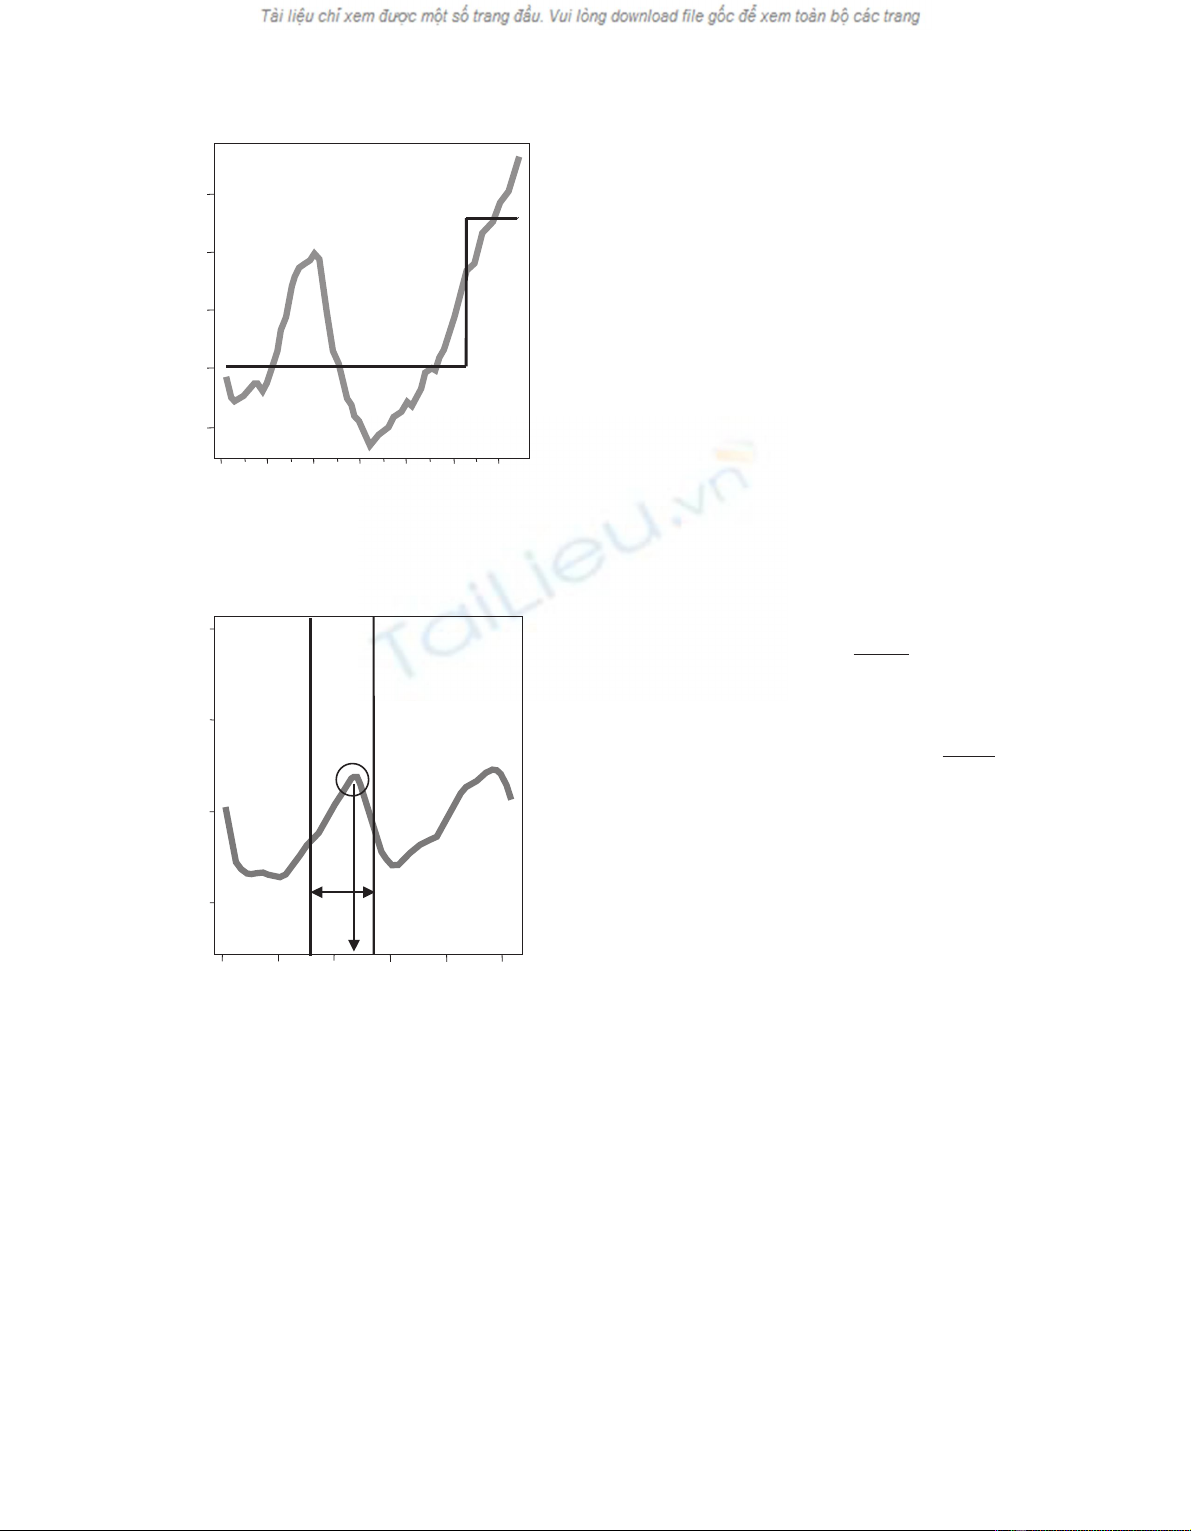
Figure 1. X-ray density profile of sample
number 2. The density peak in the early-
wood of ring 1993 can be seen.
1986 1988 1990 1992 1994 1996
50
100
150
200
250
Year
March-April-May
June-July
Cumulated Rainfall (mm)
Figure 2. Cumulated rainfall during March-April-June and June-July
in southern Sweden (data from Swedish National Meteorological Ser-
vice). A relative deficit can be seen in 1992 (June-July) and in 1993
(March-April-March).
– Partner INRA, France, recorded indirect X-ray microdensity pro-
files, following the method by Polge [20], and computed the
within-ring density variables according to the earlywood-latewood
(ew-lw) model [23]. A density peak was observed in the earlywood
section of the 1993 ring density profiles in most trees of the clonal
trial (figure 1). The ew-lw model is obviously not adapted to the de-
scription of the characteristics of this density peak (figure 3). Hence
we developed an automatic procedure in order to compute simple
characteristics of the density peak (figure 4). Correlation were com-
puted among the set of peak variables, and some peak variables were
discarded from the study because they were strongly correlated with
other peak variables (r > 0.95, P< 0.001). Four variables were used
for the analysis of the genetic variation of the peak characteristics:
peak maximum density, peak position in the ring, peak width and
peak proportion (peak width divided by ring width) (figure 4).
– Anatomy and microdensity were observed in adjacent samples.
– Partner Sokgforsk, Sweden, computed the genetic parameters for
the study variables.
Estimation of site and genotype variation and interaction for the
peak characteristics was performed using the following analysis of
variance model:
Yijk =µ+S
i+C
j+ S.Cij +εijk
where Yijk is the peak trait, µ is the general mean, Siis the site effect
(fixed), Cjthe clone effect (fixed because only the 20 clones that are
common to both sites are used in this analysis) and εijk is the residual
effect. Splus software [27] was used to perform that analysis.
The following mixed model was used in the calculation of the
broad sense heritability (H2) of the two clonal trials:
Yijk =µ+B
i+C
j+εijk
where Yijk is the peak trait, µ is the general mean, Biis the block ef-
fect (fixed), Cjthe clone effect (random, because all clones available
in each site are used in the analysis) and εijk is the residual effect.
Variances were estimated with the ASREML software (Gilmour
et al., 1999) and the heritability calculated as:
Hc
ce
2
2
22
=+
σ
σσ
where H2 is broad sense heritability, σ2
cis the genotypic variance
(clonal variance) and σ2
eis residual variance.
Genetic correlations were calculated as $
$
$$
rg
GG
GG
=σ
σσ
12
12
where $
σGG
12
is
the genotypic covariance between characters.
Estimates of the standard errors of the genetic parameters were
calculated from a Taylor series approximation as performed in the
ASReml software [10].
3. RESULTS AND DISCUSSION
3.1. Reaction to 1992 and 1993 water deficit
Figure 5 presents the number and density of resin ducts
per ring from 1985 to 1997. The year 1993 displays the low-
est resin ducts number and the lowest resin ducts density of
the study chronology. Figure 6 shows the number of cracks
per tree from 1985 to 1997. The number of cracks is much
higher in ring 1991 than in any other ring. According to
Grabner et al. [8], these cracks were probably formed during
1992 and are a result of a water deficit during the middle and
last part of the 1992 growing season (figure 2).
Figure 7 shows the development against physical year
(between 1985 and 1997) of latewood mean density. Ring
maximum density and ring density contrast (ring maximum
density minus ring minimum density) develop the same type
of pattern as latewood density. For each of these 3
microdensity variables, the observed value is minimum in
1993.
Clonal reaction to water deficit 535
010 30 50
250
350
450
Standardized ring width
Ring density profile (kg/m )
3
Figure 3. The earlywood – latewood model and the ring 1993: the
earlywood latewood model is not adapted to ring 1993.
Distance (x 25µm)
0 20 40 60 80 100
200
400
600
800
Density (kg/m )
3
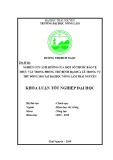
Figure 4. The figure describes the method used to compute the peak
characteristics: the vertical bars are the peak boundaries, and defines
“peak width”. These boundaries are located at the position of the peak
inflexion points. “Maximum peak density” is circled. The vertical ar-
row shows “peak position” in the ring (relative peak position in the
ring). “Peak proportion” is “peak width” divided by “ring width”.

As presented in the introduction, microdensity profiles of
most trees of both clonal trial Hermanstorp and Knutstorp
present a density peak located in the earlywood of ring 1993
(figure 1).
Hence trees in the clonal trial reacted to the 1992 and 1993
water deficit. The reaction could be observed especially in
the ring 1993 itself, through a number of anatomy and
microdensity variables, and in the ring 1991 (cracks). All the
wood variables observed here can be understood as different
ways to describe the tree reaction to a water deficit. In order
to study the genetic variation of that tree reaction to the water
deficit, we decided to focus our attention on the variables de-
scribing the characteristics of the density peak in the early-
wood of ring 1993.
Results about relationships between, on one hand, peak
characteristics, and, on the other hand, ring width and ring
density, were published in [26]: while peak width and peak
density were respectively nearly always significantly corre-
lated with ring width and ring density (quite strongly in
Knutstorp, from 0.41 to 0.95; and weakly in Hermanstorp,
from 0.07 to 0.21), no relationship was found between peak
position in the ring and neither ring width or ring density in
any of the two sites.
536 P. Rozenberg et al.
Year
1986 1988 1990 1992 1994 1996
0
2
4
6
8
Resin ducts number
Vertical bars are standard deviations
Year
1986 1988 1990 1992 1994 1996
1.0
0.5
0.0
0.5
1.0
1.5
2.0
Resin ducts density
Vertical bars are standard deviations
Resin ducts number
Resin ducts density
Figure 5. Resin ducts number and resin ducts density, observed on
the 20 clones in the 2 sites, show their minimum value in 1993.
Year
1985 1990 1995
0
2
4
6
8
Number of Cracks
Vertical bars are standard deviations
Ring 1991
Cracks number
Figure 6. the number of ring cracks observed on the 20 clones in the 2
sites reaches a maximum in 1991. The X-ray picture shows a crack in
ring 1991.
Year
1985 1990 1995
400
450
500
550
600
650
700
Latewood Density
Vertical bars are standard deviations
Latewoood density (g/dm )
3
Figure 7. Latewood density (observed on 20 clones in the 2 sites) is
minimum in 1993. Other microdensity variables showing a minimum
in 1993 are maximum ring density and ring density contrast.

3.2. Genetic and site effect on observed ring 1993
characteristics
Table I shows the results of the fixed effect analysis of
variance conducted on the peak variables.
There is a highly significant clone effect on all the peak
characteristics. The most variable characteristic is the peak
location (table I). This trait is also extremely variable be-
tween sites (table I). There is mostly no site effect for the
other peak characteristics, and mostly no strong or not signif-
icant site-clone interaction for any peak characteristic.
3.2.1. Site effect on peak location
The peak formed during the growing season 1993 is prob-
ably related with the water deficit during March, April and
May 1993 and in late 1992. The peak position in the ring is
significantly different between sites. Both sites are located in
the same climatic zone (south Sweden). Plant material
(clones) and sylviculture (plantation density and thinnings)
are the same in both sites (Karlsson, personal communica-
tion). The only big difference we found between both sites is
the nature of the soil: Knutstorp soil is clay, while
Hermanstorp soil is sand (Karlsson, personal communica-
tion). There is no doubt that water availability is very differ-
ent between clay and sand soils: after a rainfall, water is avail-
able much longer in clay soils than in sandy soils. In other
words, water deficit appears earlier in sandy soils than in clay
soils, and lasts more. Thus we conclude that the between-site
difference for the nature of the soil is related with the be-
tween-site difference for the peak position.
Hence tree reaction in Hermanstorp can be considered as a
reaction to a longer and thus more severe water deficit than in
Knutstorp. At Hermanstorp the density peak is located at
49% of the ring width, while it is at 34% in Knutstorp (fig-
ure 8). Hence a peak located at 49% of the ring width would
be a signal sent by a tree which is more stressed than when the
peak is located before in the ring: position of the peak could
be understood as a marker of the intensity of the stress en-
dured by the tree.
3.2.2. Clone effect on peak location
The clone effect on the peak position is the strongest ge-
netic effect for a peak parameter. The extreme values are 31%
(minimum, clone 27343) and 53% (maximum, clone 2816,
figure 9). For clone 2816, the density peak is nearly com-
pletely merged with the latewood. Peak position in ring 1993
is nearly independent from the other peak characteristics
(table II).
3.2.3. Heritabilities and genetic correlation of the peak
variables
Results are presented in table II.
Estimation of genetic correlation was not very accurate
(standard error of estimation is often over 0.3), especially in
Hermanstorp. Estimations of heritability and phenotypic cor-
relation were more accurate (standard error of estimation
generally under 0.1 in both trials). The peak variable with the
Clonal reaction to water deficit 537
Table I. Results of the fixed effect analysis of variance (F value and
associated probability).
F
(Probability)
Peak Maximum
Density
Peak
Position
Peak
Width
Peak
Proportion
Clone
DF 19
4.89
(<10–8)
7.34
(<10–8)
3.94
(<10–8)
3.22
(<10–8)
Site
DF 1
0.90
(0.344)
215.45
(<10–8)
3.21
(0.074)
4.34
(0.038)
Site.Clone
DF 19
1.86
(0.018)
0.87
(0.625)
1.42
(0.114)
1.13
(0.319)
Knutstorp
0 1020304050
300
400
500
600
34%
Hermanstorp
RW=3.1 mm, RD=384 g/dm
Standardized Ring Width
0 1020304050
300
400
500
600
49%
Density (g/dm3)
Standardized Ring Width
RW=3.6 mm, RD=346 g/dm
3
3
Figure 8. Mean density profiles of ring
1993 in Knutstorp and Hermanstorp; the
density peak in ring 1993 is located much
earlier in the ring in Knutstorp than in
Hermanstorp.


%20--%3e%3cdefs%3e%3cstyle%3e%20.st0%20{%20fill:%20%23fff;%20}%20.st1%20{%20fill:%20%237800fa;%20}%20%3c/style%3e%3c/defs%3e%3cpath%20class='st1'%20d='M117.78,12.18H43.11c2.9,3.47,4.65,7.94,4.65,12.82,0,5.6-2.3,10.66-6.01,14.29h76.02l7.22-13.56-7.22-13.56Z'/%3e%3cg%3e%3cpath%20class='st0'%20d='M53.58,26.17h-.59v-1.46h.59v-4.96h2.83c1.78,0,2.67.94,2.67,2.82v5.76c0,1.87-.89,2.81-2.67,2.81h-2.83v-4.96ZM55.36,21.37v3.34h1.1v1.46h-1.1v3.34h1.01c.61,0,.91-.37.91-1.1v-5.93c0-.74-.3-1.1-.91-1.1h-1.01Z'/%3e%3cpath%20class='st0'%20d='M65.99,31.14h-1.8l-.31-2.07h-2.19l-.31,2.07h-1.64l1.82-11.39h2.62l1.82,11.39ZM65.28,18.04c-.25.46-.51.77-.75.94-.21.15-.47.22-.79.22-.26,0-.57-.07-.92-.22l-.38-.15c-.14-.05-.26-.07-.37-.07-.3,0-.53.18-.71.54l-.91-.68c.25-.46.51-.77.75-.94.21-.14.48-.21.79-.21.26,0,.57.07.92.21l.38.15c.14.05.26.07.37.07.3,0,.53-.18.71-.54l.91.68ZM61.91,27.52h1.73l-.87-5.76-.87,5.76Z'/%3e%3cpath%20class='st0'%20d='M74.53,26.89v1.52c0,1.91-.89,2.86-2.67,2.86s-2.67-.95-2.67-2.86v-5.93c0-1.91.89-2.86,2.67-2.86s2.67.95,2.67,2.86v1.11h-1.69v-1.22c0-.75-.31-1.12-.93-1.12s-.93.37-.93,1.12v6.15c0,.74.31,1.11.93,1.11s.93-.37.93-1.11v-1.63h1.69Z'/%3e%3cpath%20class='st0'%20d='M81.4,31.14h-1.8l-.31-2.07h-2.19l-.31,2.07h-1.64l1.82-11.39h2.62l1.82,11.39ZM75.9,19.2l1.52-1.91h1.71l1.51,1.91h-1.61l-.76-.95-.75.95h-1.61ZM77.32,27.52h1.73l-.87-5.76-.87,5.76ZM83.1,15.99l-1.76,1.91h-1.26l1.17-1.91h1.86Z'/%3e%3cpath%20class='st0'%20d='M84.86,19.75c1.78,0,2.67.94,2.67,2.82v1.48c0,1.87-.89,2.81-2.67,2.81h-.85v4.28h-1.79v-11.39h2.64ZM84.01,21.37v3.86h.85c.58,0,.87-.36.87-1.08v-1.71c0-.71-.29-1.07-.87-1.07h-.85Z'/%3e%3cpath%20class='st0'%20d='M93.51,19.75c1.78,0,2.67.94,2.67,2.82v1.48c0,1.87-.89,2.81-2.67,2.81h-.85v4.28h-1.79v-11.39h2.64ZM92.66,21.37v3.86h.85c.58,0,.87-.36.87-1.08v-1.71c0-.71-.29-1.07-.87-1.07h-.85Z'/%3e%3cpath%20class='st0'%20d='M98.8,31.14h-1.79v-11.39h1.79v4.88h2.03v-4.88h1.83v11.39h-1.83v-4.88h-2.03v4.88Z'/%3e%3cpath%20class='st0'%20d='M105.36,24.55h2.46v1.62h-2.46v3.34h3.09v1.63h-4.88v-11.39h4.88v1.63h-3.09v3.18ZM108.17,17.29l-1.76,1.91h-1.26l1.17-1.91h1.86Z'/%3e%3cpath%20class='st0'%20d='M112.2,19.75c1.78,0,2.67.94,2.67,2.82v1.48c0,1.87-.89,2.81-2.67,2.81h-.85v4.28h-1.79v-11.39h2.64ZM111.35,21.37v3.86h.85c.58,0,.87-.36.87-1.08v-1.71c0-.71-.29-1.07-.87-1.07h-.85Z'/%3e%3c/g%3e%3ccircle%20class='st1'%20cx='25'%20cy='25'%20r='20'/%3e%3cpath%20class='st0'%20d='M32.78,19.27c2.92,0,4.43,2.55,5.28,5.33l.71,2.17c.14.38-.33.75-.71.75h-5.61c.19-.33.24-.71.09-1.08l-.75-2.45c-.43-1.32-.99-2.64-1.79-3.77.75-.57,1.65-.94,2.78-.94h0ZM25,18.38c3.25,0,4.9,2.78,5.89,5.89l.76,2.45c.14.42-.33.8-.8.8h-11.69c-.42,0-.94-.38-.8-.8l.75-2.45c.99-3.11,2.64-5.89,5.89-5.89h0ZM25,11.35c1.74,0,3.11,1.37,3.11,3.11s-1.37,3.11-3.11,3.11-3.11-1.41-3.11-3.11,1.41-3.11,3.11-3.11h0ZM17.27,19.27c1.08,0,1.98.38,2.73.94-.8,1.13-1.37,2.45-1.74,3.77l-.8,2.45c-.14.38-.05.75.09,1.08h-5.56c-.42,0-.9-.38-.75-.75l.71-2.17c.9-2.78,2.41-5.33,5.33-5.33h0ZM17.27,12.91c1.51,0,2.78,1.27,2.78,2.83s-1.27,2.83-2.78,2.83-2.83-1.27-2.83-2.83,1.27-2.83,2.83-2.83h0ZM32.78,12.91c1.56,0,2.78,1.27,2.78,2.83s-1.23,2.83-2.78,2.83-2.83-1.27-2.83-2.83,1.27-2.83,2.83-2.83h0ZM27.07,28.56v.09c0,.57-.24,1.08-.61,1.46h0v.05c-.38.33-.9.57-1.46.57s-1.08-.24-1.46-.61h0c-.38-.38-.61-.9-.61-1.46v-.09h1.41v.09c0,.19.05.38.19.47v.05c.09.09.28.19.47.19s.38-.09.47-.19v-.05c.14-.09.24-.28.24-.47t-.05-.09h1.41ZM30.99,28.56v.09c0,1.65-.66,3.16-1.74,4.24-1.08,1.08-2.59,1.79-4.24,1.79s-3.16-.71-4.24-1.79l-.05-.05c-1.04-1.08-1.7-2.55-1.7-4.2v-.09h1.41v.09c0,1.27.47,2.4,1.27,3.25h.05c.85.85,1.98,1.37,3.25,1.37s2.4-.52,3.25-1.37c.85-.8,1.37-1.98,1.37-3.25v-.09h1.37ZM34.99,28.56v.09c0,2.78-1.13,5.28-2.92,7.07-1.79,1.79-4.29,2.92-7.07,2.92s-5.23-1.13-7.07-2.92c-1.79-1.79-2.92-4.29-2.92-7.07v-.09h1.41v.09c0,2.4.94,4.53,2.5,6.08,1.56,1.56,3.72,2.5,6.08,2.5s4.52-.94,6.08-2.5c1.56-1.56,2.5-3.68,2.5-6.08v-.09h1.41Z'/%3e%3c/svg%3e)