
L. Lambs and E. MullerSap flow of poplar and willow
Original article
Sap flow and water transfer in the Garonne River
riparian woodland, France:
first results on poplar and willow
Luc Lambs*and Étienne Muller
Centre d’Écologie des Systèmes Aquatiques Continentaux (CESAC), 29 rue Marvig, 31055 Toulouse Cedex 5, France
(Received 15 January 2001; accepted 13 November 2001)
Abstract – This work is the first attempt at using Granier sap sensors on Populus nigra,Populus xeuramericana cv I45/51 and Salix
alba for the monitoring of sap flows in an active floodplain over two consecutive years. The main characteristic of these diffuse porous
trees is their capacity to use several tree rings for xylem sap transfer. Results showed that the sap flux densities remained homogeneous
on the external 4 cm of the trunk, then decreased with depth. For young trees, the active sapwood can represent half of the trunk. Results
indicated that in the same environment and at the same age, daily differences existed between the two major native riparian tree species,
the black poplar and the white willow. Their maximal sap flux density (2.6–3.6 dm3dm–2 h–1) was similar to other fast growing trees. The
influence of age was the third important screened factor. Sap flow measurements over several months indicated that water uptake was
variable throughout the season, depending on water availability, and was more pronounced for older trees. The sap flux densities for the
planted poplar (I45/51) ranged from 2.2–2.6 dm3dm–2 h–1 (about 90 dm3day–1) in the wetter spring conditions and dropped to
1.6–1.7 dm3dm–2 h–1 (about 60 dm3day–1) in less favourable conditions. Under the worst conditions, e.g., the especially long drought in
the summer of 1998, these values dropped to 1.0–1.2 (about 40 dm3day–1), and even to 0.35 dm3dm–2 h–1 (about 12 dm3day–1) for a few
days. Complementary long-term studies are needed to better understand the complex sap flow changes and to be able to relate them to si-
gnificant environmental factors. Priority should be given to the long-term monitoring of sap flows at different depths for a correct esti-
mation of actual daily water uptakes by riparian softwood trees.
sap flow / riparian forest / water cycle / poplar / willow
Résumé – Mesure des flux de sève et des transferts hydriques dans les ripisylves le long de la Garonne ; premiers résultats pour
les peupliers et les saules. Ce travail est le premier essai d’utilisation des capteurs de sève de type Granier sur du Populus nigra,duPo-
pulus xeuramericana cv I45/51 et du Salix alba pour la mesure de flux de sève dans une plaine inondable sur deux années consécutives.
La caractéristique principale de ces bois tendres est leur capacité d’utiliser plusieurs cernes annuels pour le transfert de la sève brute. Les
résultats montrent que les densités de flux de sève restent homogènes sur les quatre premiers centimètres du tronc, puis décroissent avec
la profondeur. Pour les jeunes arbres, la partie active de bois d’aubier peut représenter la moitié du tronc. Les données montrent que pour
un même environnement et pour le même âge, des différences journalières existent entre les deux espèces majeures des ripisylves, le
peuplier noir et le saule blanc. Leurs valeurs de densité de flux de sève maximale (de 2,6 à 3,6 dm3dm–2 h–1 ) sont similaires à d’autres ar-
bres à croissance rapide. L’influence de l’âge a été le troisième facteur étudié. Des mesures pendant plusieurs mois ont montré une
grande variabilité au cours de la saison, en fonction des conditions hydriques, et est plus marquée pour les arbres âgés. La densité de flux
de sève pour le peuplier planté (I45/51) varie de 2,2–2,6 dm3dm–2 h–1 (environ 90 dm3jour–1) dans les conditions humides de printemps,
Ann. For. Sci. 59 (2002) 301–315 301
© INRA, EDP Sciences, 2002
DOI: 10.1051/forest:2002026
* Correspondence and reprints
Tel. +335 62 26 99 94; Fax. +335 62 26 99 99; e-mail: lambs@ecolog.cnrs.fr

et diminue à 1,6–1,7 dm3dm–2 h–1 (environ 60 dm3jour–1) dans des conditions moins favorables. Dans les conditions extrêmes, lors de la
longue sécheresse de l’été 1998, ces valeurs tombent à 1,0–1,2 (environ 40 dm3jour–1), et même à 0,35 dm3dm–2 h–1 (environ
12 dm3jour–1) pour quelques jours. Des études complémentaires sur le long terme sont nécessaires pour mieux comprendre les change-
ments complexes des flux de sève, et pour être capable de les relier aux facteurs environnementaux significatifs. La priorité devrait être
donnée à des mesures simultanées de flux de sève à plusieurs profondeurs pour avoir une meilleure estimation des consommations jour-
nalières en eau de ces arbres riverains.
flux de sève / forêt riveraine / cycle de l’eau / peuplier / saule
1. INTRODUCTION
Sap flow measurement is the only way to follow the
water consumption of trees in their natural environment.
This technique is precise and adaptable enough to follow
the variation at a daily to seasonal scale. Many sap flow
studies have been undertaken for forest trees [4, 10, 11],
ring-porous trees such as oak [20], coniferous trees such
as pine and spruce [5, 20] and for orchards [1, 19]. How-
ever, very few authors focused on diffuse-ring trees in
wetland environments. In the literature, the latest deter-
mination of water consumption of softwood trees, as re-
viewed by Wullschleger et al. [25], concerned planted
poplar [8, 13] and some willows [3, 8].
In alluvial conditions, where the water availability is
very variable (from flood to drought), the relationship
between riparian vegetation, groundwater and stream
water is often complex [24]. Trees may tap water stored
in riverbanks or in alluvial aquifers, which may be de-
pendent on periodic flooding for their recharge, or may
tap groundwater discharged into streams [17, 4]. Al-
though a study has shown that riparian trees can be inde-
pendent of stream water in desert conditions [7], in
general, trees may switch between stream water and the
nearby groundwater source.
Experiments are not very easy to design in riparian en-
vironment because periodic floods may damage the sen-
sors and other instruments. Moreover, all species do not
strictly establish in the same conditions; therefore, strict
comparisons in controlled situations are difficult to
make.
Other than the lysimeter, the oldest system for mea-
suring sap flow is heat pulse velocity [15] and many im-
provements have been made to this system. One classic
installation consists of a single thermistor upstream and
downstream of a central heat probe. Heat pulse duration
is about one second and the measurement is quite
accurate. However, this technique requires specific
calibration. One alternative is to calculate the sap flow
from the energy balance of a sector of the hydroactive xy-
lem [2]. This measurement is independent of sapwood
thickness, but no information is given on how the water
flows in the tree rings. This system was applied to a wil-
low (Salix fragilis L.) in a polycormic form and, to follow
the tree ring activity, a stained solution was injected into
the tree [3]. However, the tree must be bored at different
places or cut into slices to visualize dye distribution.
The sap flow technique, as described by Granier in
1985 [9], is an efficient tool that is routinely used in for-
est stands and orchards. This radial sap flow meter uses a
continuously heated sensor. The Granier system mea-
sures the quantity of sap moving around the sensor for a
given sapwood area. In many ring-porous trees, only the
last (external) tree ring conducts sap. For example, in oak
(Quercus petraea), the sapwood thickness was about
20 mm, and 80% of the sap circulated was in the first
outer centimetre of the sapwood [10]. The existing
20 mm-long needles are well adapted for these kinds of
trees. In such cases, the overall water consumption by the
tree can be easily calculated and the exact thickness of
the sapwood can be checked by the difference in the
colours of a wood core extracted with an increment
borer.
For other kinds of trees, especially softwood trees,
there are indications that the active sapwood in not
limited to the external ring. For instance, for coniferous
trees such as the Scot’s Pine (Pinus sylvestris), the sap-
wood thickness is about 5 cm in a 20 cm diameter tree,
with a quite constant sap flow from 0–3.6 cm. The de-
crease is sharp and close to the sapwood/hardwood lim-
its [10]. Other authors have used a heat pulse velocity
system at different depths [12] with sensors at 0.5, 1, 2
and 4 cm depths on a 70 cm wide poplar (P. deltoides
Marsch.). Over this short distance, compared to the
wide diameter of the tree, they observed a reduction of
sap flow as a function of depth. In other studies, Granier
sensors were placed at different depths on yellow poplars
302 L. Lambs and E. Muller
(Liriodendron tulipifera L.), but the distance in centi-
metres is unknown as the increment was a function of the
width of the tree ring [26].
In poplars and willows, i.e., in diffuse porous riparian
trees, little is known of sapwood activity. Generally, the
wood core does not give any useful information because
the tree rings are not well defined [6]. Moreover, the dif-
ference in colour between the sapwood and the more in-
ternal hardwood in such small samples is not very
distinct. There are also some indications that sap flow
densities vary with the species and with the age of the
tree [25–26]. However, little is known on how it varies
with time through a growing season.
The general aim of this study was to monitor the water
consumption of the two dominant European riparian
trees, the black poplar (Populus nigra L.) and the white
willow (Salix alba L.), in the active floodplain of the
Garonne River, France. The drastic and changing soil
moisture conditions, which maintain a high biodiversity
in such riparian areas, probably imposed a high physio-
logic adaptation ability to the existing species. However,
it is not clear whether a tree can regulate water uptake in
the case of flood or drought. Nor is it clear whether, in the
same environment, differences exist between species of
the same age, or between ages, for the same species. In
addition, little is known on the active sapwood depth.
Therefore, the objectives of this study were, (1) to test
the active sapwood depth of the poplar, (2) to compare
the differences in the sap flow of a black poplar, a white
willow and a planted poplar clone of the same age, and
(3) to compare the sap flows of black poplars at two dis-
tinct ages in the same environment.
2. MATERIALS AND METHODS
2.1. Site description
The field site was a 2 km-long gravel bar, 250 m wide
along the Garonne River and located 50 km downstream
of Toulouse, France at an elevation of 90 m above sea
level. This area, about mid-length of the river, is the drier
part of the whole Garonne basin. The mean rainfall is
about 700 mm, which ranges from 900 mm at the Atlantic
coast to 1400–2000 mm on the Pyrénées slopes. This part
of the Garonne valley has a mean annual potential
evapotranspiration (Penman equation) of about 850 mm,
which means that the vegetation is in hydric deficit dur-
ing the hottest months. The Garonne River has a mean
annual discharge of about 200 m3s–1. In summer, the ob-
jective low water flood is 42 m3s–1. Normal annual floods
correspond to about 1000 m3s–1 and increase the river
level by about 2 m. On 11 June 2000, a 50 year flood of
2925 m3s–1 (plus 6 metres) destroyed both sensors and
data loggers. The site has been progressively settled by
woody vegetation over the last 15 years, with mainly
black poplars and white willows. In the floodplain, there
is a large plantation of hybrid poplar clones nearby
(Populus xeuramerica cv I45/51); this is one of the dom-
inant planted poplars in the Garonne valley. Three
transects were marked on this gravel bar and equipped
with piezometers (p), designated from p1 to p18, to mon-
itor the water table level [16]. Sap flow measurements
were made on trees located at SF1, SF2 and SF3 on the
cross-section of the third transect (the furthest down-
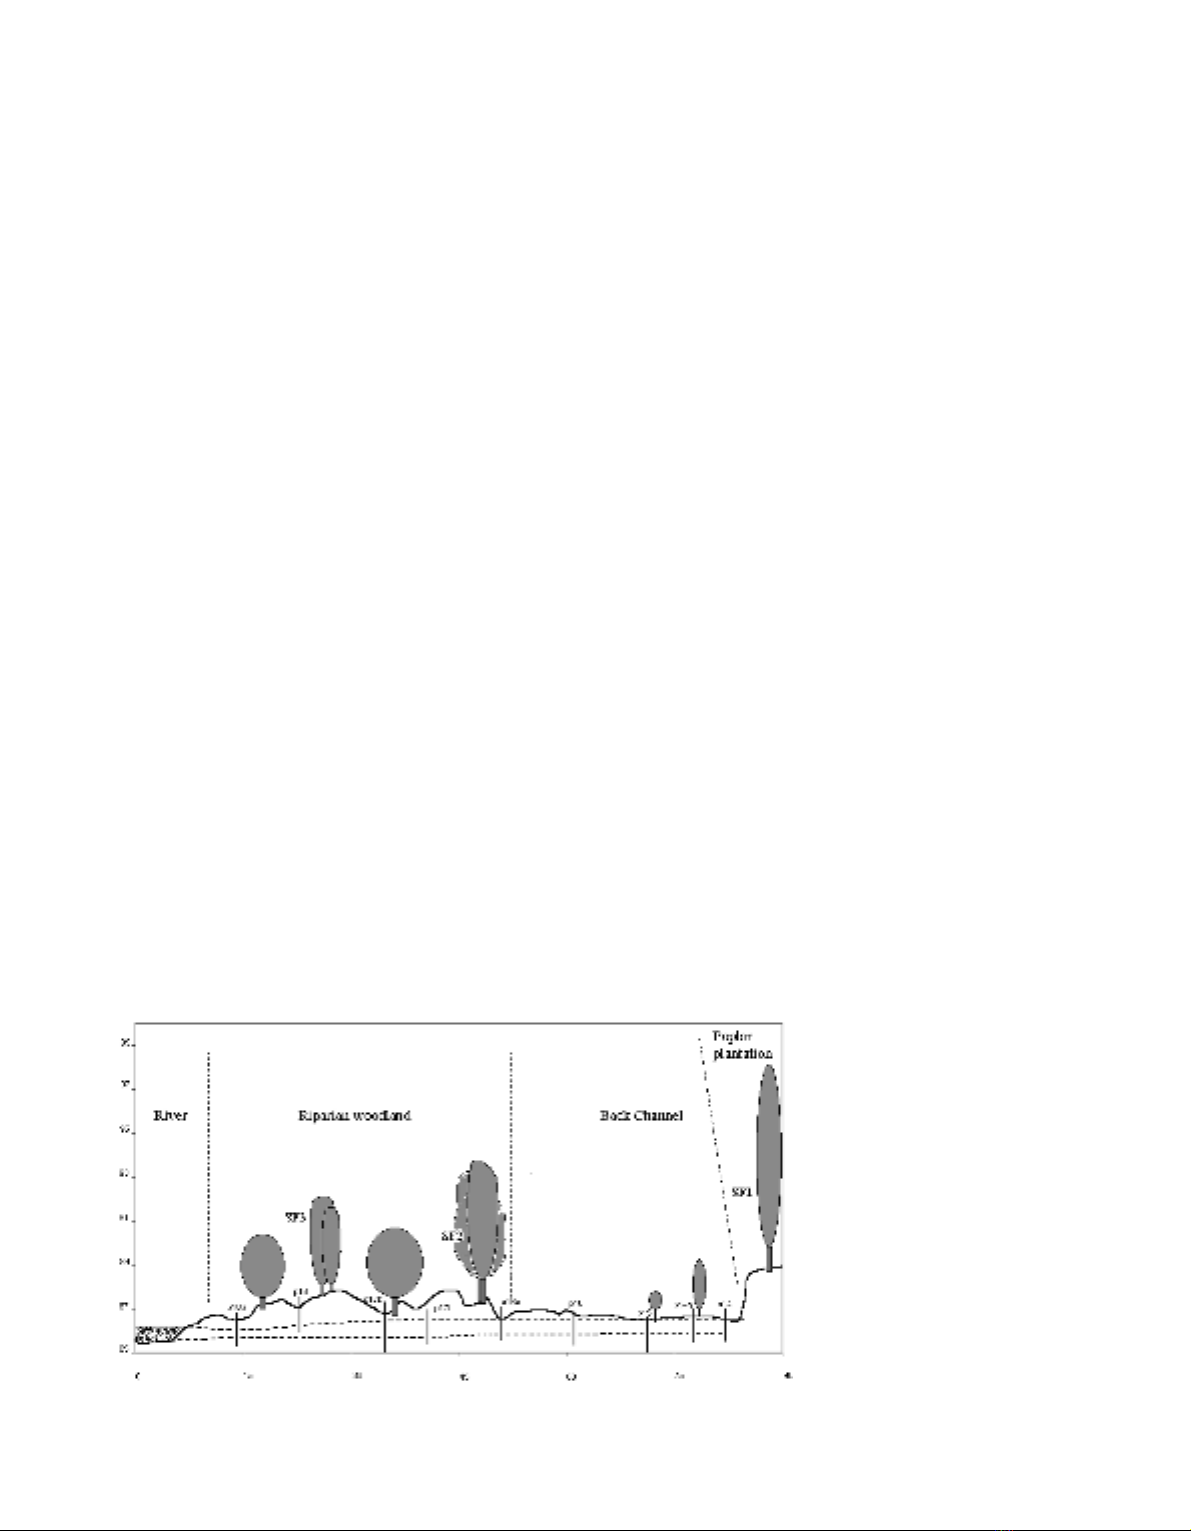
stream) as shown in figure 1. The plotted ground lines
Sap flow of poplar and willow 303
Figure 1. Field site transect on
the Garonne River, 50 km down-
stream of Toulouse, south-west
France. In abscissa, the distance
is in metres from the river at low
water. In ordinate, the eleva-
tion was measured in metres
above sea level. The two dotted
lines represent the fluctuation
of the water table depths in
1998–1999. SF1, SF2 and SF3
correspond to the sap flux
measurement area. The nine
piezometers are shown by verti-
cal lines.

were obtained from a microtopographic survey using
Rec Elta14, Zeiss equipment.
2.2. The sap flow sensors
In the nearby 10-year-old I45/51 poplar plantation,
one tree was equipped with Granier sensors from
09/06/98 to 12/11/98, with 91 days of effective data
(SF1). The heating sensors were supplied with an 80 Ah
lead battery, changed every 10 days, and used to deter-
mine the depth of the active sapwood. As only 2 cm sen-
sors were available, the problem was solved as follows: a
first sensor was maintained at the surface of the sapwood
with measurements at 0–2 cm and a second sensor was
placed into a 10 mm-wide hole to a depth of 2 cm with ef-
fective measurements at 2–4 cm. One week later, the sec-
ond sensor was inserted into a deeper hole of 4 cm with
measurements at 4–6 cm. Finally, it was inserted into a
6 cm hole with measurements at 6–8 cm. In other words,
measurements at each depth lasted one week and could
be compared with simultaneous reference measurements
at the surface (0–2 cm). All of the experimental sap flow
conditions are reported in table I. The reported elevation
corresponds to the elevation of the ground above the lo-
cal water table with the seasonal fluctuation observed be-
tween 1998 and 1999.
On SF2, a black poplar and a white willow of almost
the same age as the I45/51 poplar (9 and 10 years, respec-
tively) were found very close to each other (about 3 m),
i.e., in the same substrate and moisture conditions.
However, in the floodplain, both spontaneous trees were
located at a lower elevation than the planted poplar
I45/51 (figure 1). Sap flow surface measurements at
0–2 cm were made on both trees, with simultaneous
measurements on the I45/51 poplar. Additional deeper
measurements at 2–4 cm were also made in the black
poplar. Unfortunately, following several functioning
problems (e.g., sensor wires eaten away several times by
rodents), the days of effective data were reduced to
42 days for the black poplar and 28 days for the white
willow. However, on the black poplar, measurements at
0–2 cm and 2–4 cm were effective over 42 days. The SF2
heat sensors were supplied with two 18 W solar panels
and regulated with an 80 Ah lead battery.
The same set of sensors (SF3) was installed one year
later near the main channel of the Garonne River, on two
nearby five- and eight-year-old black poplars separated
by only 2 m. Surface measurements were made from
9/04/1999 to 07/09/1999, with 118 days of effective data.
Sensors were supplied with the same 18 W solar panels
and 80 Ah lead battery.
A Granier sensor (UP Gmbh, Germany) consists of
two cylindrical probes (20 mm long, 2 mm in diameter)
that are inserted, one above the other at a distance of
about 12 cm, into the sapwood after the bark is removed.
Each probe contains, at mid-length, a copper-constantan
thermocouple. The upper one is heated at a constant rate
by the Joule effect. The lower (reference probe) is not
heated and remains at wood temperature. The heads of
the probes are isolated with fibreglass. Each sensor was
installed on the shadiest side of the trees and isolated by
a special bi-face reflective film, including expanded
polystyrene, to reduce the external thermal disturbances
and to avoid contact with rain. The system measures the
temperature difference between the two thermocouples
wired in opposition and the temperature difference de-
crease with an increase in sap flow. During the night,
sap flow ceases, all the energy of the heating probe is
dissipated by conduction in the sapwood and the maxi-
mal temperature difference ∆T(0) is observed. When the
304 L. Lambs and E. Muller
Table I. Experimental sapflow conditions.
Tree Type Tree
density
Elevation
(m)
Age
(year)
Diameter
(cm)
Height
(m)
Sap sensor
position
Duration
(week)
SF1 Populus xeuramerica I45/51 low 2.10–2.70 10 29.0 22 2 surfaces
surface / –2cm
surface / –4cm
surface / –6cm
10
1
1
1
SF2 1Populus nigra
1Salix alba
medium 0.80–1.50 9
10
21.7
14.6
12
10
1 surface
surface / –2cm
1 surface
4
6
4
SF3 1Populus nigra “old”
1Populus nigra “young”
high 1.46–2.00 8
5
18.0
9.0
10
8
1 surface
1 surface
1 surface / dendrometer
17
15
2
sap circulates in the xylem, the temperature difference
∆T(u) decreases because the heater probe is cooled by
the sap flow (convective heat transfer). Using the
Granier calibration formula (sap flux density =
4.28*[∆T(0)/∆T(u) –1]1.231 in dm3dm–2 h–1), the sap flux
curves are computed from the temperature differences
measured between the two probes [11].
Measurements with the Granier sap sensors were
made every 30 s and averaged and recorded every 5 mn
(i.e. 288 values per day and per sensor) in data loggers
(Datahog, Skye Instrument Ltd, UK). Data were down-
loaded every 10 days in the field using a portable micro-
computer.
2.3 Others sensors
The water consumption of trees is very variable and
depends on the tree species, tree dimension, local moisture
conditions and climate. To better interpret the sap flow
data, other parameters were simultaneously recorded at
the same rate on data loggers. The photosynthetic active
radiation (PAR) was measured under the trees with JYP
gallium arsenide photodiodes (JYP 1000, SDEC,
France). The JYP sensors are suitable to PAR measure-
ments under canopies and allow high output levels with a
linear response up to 5000 µmoles m–2 s–1 [21]. The air
temperature and air humidity (Skye Instrument Ltd, UK)
were recorded under the tree canopy as well.
To monitor the trunk width variation and possible wa-
ter storage by the tree, a temperature-compensated
dendrometer (DEX 100, Dynamax, USA) was installed
on the smallest poplar in SF3 from 13/08/99 to 7/09/99.
This electronic microdendrometer used a full-bridge
strain gauge attached to a flexible arm of a calliper-style
device. The millivolt output signal shows both the
diurnal and seasonal growth of the trunk. These data
were recorded simultaneously with the sap flow mea-
surement. Long-term tree growth can be linked to water
availability using a dendrochronology approach. How-
ever, wood cores obtained from softwood trees are often
not useful as the tree rings are difficult to detect and the
cores are twisted. Nevertheless, some authors claim to
be able to do so after special preparation with sandpaper
[6]. Our experience indicates that the information is
more reliable using the wood plate. In this study,
dendrochronology was used on wood plates obtained in
SF1 from a nearby planted poplar (i.e., a clone of exactly
the same age), in SF3 from another 10-year-old black
poplar established at about the same time, and from vari-
ous other planted poplars growing along the Garonne
River. Two perpendicular lines were drawn on each
sandpapered wood plate, with their intersection in the
centre of the deeper (older) ring. On each line, the tree
rings were measured and the mean value for each year
ring was calculated from the four obtained data sets. The
rainfall values and potential evapotranspiration were ob-
tained from the Meteo-France Company of the Tarn-et-
Garonne district.
3. RESULTS
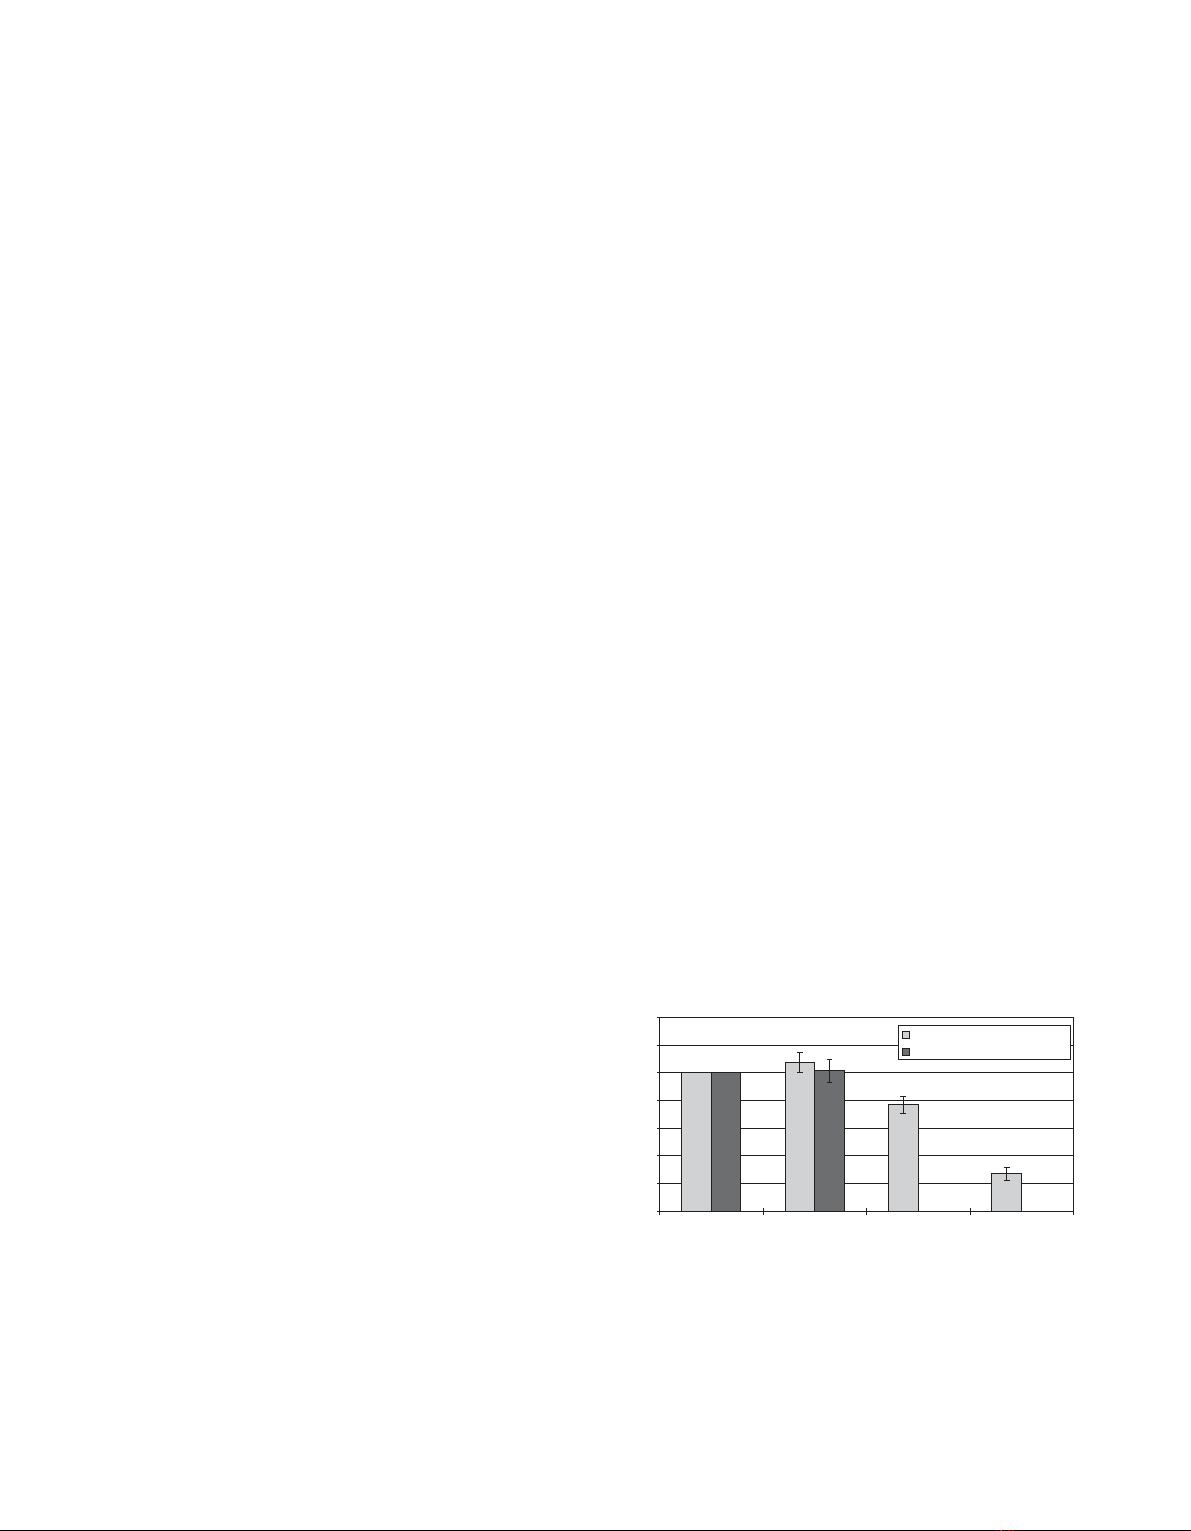
3.1. Influence of the active sapwood depth
On the I45/51 planted poplar (SF1), two sensors were
initially placed at the same depth (0–2 cm) to check the
homogeneity of the sap flow in the external tree rings.
After a few days, data were similar and the second sensor
was placed progressively deeper in the trunk with simul-
taneous measurements at the surface. Results of the test
showed that for the I45/51 poplar the sapwood activity
remained rather stable over 4 cm, then decreased with
wood depth (figure 2). At the surface (0–2cm), the sap
flux density (SFD) was taken as the reference and the
corresponding index of sapwood activity was 100%. Sur-
prisingly, at 2–4 cm, the sapwood activity remained high
(107±7dm
3dm–2 h–1), then progressively decreased to
77 (± 6) at 4–6 cm and to 27 (± 5) at 6–8 cm.
As the diameter of the tree was 29 cm, the collected
data concerned more than half of the tree rings (i.e. the
last five years of the 10-year-old poplar). In other words,
Sap flow of poplar and willow 305
0
20
40
60
80
100
120
140
0-2 cm 2-4 cm 4-6 cm 6-8 cm
wood depth
Populus x euroamerica 29 cm
Populus nigra 22 cm
SFD Index (%)
Figure 2. The sap flux density index (SFD %) is the ratio of the
maximal SFD value obtained at given depth (2–4cm, 4–6cm or
6–8 cm) by the maximal SFD value at the surface (0–2 cm) ob-
tained on the same day. The mean values obtained over one week
of measurements were plotted with the standard deviation at
each depth.


%20--%3e%3cdefs%3e%3cstyle%3e%20.st0%20{%20fill:%20%23fff;%20}%20.st1%20{%20fill:%20%237800fa;%20}%20%3c/style%3e%3c/defs%3e%3cpath%20class='st1'%20d='M117.78,12.18H43.11c2.9,3.47,4.65,7.94,4.65,12.82,0,5.6-2.3,10.66-6.01,14.29h76.02l7.22-13.56-7.22-13.56Z'/%3e%3cg%3e%3cpath%20class='st0'%20d='M53.58,26.17h-.59v-1.46h.59v-4.96h2.83c1.78,0,2.67.94,2.67,2.82v5.76c0,1.87-.89,2.81-2.67,2.81h-2.83v-4.96ZM55.36,21.37v3.34h1.1v1.46h-1.1v3.34h1.01c.61,0,.91-.37.91-1.1v-5.93c0-.74-.3-1.1-.91-1.1h-1.01Z'/%3e%3cpath%20class='st0'%20d='M65.99,31.14h-1.8l-.31-2.07h-2.19l-.31,2.07h-1.64l1.82-11.39h2.62l1.82,11.39ZM65.28,18.04c-.25.46-.51.77-.75.94-.21.15-.47.22-.79.22-.26,0-.57-.07-.92-.22l-.38-.15c-.14-.05-.26-.07-.37-.07-.3,0-.53.18-.71.54l-.91-.68c.25-.46.51-.77.75-.94.21-.14.48-.21.79-.21.26,0,.57.07.92.21l.38.15c.14.05.26.07.37.07.3,0,.53-.18.71-.54l.91.68ZM61.91,27.52h1.73l-.87-5.76-.87,5.76Z'/%3e%3cpath%20class='st0'%20d='M74.53,26.89v1.52c0,1.91-.89,2.86-2.67,2.86s-2.67-.95-2.67-2.86v-5.93c0-1.91.89-2.86,2.67-2.86s2.67.95,2.67,2.86v1.11h-1.69v-1.22c0-.75-.31-1.12-.93-1.12s-.93.37-.93,1.12v6.15c0,.74.31,1.11.93,1.11s.93-.37.93-1.11v-1.63h1.69Z'/%3e%3cpath%20class='st0'%20d='M81.4,31.14h-1.8l-.31-2.07h-2.19l-.31,2.07h-1.64l1.82-11.39h2.62l1.82,11.39ZM75.9,19.2l1.52-1.91h1.71l1.51,1.91h-1.61l-.76-.95-.75.95h-1.61ZM77.32,27.52h1.73l-.87-5.76-.87,5.76ZM83.1,15.99l-1.76,1.91h-1.26l1.17-1.91h1.86Z'/%3e%3cpath%20class='st0'%20d='M84.86,19.75c1.78,0,2.67.94,2.67,2.82v1.48c0,1.87-.89,2.81-2.67,2.81h-.85v4.28h-1.79v-11.39h2.64ZM84.01,21.37v3.86h.85c.58,0,.87-.36.87-1.08v-1.71c0-.71-.29-1.07-.87-1.07h-.85Z'/%3e%3cpath%20class='st0'%20d='M93.51,19.75c1.78,0,2.67.94,2.67,2.82v1.48c0,1.87-.89,2.81-2.67,2.81h-.85v4.28h-1.79v-11.39h2.64ZM92.66,21.37v3.86h.85c.58,0,.87-.36.87-1.08v-1.71c0-.71-.29-1.07-.87-1.07h-.85Z'/%3e%3cpath%20class='st0'%20d='M98.8,31.14h-1.79v-11.39h1.79v4.88h2.03v-4.88h1.83v11.39h-1.83v-4.88h-2.03v4.88Z'/%3e%3cpath%20class='st0'%20d='M105.36,24.55h2.46v1.62h-2.46v3.34h3.09v1.63h-4.88v-11.39h4.88v1.63h-3.09v3.18ZM108.17,17.29l-1.76,1.91h-1.26l1.17-1.91h1.86Z'/%3e%3cpath%20class='st0'%20d='M112.2,19.75c1.78,0,2.67.94,2.67,2.82v1.48c0,1.87-.89,2.81-2.67,2.81h-.85v4.28h-1.79v-11.39h2.64ZM111.35,21.37v3.86h.85c.58,0,.87-.36.87-1.08v-1.71c0-.71-.29-1.07-.87-1.07h-.85Z'/%3e%3c/g%3e%3ccircle%20class='st1'%20cx='25'%20cy='25'%20r='20'/%3e%3cpath%20class='st0'%20d='M32.78,19.27c2.92,0,4.43,2.55,5.28,5.33l.71,2.17c.14.38-.33.75-.71.75h-5.61c.19-.33.24-.71.09-1.08l-.75-2.45c-.43-1.32-.99-2.64-1.79-3.77.75-.57,1.65-.94,2.78-.94h0ZM25,18.38c3.25,0,4.9,2.78,5.89,5.89l.76,2.45c.14.42-.33.8-.8.8h-11.69c-.42,0-.94-.38-.8-.8l.75-2.45c.99-3.11,2.64-5.89,5.89-5.89h0ZM25,11.35c1.74,0,3.11,1.37,3.11,3.11s-1.37,3.11-3.11,3.11-3.11-1.41-3.11-3.11,1.41-3.11,3.11-3.11h0ZM17.27,19.27c1.08,0,1.98.38,2.73.94-.8,1.13-1.37,2.45-1.74,3.77l-.8,2.45c-.14.38-.05.75.09,1.08h-5.56c-.42,0-.9-.38-.75-.75l.71-2.17c.9-2.78,2.41-5.33,5.33-5.33h0ZM17.27,12.91c1.51,0,2.78,1.27,2.78,2.83s-1.27,2.83-2.78,2.83-2.83-1.27-2.83-2.83,1.27-2.83,2.83-2.83h0ZM32.78,12.91c1.56,0,2.78,1.27,2.78,2.83s-1.23,2.83-2.78,2.83-2.83-1.27-2.83-2.83,1.27-2.83,2.83-2.83h0ZM27.07,28.56v.09c0,.57-.24,1.08-.61,1.46h0v.05c-.38.33-.9.57-1.46.57s-1.08-.24-1.46-.61h0c-.38-.38-.61-.9-.61-1.46v-.09h1.41v.09c0,.19.05.38.19.47v.05c.09.09.28.19.47.19s.38-.09.47-.19v-.05c.14-.09.24-.28.24-.47t-.05-.09h1.41ZM30.99,28.56v.09c0,1.65-.66,3.16-1.74,4.24-1.08,1.08-2.59,1.79-4.24,1.79s-3.16-.71-4.24-1.79l-.05-.05c-1.04-1.08-1.7-2.55-1.7-4.2v-.09h1.41v.09c0,1.27.47,2.4,1.27,3.25h.05c.85.85,1.98,1.37,3.25,1.37s2.4-.52,3.25-1.37c.85-.8,1.37-1.98,1.37-3.25v-.09h1.37ZM34.99,28.56v.09c0,2.78-1.13,5.28-2.92,7.07-1.79,1.79-4.29,2.92-7.07,2.92s-5.23-1.13-7.07-2.92c-1.79-1.79-2.92-4.29-2.92-7.07v-.09h1.41v.09c0,2.4.94,4.53,2.5,6.08,1.56,1.56,3.72,2.5,6.08,2.5s4.52-.94,6.08-2.5c1.56-1.56,2.5-3.68,2.5-6.08v-.09h1.41Z'/%3e%3c/svg%3e)